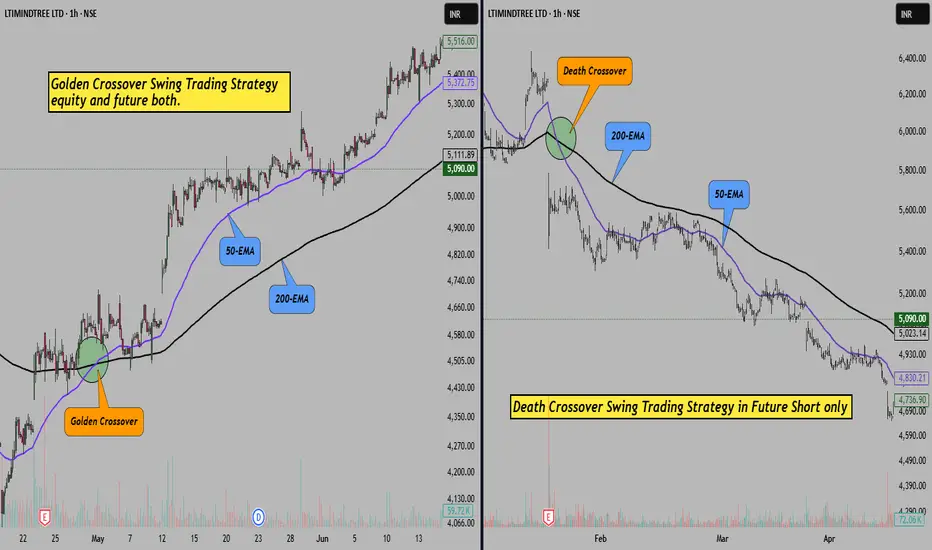
Golden EMA Setup – Catch Medium-Term Trends with 50 & 200 EMA!Hello Traders!
One of the simplest yet most powerful ways to identify long-lasting trends is by using moving averages. And among all combinations, there’s one that stands out for swing and positional trades, the Golden EMA Setup .
It uses just two tools: the 50 EMA and the 200 EMA. When used correctly, this setup helps you ride big trends and avoid choppy zones.
Let’s understand how this works and how you can apply it.
What is the Golden EMA Setup?
It’s a trend-following strategy based on the crossover of two EMAs:
50 EMA (Fast Average): Reacts quicker to price changes
200 EMA (Slow Average): Represents the long-term trend
When 50 EMA crosses above 200 EMA, it’s considered a Golden Crossover , a bullish signal.
When 50 EMA crosses below 200 EMA, it’s a Death Crossover , a bearish signal.
How to Trade This Setup:
Entry:
Buy when 50 EMA crosses above 200 EMA and price is above both.
Stop Loss:
Just below the 200 EMA or recent swing low.
Target:
Trail the stop loss and ride the trend till the crossover reverses or price weakens.
Timeframe:
Works best on daily or 1-hour chart for positional/swing trades.
Rahul Tip:
Golden EMA setup works great during trending phases, but avoid using it in sideways markets — you may get trapped in whipsaws. Always confirm with volume or RSI divergence before entering.
Did you ever used this strategy before, let me know in comment box.
Deathcross
Detailed : Solana Death Cross on Daily TFSolana is on the verge of forming a Death Cross on the daily timeframe, with the 50-day moving average (MA) set to cross below the 200-day MA in the next day or two. This technical event is often seen as a bearish signal, indicating potential downside movement.
Key Observations on Solana’s Upcoming Death Cross
Historical Context
The last major Death Cross on Solana occurred in early 2022, leading to an extended two-year bearish phase with SOL dropping from its highs.
However, past performance does not guarantee a similar outcome, especially considering different market conditions.
What Could Happen Next?
If Solana confirms the Death Cross, it may see increased selling pressure, leading to a test of key support zones.
The broader crypto market sentiment and Bitcoin's movement will play a critical role in determining if this breakdown is sustained.
Critical Levels to Watch
Support Zones: $100, $85, and $65 if a deep correction occurs.
Resistance Areas: $140–$150, where bulls must regain control for recovery.
Could This Be a Fakeout?
If Solana stabilizes above key supports or sees sudden bullish catalysts (e.g., strong ecosystem growth, and institutional inflows), it could invalidate the bearish thesis.
Market-Wide Influence
If Bitcoin remains strong, altcoins like Solana might see limited downside.
A broader crypto correction, however, could accelerate the bearish breakdown.
Final Thoughts
While a Death Cross is a bearish signal, it doesn’t guarantee a prolonged downtrend. The next few days will be critical—watch for volume, support reactions, and overall market sentiment before making strong bearish bets.
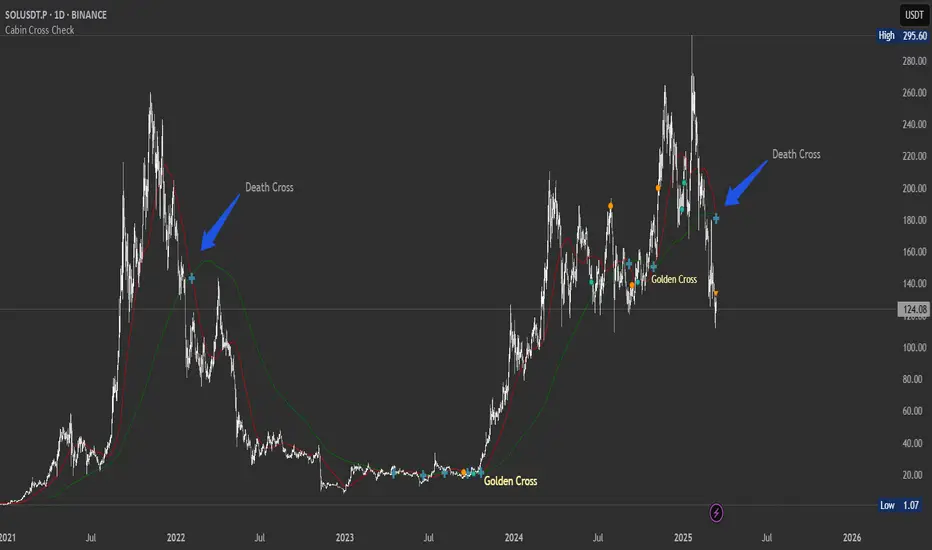
Death Cross on Solana Daily TFLooks scary. last time a proper death cross lasted 2 years.
Let me know your suggestions and ideas!

BTC DEATH CROSS IN DAILY TIME FRAME 🚨📉Description:🔍 Death Cross on BTC Daily Timeframe
When the Death Cross flashes on Bitcoin's daily chart, it typically signals a bearish scenario. Here's what you need to know:Initial Reaction: The market may initially experience a small pump, creating a false sense of security.
📈The Real Move: Following this, a significant dump often occurs, aligning with the bearish expectations.
📉BTC Price Targets:
📉 $50,000: The first line of support might be tested.
📉 $48,000: Watch for potential resistance as the price trends lower.
📉 $44,000: A deeper correction could lead to this target.

BITCOIN goes Bearish after Death Cross#BITCOIN Daily Chart Analysis
As per daily chart pattern, estimated #DeathCross will be happening up to 12-15 September and if it will be happening then Market goes in Deep #BearishZone for next 70-100 days and Bullish Trend starts late around 15-25 Nov. 2023.
A "death cross" occurs when the 50-day moving average (50MA) crosses under the 200-day moving average (200MA). It's always a bearish sign, that indicating that the market may be heading toward a longer-term of downtrend or bear market.
Always #DYOR before investing in Crypto-Currency in this Volatile situation, and Trade wisely by using #StopLoss.... It's a #NFA.
and,
Must LIKE, SHARE, FOLLOW & COMMENT on it...

BITCOIN - Death Cross ComingAs per #Bitcoin Daily Chart Analysis...
Bitcoin, might be on track for its major "death cross" in 2023 into September next week.
Bitcoin's daily chart is set to print what is regarded as a "death cross," a bearish chart pattern, for the first time since January 2022. Notably, this would be the first occurrence of this type on the daily chart in 2023, with the weekly chart painting a death cross earlier this year in February 2023.
Bitcoin's daily moving MA 50 is set to cross beneath its moving average MA 200, which would yield the dreaded death cross pattern. It should be recalled that Bitcoin painted a golden cross on its daily chart in February of this year, preceding its rise to highs above $31,000 in April.
Bitcoin's death cross is expected to occur in the coming days but probably next week, and analysts are already paying keen attention to the impending crossover.
Death crosses, on the other hand, should not be considered an ultimate signal, as some experts refer to them as a lagging indicator. Furthermore, experience has shown that the Bitcoin death cross is unreliable as a solo signal.
Bitcoin extended its declines after the Securities and Exchange Commission delayed its decision on all spot Bitcoin exchange-traded fund (ETF) applications. Today, the leading cryptocurrency fell to lows of $25,528 last seen in mid-June of this year before slightly rebounding.
At posting time, CRYPTOCAP:BTC was marginally down 0.37% in the last 24 hours to $25,695.
Always #DYOR and Trade wisely by using of # Stoploss, It's #NFA
And,
Must Share, like, Comment on it...

Sell LAURUS LAB on riseLaurus lab has witnessed death cross after results when NIFTY atempting to reach 18000. At very strong support at 450 knocking to fall down. Short for 390 to 360 in coming months. Sl above 470 range on weekly closing basis.

SHORT TITAN: Educational analysis, Death CrossTitan will be going down by until 10-15 days, backed by a holy DEATH CROSS and analogy going from weeks.
Titan is a showing a lil bearish pattern looking at stock series data from around December 2022. This pattern has not been changed yet.
A visible death cross pattern appeared, as we can see. Stating that this downward trend can be there for a long time. Good News.
While on the recent opening of the fundamental data, revenue has increased wrt expectation but the earnings have not been increased but have decreased, hence we can see a huge spike on 3rd February 2023,
One more analogy is that, a period of around 13 days is required for the hill pattern to occur, first the stock will move up and get back at similar value position at around 13 days later.
Hence predicting that TITAN will go around 2347 on 05-04-2023.
Let's see.

Cautious View on Sanofi - Death CrossSanofi on Monthly chart is on verge on forming a death cross (20-50 EMA negative crossover)
Cautious on this stock to take entry until there is some confirmation on change in trend.
In case the death cross occurs in a month or two then the below support levels are marked.
Please note: The formation is not yet completed and if there is reversal well and good, else remain extremely cautious from entry,

DEATH CROSS IN IEXSHORT IEX 185-195 for 175/170 and 150 levels. Sl near 202 levels on closing basis. IEX has witnessed DEATH CROSS and necessary bounce done for fresh selling. Valuations are now coming to reasonable levels

☠DANGER☠ - Death Cross in Nifty !!!!Death cross is visible in nifty also nifty is facing resistance
at the falling trendline which is very negative.
Both RSI and MACD is negative i.e. again bearish.
Avoid fresh longs and short below 50D moving average
i.e. 17129.

Golden Cross and Death CrossIf the 50-day moving average crosses the 200-day moving average from down, it's a golden cross.
Else, it's a death cross.

Death Cross in CAMS stockStock- CAMS
Death Cross is observed in Daily Time Frame.
50MA has crossed 200MA from above
& now 200MA is acting as resistance,
It has formed like Double Bottom and rose up and gave breakout above the strong resistance and the resistance trend line but during reversal from bottom, no consecutive big bull candles are formed like the big red candles while going down, which shows Bulls are comparatively weak.
And the breakout candle is red candle and the volume is not good either of the current candle as well as the big bull candle near the breakout.
So i think more probability is breakout will fail and it will reverse downside.
Let me know your views in comments

BITCOIN BULL RALLY START FROM 16TH FEB 2022 ?Observed interesting pattern from last bull rally of BitCoin. Analysis of post Death Cross activity before the previous bull run and predicted the same for the next bull run. As per the Price downfall, BTC already covered the expected downfall of 9108 $. Presently expecting sideways movement before bull run. As per Date Measurement, 16th Feb 2022 is the estimated date of the next bull run.
Are you ready for the next bull run?
Start accumulating good crypto coins at the lower level.

Weekly Analysis of BTC-USD(22nd June)Bears continue to dominate the crypto markets as almost all the major crypto assets fell by more than 7% in the last week. BTC formed a weekly bearish candlestick pattern with ~ 9% decline, also, BTC witnessed is its 6th consecutive week of institutional outflows. However, it is still holding the $30-$31K support zone and at the time of writing, BTC is trading slightly above $32.5K.
BTC also witnessed a ‘Death Cross” on the Daily TF and when this happens in the last bull rally of 2018, BTC further dipped more than 25%. On the downside, the nearest support zone is placed at $30K-$31K, if it decisively closes above the $30K, a further downswing rally is most likely to continue till the next support at $28K, followed by the next significant support at $25K.
On the positive side, BTC is still holding its $30K support for the last 4 weeks, and also, it is making higher highs from the last three times. The immediate hurdle is present at $33.5K, once it breaks this level, the net potential resistance is at $36K, followed by the next level at $38.5K.
Weekly MACD is also entering into negative territory whereas Daily MACD is also giving a bearish crossover, both indicating bearish sentiments to prevail in the coming sessions. However, the breakdown below $30K will act as a confirmation for the further bearish movement.

BTC Bearish ContinuationBTC continues remain bearish...
Death cross almost done...
Important levels to watch now...
Short term-
Upside - 37K, 42K
Downside- If 35200 breaks, high chance of 32K
Long term-
Upside- If 42K breaks, BTC rally will start again
Downside- If 32K breaks on daily, high chance of 18K
Join channel for more update- t.me/rZeus_pro
Subscribe to youtube channel rZeus For Profit - www.youtube.com

Death crossover done, what next in Bitcoin?Technical analysis:
Welcome to this quick update everyone,
In Daily timeframe Chart, Death Cross Confirmed in 1D Chart ✅
So far Bitcoin is Moving Inside the 34-41k S/R Range..
RSI indicator is Making Lower Highs Since 8th Jan (Downtrend)
If Daily candle Closed Below the 34.5k Support, Bitcoin Might Retest the 31k Horizontal Support Area 📉
A close above EMA200 (41k) invalidate the Death Cross‼️
❤️ If you find this helpful and want more FREE forecasts in Tradingview.
. . . . . Please show your support back,
. . . . . . . . Hit the 👍 LIKE button,
. . . . . . . . . . Drop some feedback below in the comment!
❤️ Your Support is very much 🙏 appreciated!❤️
💎 Want me to help you become a better Crypto trader?
Now, It's your turn!
Be sure to leave a comment; let me know how you see this opportunity and forecast.
Trade well, ❤️
#bitcoin #crypto #nextmove #bullmarket #sideways #btcusdt #dailyclosed #deathcrossover

BTC Worst Case Scenario 2021 (Part II)Just a continuation of previous idea. (Link below)
Now that the death cross is confirmed (on MAs, namely 50 and 200 MAs), I believe the price action I'm guessing is on track. We'll see more downside soon (down to 20K-ish). That, of course, given there is no external influence (Elon's tweet for example).
When shows up, Death cross historically mirrors the pre-death cross price action (which is dropping.) So, we should expect it to go down another 48-50% ish.
Save your ammo for a really big discount on BTC.


BTC Halving and Price Fluctuation Just to give a visual guidance on the relation between BTC Halving and price action including any Golden/Death Crosses found therein.
Disclaimer: precision maybe a little bit off as I made this on my smartphone.)

risky betrisky buy
buy above 295.6 with stop 287
targets as per fibo levels in chart
disclaimer - trade @ own risk

SPCE From Golden Cross to Death Cross to Blackhole Who KnowsA Golden Cross appeared on 10/9/2021 with the following criteria:
1. Existing uptrend
2. Confirmation of GC on 11/18/2021
3. Continuation of an uptrend
This Bull run lasted until a Death Cross was spotted on 3/30/2021 with the following criteria:
1. There was an existing uptrend
2. DC occurs
3. Confirmation of existing downtrend
I conducted my analysis on a 4 hour time frame. With recent insider sell off it will take either spectacular earnings (which I do not see happening imo) or an actual test flight (not just another date and delayed flight) to get this security past the prior support level of $23.03.

track and short @ 163 if the script comes near rate 162-163 in this expiry
one can short it (next series)
disclaimer - trade @ own risk
note - sl and target will be update when and if the trade triggers
