Mazdock Long - Technical AnalysisMAZDOCK Technical Analysis Summary
Current Price : 2,985.00
Technical Reasons to Pick MAZDOCK
1 - Dow Theory Confirmation
- Higher Highs (HH) - Higher Lows (HL)
- Clear uptrend structure maintained
2 - EMA Support Structure - Took support from 100 EMA on a weekly Timeframe
- Trading above sorted EMA 100/200
- Strong momentum indication
- Bullish reversal from key moving average
4 - A clear Hidden RSI Divergence
- Indicates continuation of uptrend
- Target 1 : 3,240.00
- Target 2 : 3,502.30
- Target 3 : 3,774.00
- Grand Target : 4,094.00
Risk Management
Watch for sustained break below 100 EMA for trend reversal
Overall Bias : BULLISH
Strategy : Buy on dips near EMA support levels.
Defencestock

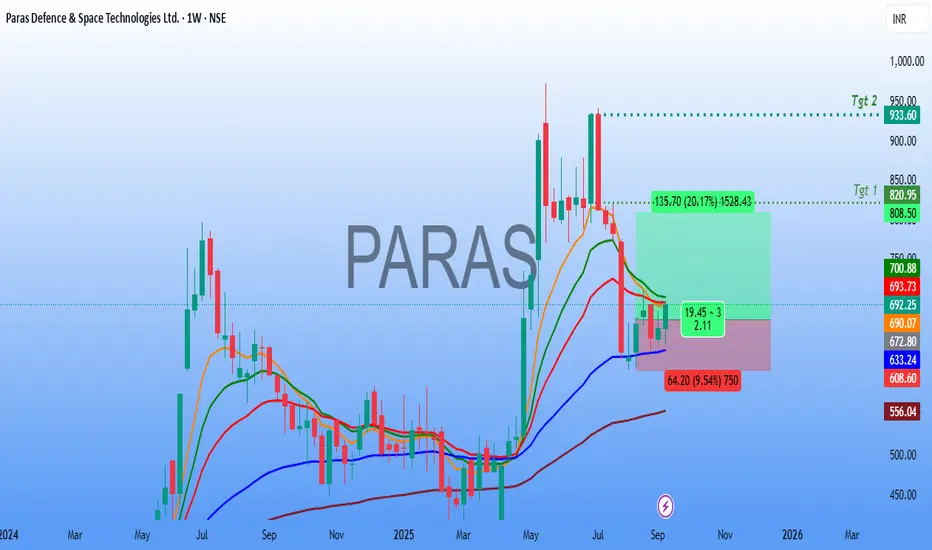
Paras Defence Technical Analysis🚀 Paras Defence & Space Technologies Ltd – Weekly Chart Analysis
The stock is showing signs of a potential reversal after consolidating near key support zones.
🔎 Technical Observations
Price Action:
After a prolonged decline from the highs, the stock has stabilized around the ₹640–660 support region. The recent weekly candle indicates buying interest, with bulls defending key support levels.
Sustained strength above the ₹700 zone can accelerate momentum towards higher levels.
Risk–Reward Setup:
The chart shows a favorable long setup with a potential upside of 20–35%.
📌 Trading Plan
Entry Zone: ₹680 – ₹700
Stop-Loss: ₹640 (weekly close basis)
Target 1: ₹820 – ₹825
Target 2: ₹930 – ₹950
⚠️ Key Notes
The ₹640–650 zone is acting as a strong support; holding this level is crucial for the bullish setup.
A breakout above ₹700 with volume confirmation will strengthen the momentum towards Target 1.
📢 Conclusion
Paras Defence is forming a bullish setup on the weekly timeframe with a good risk-to-reward ratio. If the stock sustains above ₹700, a strong move towards ₹820 and later ₹930+ looks possible. Traders should keep a strict stop-loss at ₹640 to protect capital.
BEL Stock Trade Above 50 EMABEL Stock show technically strength
If you want to plan a trade in BEL stock here, then we will take entry around 382. Here we will keep Stop loss 370 and the target is around 430 but what is this target, it will take some time. It will not come in 1, 2 or 7 days. What do we have to do in this, we will have to give a month's time. Okay. If you enter the trade, then you must do your analysis first.

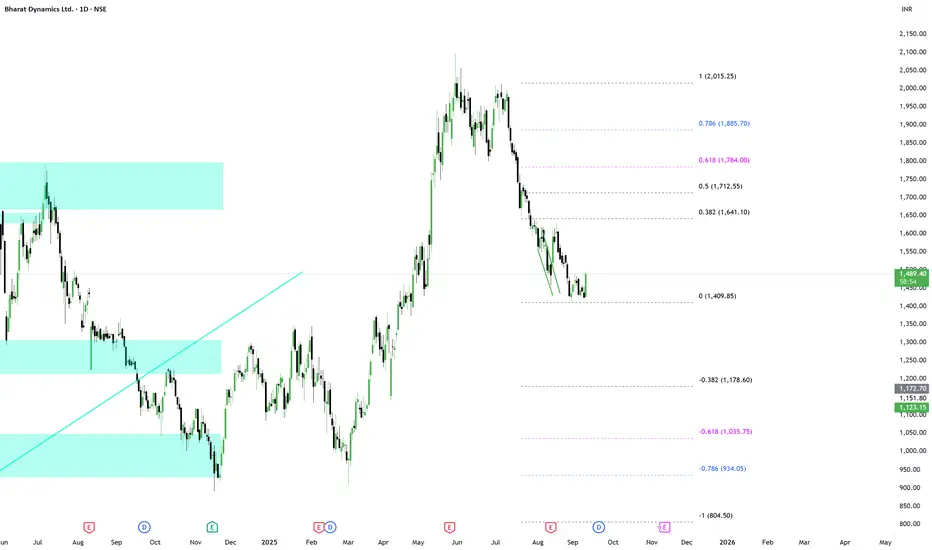
BDL: RSI BOBDL is in base formation and RSI gave a fresh Breakout today. Keep it in watchlist or enter with a small SL 1400 with some buffer.
Targets that we can see in 2-3 months: 1700-1800-1900-2000
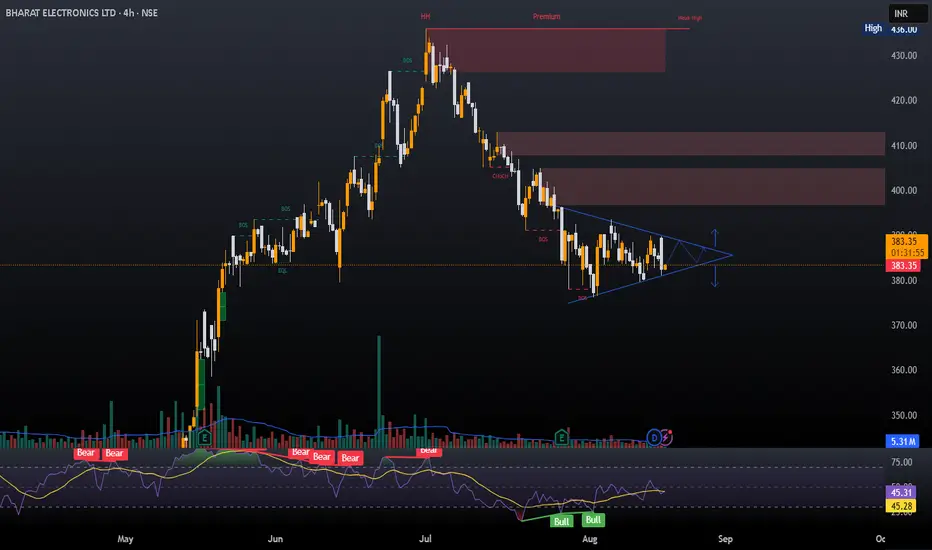
BEL Triangle PatternA long position can be taken in BEL if it breaks out this triangle pattern.
Entry- 383 - 381
Stop Loss- 377
Target- 390, 395, 400
Reason- After a good consolidation BEL has made a triangle pattern. A breakout from the pattern can give a good move.
Disclaimer- This is just for educational purpose. Please take advice before making any decision.
Jai Shree Ram.
Nifty - Sellers have applied their brakes! On Friday’s red candle, buyers actually beat sellers by 26 million in volume.
And exactly as expected, that showed up today – market gave the move.
If you understand price and volume analysis in NSE:NIFTY , you’ve already cracked 90% of the game. The rest is just how well you execute and manage your psychology. #LearningIsEarning
Now about today’s move –
Nifty again saw buyers ahead of sellers by 60 million volume.
But honestly, I’m a bit doubtful about this rally. It looks more like short covering from last week’s positions.
Many traders closed early because Friday is off for Independence Day – fewer days left for options traders this week.
My view remains – sell on rise.
Options data still suggests bounce till 24800 If Nifty crosses 24635 tomorrow, it can head to 24800 and even 25000 in the coming days. I’ll be watching that resistance closely.
Support from intraday perspective is around 24450.
NSE:BANKNIFTY can also follow through till 55575 in the next few days if it breaks 55650.
For sectors, keep NSE:CNXPSUBANK , NSE:CNXIT and NSE:NIFTY_IND_DEFENCE on the radar.
That’s all for today. Take care and have a profitable tomorrow.

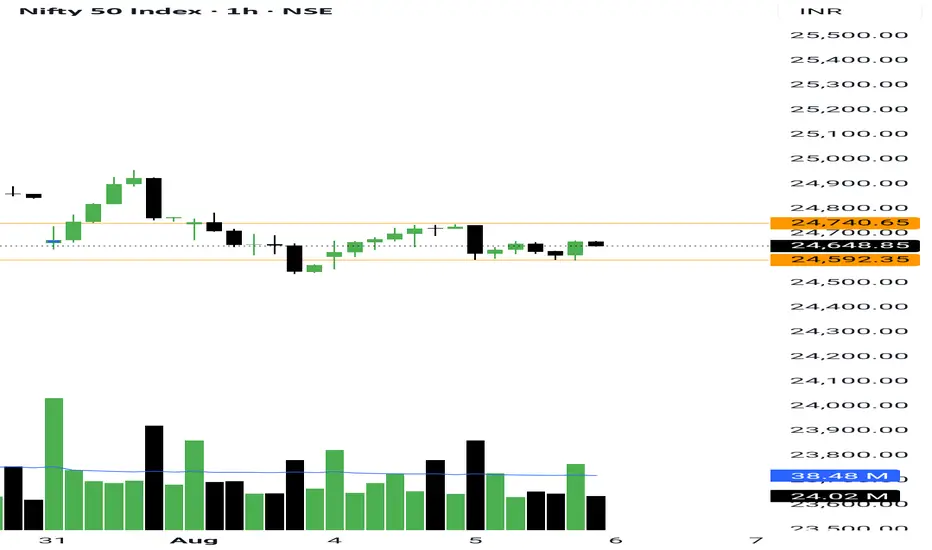
Nifty and Banknifty both giving good sign Yesterday, I spotted stopping volume in NSE:NIFTY — and that’s a good sign.
Nifty gave a strong bounce by the end of the day, which shows buyers stepping in.
Though sellers' volume is still high — above 50 million — the price action looks encouraging.
Today, Nifty’s Pivot is at 24,657
Pivot Percentile is just 0.03%, which means we can expect a trendy move again — either up or down, depending on where it breaks.
Intraday Support: 24,588
Intraday Resistance: 24,733
If the resistance breaks and Nifty holds above it, we might see a strong bounce today.
NSE:BANKNIFTY also looks bounce-ready on the intraday chart.
But only if the support at 55,095 holds well.
Can clearly see stopping volume on the 15-minute chart, which is a positive signal.
Sector Watch:
Yesterday, I saw good movement in NSE:NIFTY_IND_DEFENCE , NSE:CNXAUTO , and Fertilizer sectors. Keep an eye on them for short term trade opportunities.
Yesterday, I traded NSE:FORCEMOT and it gave a move of 4%+.
Still holding the position.
That’s all for today.
Stick to your setup, follow your plan.
Take care and have a profitable day ahead!
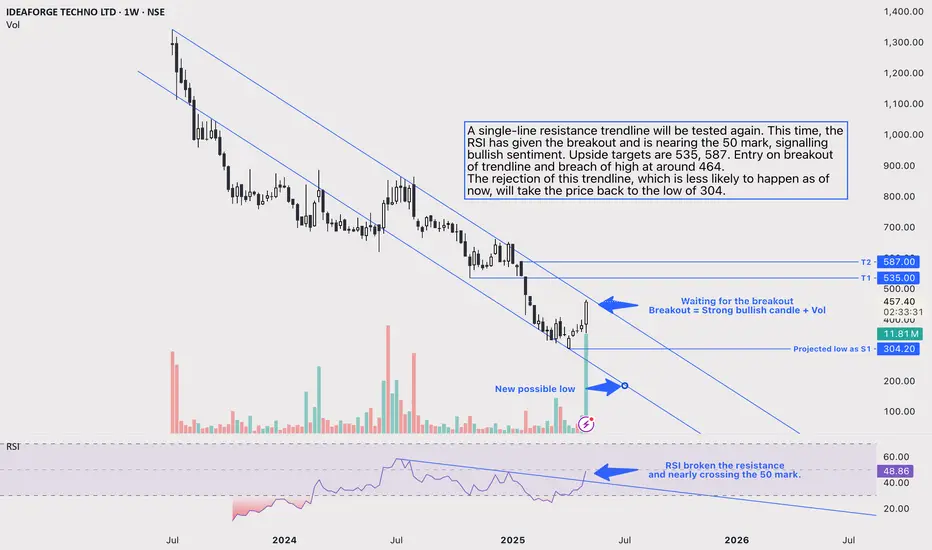
IDEAFORGE: Trendline breakout for bullish run.A single-line resistance trendline will be tested again. This time, the RSI has given the breakout and is nearing the 50 mark, signalling bullish sentiment. Upside targets are 535, 587. Entry on breakout of trendline and breach of high at around 464.
The rejection of this trendline, which is less likely to happen as of now, will take the price back to the low of 304.
Keeping the current geopolitical issues in mind, defence stocks are likely to be in demand.
View on DCX Systems#DCX Systems is in sideways trend but will be bullish in upcoming days for entry one can wait for the correction till 240-220.
has a orderbook of 2000Cr only of Defence, company has specialized in PCB's. added new clients from USA, Lockheed martin is one of them. Also a Beneficial of Make in India, Indian government is in process of biggest deal for Defence around 22,000Cr, This company can benefit from the deal.

ASTRA MICROWAVE Defence Stock | Price Near BreakoutExtra Microwave stock is trading near support and going into breakout range now, if it breakouts then good.
Elliot Wave also has ABC correction.
RSI Also Positive.
Price Traded near 50 EMA.
If the price breaks the resistance then we can think of entry. The entry will be on the breakout of the resistance candle and the stop loss will be below the Low of the breakout candle. The target will be the next resistance.

Look at Data Patterns stock Data Patterns Stock may gain momentum if it breakouts trendline.
Then our entry will be 2350 and our stop loss will be 2140 and target will be 3040.
RSI is around 50, Stochastic is positive cross over and MACD is also positive cross over.

Garden Reach Ship&Eng Stock Short Term BullishGRSE Stock Trade above 50 EMA
Stock has completed 4th wave. Now it is expected that the 5th wave will come. If the fifth wave comes then the target will be 2800.
Stop loss 1499 buy price above 50 EMA close.

Mazagon Dock Shipbuil Stock Bullish | Short TermMazagon Dock Shipbuil Stock Take Support
Price & Indicator Show Strength
Entry On Dips @ 4600
Trader Stop Loss 4333, Investor 4100
TG 4750/6150
If SL Hit Than Exit.
If you take entry then do your own analysis.

BEML LTD: Bulldozing Its Way to New Heights!BEML LTD: Bulldozing Its Way to New Heights!
Technical Analysis:
Trend: BEML is on a bullish rampage, charging upwards like a bull in a china shop... if the china shop were full of profit opportunities!
Breakout: The stock just smashed through resistance at 4,777.90, showing more strength than a bodybuilder at a protein shake convention.
Support: Previous resistance now acts as support. If BEML were a superhero, 4,777.90 would be its trusty sidekick, always there for backup.
Volume: Increasing volume confirms the uptrend. Traders are piling in faster than kids at an ice cream truck on a hot summer day!
Price Action: Strong bullish candles suggest momentum. BEML is painting the chart green like it's trying to win a St. Patrick's Day parade.
Fundamental Factors:
BEML, a defense equipment manufacturer, likely benefiting from increased government spending.
Infrastructure push in India could be fueling demand for BEML's construction equipment.
Risks:
Overbought conditions may lead to a pullback. Even rocket ships need to refuel sometimes!
Keep an eye on broader market sentiment and sector-specific news.
Trade Idea:
Consider long positions with a stop loss below the breakout level. Target the psychological 5,500 level.
Remember, folks, investing is like cooking - it's all fun and games until someone loses their dough. Always use proper risk management!
Disclaimer: This analysis is for educational purposes only. Do your own research before making investment decisions. And remember, the market has more mood swings than a teenager, so trade wisely!

Paras defence-IHNS pattern formationParas defence is a stock from defence manufacturing sector.
Stock has formed inverted head and shoulders pattern.
Risky traders can enter before breakout for better risk reward.
Stock will fly once the neckline is crossed. Decent stock for long term as defence sector is major beneficiary of India's Make in India program.

Paras, another stock want to dance, setting up well-Long base BO then
Elections results create volatility but
Setting up again:
-Recovered fast with volumes then red candle on low vol n bounced from 10 ema
-Defence stocks are making good setups
-Good shakeout of 21 ema
-tightness

IsroDefence and space active this stock lead
No recommendation for buy and sell
Stock have good fundamental and have potential to give returns like HAL
Company work for isro

Mazgaon Dock 1:4 Breakout Setup*Swing Trade *
Buy Mazagaon Dock Between 2000-2022
SL 1882 SL
Target 1: 2400 - 1:2 RR
Target 2: 2800 - 1:4 RR
SL is around Rs 200 so manage quantities as per your risk rewards

Paras Defence daily cmp 545Trendline breakout + rounding bottom + flag
Bullish above 554
Targets 564- 582 - 600-08 - 627- 652- 670++
SL 500

HINDUSTAN AERONAUTICS LTD (HAL)Two scenarios possible in the stock HAL , a possible downmove towards 2660-2670 levels which is a major support zones
Scenario 1 : A possible bottom formation at support zones of 2660-70 and stock can resume its uptrend and also towards 3000 levels
Scenario 2 : A breakdown of support zones 2660 levels will confirm a double top formation in the stock and can fall towards 2500-2350 levels

Mtar Technologies breakoutMtar Technologies gave a breakout with huge volume in the last 9 months. It can be a good buy if sustain above 1750.

Bharat ForgeBuy Bharat Forge @807 its moving towards multi year break out Tgt 950 + 1100 + SL 700
Duration 4 months.

