SUPREMEIND – STWP Equity Snapshot 📊 SUPREMEIND – Technical & Educational Snapshot
Ticker: NSE: SUPREMEIND
Sector: 🧪 Chemicals / Plastics
CMP: 3,500.80 ▲ (+4.15% | 22 Jan 2026)
Learning Rating: ⭐⭐⭐⭐☆ (Neutral–Range with Recovery Bias)
Chart Pattern Observed: 📊 Range Structure with Recovery from Demand
Candlestick Pattern Observed: Bullish Engulfing
📊 Technical Snapshot
SUPREMEIND is attempting a short-term stabilisation after a sharp corrective phase, with the latest daily candle showing a strong bullish response from lower demand zones. RSI is placed near 52.5, indicating neutral momentum with early signs of internal strength but no overbought pressure yet. Stochastic is around the mid-zone, suggesting recovery from oversold conditions rather than trend exhaustion. Bollinger Bands remain wide, reflecting elevated volatility and a market still adjusting after the decline, while price continues to trade below major supply zones — keeping the broader structure range-bound with recovery bias. MACD remains subdued, highlighting that momentum improvement is still developing rather than fully established. Price is currently interacting near the CPR band, which is relatively wide, typically associated with range-bound or two-sided price action. As long as price remains within or below the CPR zone, upside moves may face supply pressure, while sustained acceptance above the CPR pivot would be required to signal any meaningful directional shift.
📊 Volume Analysis
🔹 Current Volume: ~536K
🔹 Average Volume (20-period): ~252K ✅
💥 Volume is running at more than 2× the recent average, confirming active participation during the rebound from demand.
💡 Interpretation: Higher-than-average volume near support zones suggests genuine buying interest and supply absorption. However, for any sustained move toward upper range resistance, similar volume expansion will be required near higher levels to confirm acceptance.
🔑 Key Levels – Daily Timeframe
Support Areas: 3373 | 3258 | 3194
Resistance Areas: 3552 | 3616 | 3731
These are zones where price has paused or reacted earlier.
What’s Catching Our Eye: Sharp demand-led rebound with strong participation.
What to Watch For: Acceptance above CPR and nearby resistance.
Failure Zone: Loss of the recent demand base.
Risks to Watch: Overhead supply and wide CPR.
What to Expect Next: Range-bound move with recovery bias.
Bullish Case: Sustained Demand absorption may support recovery.
Bearish Case: Failure to hold Demand base risks deeper reversion.
Momentum Case: Strong Rebound momentum, needs follow-through.
STWP Equity Snapshot – SUPREMEIND
Intraday Setup:
Entry: 3,500.8
Invalidation level: 3,237.11
Reference 1: 3,817.23
Reference 2: 4,028.18
Swing Setup (Hybrid Model – 2–5 days):
Entry: 3,500.8
Invalidation level: 3,151.67
Reference 1: 4,199.06
Reference 2: 4,722.75
STWP View: Momentum: Strong | Trend: Range | Risk: High |Volume: High
Learning Note: Focus on structure, risk per trade and clean reviews – not prediction.
Disclaimer:
Educational view only. Not a Buy/Sell recommendation. Please consult a SEBI-registered advisor before making any decision. STWP is not responsible for trading decisions based on this post.
💬 Did this help you read the chart better?
🔼 Boost | ✍️ Comment | 🔁 Share with a learner
👉 Follow STWP for clean chart-reading insights
🚀 Stay Calm. Stay Clean. Trade With Patience.
Demandandsupplyzones

POLICYBZR - STWP Equity Snapshot📊 STWP Equity Snapshot – PB Fintech Ltd (POLICYBZR)
(Educational | Chart-Based Interpretation)
POLICYBZR continues to trade within a well-defined range structure, with repeated rejection from the 1960–2000 supply / distribution zone and consistent buyer activity emerging near the 1650–1609 demand / value zone. The stock has once again reverted from upper supply and is currently attempting a recovery from this demand region. The area around 1720–1740 now acts as a near-term balance zone. Holding above this region keeps the recovery attempt structurally valid and allows price to test higher reaction zones near 1755 and 1790, where selling pressure has appeared previously. However, sustained acceptance above these levels would be required to improve directional confidence. On the downside, continued weakness below 1650, and especially below 1609, would signal structural weakness and increase the probability of deeper mean reversion within the range. Until either boundary is resolved, price action should be viewed as rotation rather than trend development.
Recent market conditions reflect a neutral but stabilising environment. The recent strong bullish candle highlights buyer response from demand, but not trend confirmation. Bollinger Band behaviour shows that price is emerging from a compressed phase, with early expansion attempts visible, though follow-through remains limited. The BB squeeze context indicates potential for movement, but direction remains undecided. RSI near 45–46 reflects balanced momentum, consistent with a range-bound market rather than a trending phase. Price interaction with short-term averages suggests short-term stabilisation, while the wide CPR structure reinforces expectations of two-sided activity, consolidation, and rotational price behaviour instead of immediate directional continuation.
Volume analysis adds important context to the recovery attempt. Participation has improved during the recent bounce from demand, indicating active buyer involvement rather than a low-liquidity reaction. At the same time, volume intensity remains moderate (Vol X near 1.0), with no signs of climax or exhaustion. Selling phases have not been accompanied by aggressive volume expansion, suggesting controlled supply rather than panic distribution. Overall, volume behaviour supports range stability and validates the demand-side response, while still falling short of confirming accumulation or breakout intent.
From a short swing perspective, POLICYBZR remains structurally neutral as long as price trades between the 1650–1609 demand zone and the 1960–2000 supply zone. Acceptance above intermediate resistance would be required to shift bias toward higher range expansion. Conversely, sustained acceptance below 1609 would elevate downside risk and suggest continuation of mean reversion toward lower structural levels. Until such confirmation occurs, consolidation and rotational movement within the range should be expected.
Final Outlook (Condition-Based):
Momentum is improving but not decisive, the trend remains range-bound, risk is elevated due to overhead supply, and volume is supportive but non-confirmatory.
💡 STWP Learning Note
In range markets, demand reactions show interest — only acceptance above supply confirms intent.
⚠️ Disclaimer
This post is shared strictly for educational and informational purposes. It is not investment advice or a recommendation. Please consult a SEBI-registered financial advisor before making any financial decision.
🚀 Stay Calm. Stay Clean. Trade With Patience.

ASTRAL - STWP Equity Snapshot📊 STWP Equity Snapshot – Astral Ltd (ASTRAL)
(Educational | Chart-Based Interpretation)
ASTRAL continues to trade within a broader range-bound structure, with price oscillating between well-defined supply and demand zones rather than establishing a sustained trend. After facing rejection near the 1593–1600 supply zone, price moved into a corrective phase and recently reacted from the 1333–1293 demand region, where buyers have previously stepped in. The current price is stabilising near the 1424 balance area, which now acts as an important near-term reference. Holding above this zone keeps the structure intact and allows price to retest higher reaction zones near 1441–1470, where selling pressure has emerged earlier. On the downside, sustained weakness below 1367, and more importantly below the 1333 demand zone, would increase downside risk and reinforce the broader range structure. Until price decisively exits either boundary, movement should be viewed as rotation within the range rather than trend development.
Indicator readings reflect a mixed but stabilising environment. The recent strong bullish candle with open near the low signals short-term buyer response from demand rather than trend confirmation. Bollinger Band behaviour highlights prior volatility contraction, with early signs of expansion emerging, though follow-through remains limited. The BB squeeze context suggests the market is transitioning from compression toward potential movement, but direction is still undecided. RSI near 47 indicates balanced momentum, neither weak nor strong, aligning with the ongoing range structure. Price interaction with short-term averages shows attempts at stabilisation, while a wide CPR structure reinforces the expectation of two-sided trade and consolidation rather than immediate directional continuation.
Volume behaviour provides constructive but cautious confirmation. Participation has expanded during the recent rebound, indicating active involvement from buyers near demand rather than a low-volume reaction. At the same time, volume intensity remains within a healthy range (Vol X ~1.4–1.5), with no signs of climax or exhaustion. Selling phases have not shown aggressive volume expansion, suggesting supply pressure is controlled. Overall, volume dynamics support range stability and recovery attempts but stop short of confirming accumulation or breakout intent.
From a short swing perspective, ASTRAL remains structurally neutral as long as price trades between the 1333–1293 demand zone and the 1593–1600 supply zone. Acceptance above intermediate resistance levels would be required to improve directional confidence toward higher range-expansion zones. Conversely, sustained acceptance below 1293 would elevate downside risk and shift focus toward deeper structural demand. Until either boundary is resolved, consolidation and rotation within the range should be expected.
Final Outlook (Condition-Based):
Momentum is improving but not decisive, the trend remains range-bound, risk stays elevated due to proximity to both demand and supply, and volume is supportive but not confirming a directional shift.
💡 STWP Learning Note
Range markets reward patience and structure awareness more than prediction.
⚠️ Disclaimer
This post is shared strictly for educational and informational purposes. It is not investment advice or a recommendation. Please consult a SEBI-registered financial advisor before making any financial decision.
🚀 Stay Calm. Stay Clean. Trade With Patience.

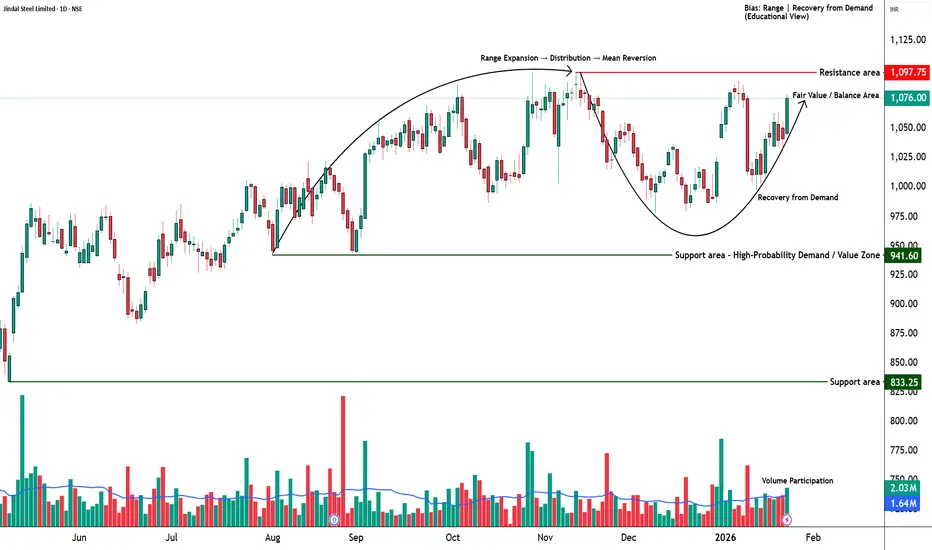
JINDALSTEL - STWP Equity Snapshot📊 STWP Equity Snapshot – Jindal Steel Ltd (JINDALSTEL)
(Educational | Chart-Based Interpretation)
JINDALSTEL is trading within a broader upward structure while navigating a short-term recovery from a recent corrective phase. Price has rebounded strongly from the 1031–1019 demand zone, an area that has historically attracted buyers and acted as structural support. The current price is stabilising near the 1079 balance area, which now serves as a key near-term reference for structure. Holding above this zone keeps the short-term structure constructive and allows price to test higher reaction zones near 1089–1101, where prior supply has emerged. Acceptance above these zones would be required to improve directional confidence. On the downside, any sustained weakness below 1053 initially, and more importantly below 1031, would increase downside risk toward deeper demand and signal a return to range-bound or corrective behaviour. As long as price remains above the primary demand zone, the broader uptrend framework remains intact.
Indicator readings from the green dashboard support a developing bullish structure but with conditions. The presence of a strong bullish candle reflects renewed buyer initiative after consolidation, while Bollinger Band behaviour highlights a prior compression phase now transitioning into early expansion. The BB squeeze context increases the relevance of the current move, suggesting improving volatility conditions rather than a late-stage rally. RSI near 60 indicates strengthening internal momentum without entering stretched or overbought territory, supporting continuation potential while keeping exhaustion risk contained. Price holding above short-term trend measures and VWAP reinforces near-term stability. However, interaction with a wide projected CPR structure suggests that the market environment still favours balance and consolidation, meaning follow-through and acceptance matter more than single-session strength.
Volume behaviour adds an important layer of confirmation. Participation has expanded during bullish candles, indicating active buyer involvement rather than a low-liquidity bounce. Volume intensity remains around healthy levels (Vol X ~1.3), showing interest without signs of climax or emotional excess. Recent pullbacks have not been accompanied by aggressive selling volume, suggesting that supply is being absorbed rather than distributed. Overall, volume dynamics support a controlled recovery and align with accumulation-type behaviour rather than exhaustion.
From a short swing perspective, JINDALSTEL maintains a constructive bias as long as price holds above the 1031–1019 demand zone. If acceptance improves above nearby supply, higher range-expansion reference zones around 1192–1278 come into focus over the coming sessions. Conversely, sustained acceptance below 1019 would elevate downside risk and indicate a shift from recovery into a deeper corrective or range phase. Until such a failure occurs, consolidation above demand should be viewed as structural digestion rather than weakness.
Final Outlook (Condition-Based):
Momentum is strong and improving, the broader trend remains upward, risk stays elevated due to nearby supply and a wide CPR environment, and volume remains supportive but requires continued follow-through.
💡 STWP Learning Note
Strong candles initiate moves; structure and acceptance decide sustainability.
⚠️ Disclaimer
This post is shared strictly for educational and informational purposes. It is not investment advice or a recommendation. Please consult a SEBI-registered financial advisor before making any financial decision.
🚀 Stay Calm. Stay Clean. Trade With Patience.
COLPAL - STWP Equity Snapshot📊 STWP Equity Snapshot – Colgate-Palmolive (India) Ltd (COLPAL)
(Educational | Chart-Based Interpretation)
COLPAL has transitioned from a corrective phase into a demand-led recovery, with price reacting decisively from the 2097–2074 demand zone. This zone has historically attracted buyers, and the recent rebound reflects active absorption of selling pressure rather than a passive bounce. Price is now stabilising around the 2184 balance area, which acts as an important near-term reference. Sustained holding above this zone keeps the short-term structure stable and allows price to test higher reaction zones between 2288 and 2358, where acceptance will determine continuation quality. On the downside, any weakness below 2184 increases risk toward 2138 initially, followed by a deeper retest of the 2097–2074 primary demand zone, where the broader structure would be reassessed. As long as price remains above this demand band, the larger trend framework stays constructive.
Indicator readings from the dashboard support this developing structure. The presence of a strong bullish candle emerging after a period of consolidation indicates renewed buyer initiative. Bollinger Band behaviour shows prior volatility compression, with early signs of expansion now appearing, suggesting a shift from balance toward directional intent rather than a late-stage move. The BB squeeze context increases the relevance of the current expansion attempt, while RSI near the bullish mid-zone (~60) reflects improving internal strength without signs of exhaustion. Price holding above short-term trend measures reinforces near-term stability. At the same time, interaction with a wide CPR structure suggests that the market remains in a balanced environment, where consolidation, pauses, or controlled pullbacks toward value zones are more likely than immediate acceleration. Acceptance and follow-through remain more important than candle size alone.
Volume behaviour adds important confirmation to the price structure. Participation has expanded during bullish candles, indicating genuine buyer involvement rather than a low-liquidity reaction. Volume intensity remains within a healthy range, with no signs of climax or exhaustion typically associated with late-stage moves. Pullbacks have occurred on relatively lighter volume, suggesting that selling pressure is being absorbed rather than aggressively expanding. Overall, volume dynamics align with a controlled recovery and support the view that the move is being built through participation rather than emotion.
From a short swing perspective, COLPAL maintains a positive structural bias as long as price holds above the 2097–2074 demand zone. If acceptance improves and momentum sustains, higher range-expansion reference zones between 2388 and 2541 come into focus over the coming sessions. Conversely, sustained acceptance below 2074 would elevate downside risk and indicate a transition from recovery into a deeper corrective phase. Until such failure occurs, consolidation above demand should be viewed as healthy digestion of gains rather than structural weakness.
Final Outlook (Condition-Based):
Momentum is moderate and improving, the broader trend remains upward, risk stays elevated due to the recovery nature of the move and nearby supply, and volume remains supportive but requires continued follow-through.
💡 STWP Learning Note
Strong recovery candles show intent — confirmation comes only with acceptance above supply.
⚠️ Disclaimer
This post is shared strictly for educational and informational purposes. It is not investment advice or a recommendation. Please consult a SEBI-registered financial advisor before making any financial decision.
🚀 Stay Calm. Stay Clean. Trade With Patience.

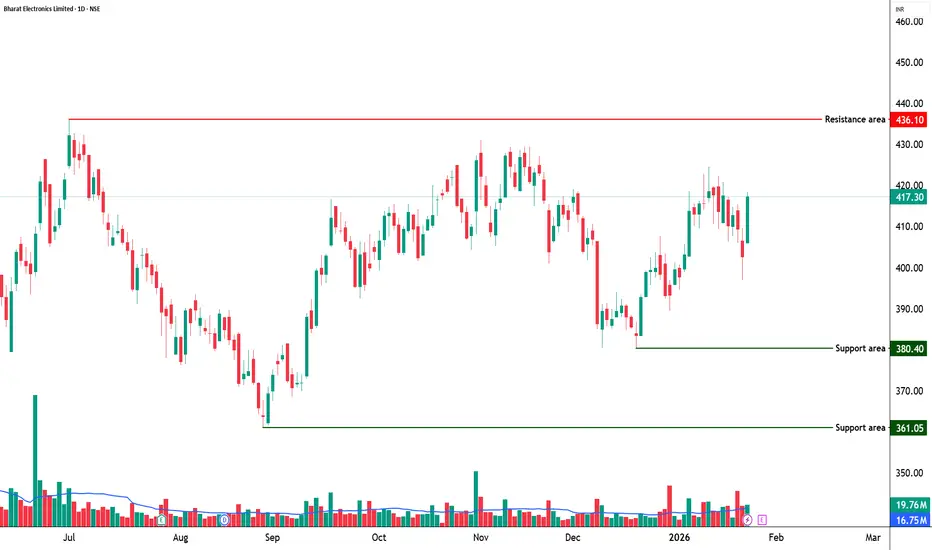
BEL - STWP Equity Snapshot📊 STWP Equity Snapshot – Bharat Electronics Ltd (BEL)
(Educational | Chart-Based Interpretation)
Market Structure
BEL continues to trade in a structurally strong uptrend, characterized by higher highs and higher lows on the daily timeframe. Recent price action reflects consolidation after a sharp upward expansion, suggesting digestion of gains rather than distribution. The broader structure remains constructive, with price holding above key support zones and maintaining bullish alignment.
Demand–Supply Structure
Price has respected a well-defined demand zone in the 402–397 region, where buyers have consistently defended declines. The recent bullish reaction from this area indicates demand absorption and willingness to support price at higher value levels. Overhead supply is visible near recent highs, but selling pressure appears controlled, indicating healthy supply management rather than aggressive profit booking.
Key Levels – Daily Timeframe
Primary demand zones are placed near 409, followed by deeper structural support around 402–397. These zones represent areas where buyers have previously stepped in with conviction. On the upside, resistance and reaction zones are located near 421, 426, and 434, which may act as pause or acceptance areas during further upside attempts.
What the Chart is Saying
Momentum remains supportive, with RSI holding near 57–58, reflecting healthy strength without signs of exhaustion. Price continues to trade above key moving averages, reinforcing trend integrity. Volume participation remains above average during bullish candles, suggesting continuation interest rather than speculative activity.
CPR Impact
BEL is trading above the CPR pivot with a relatively narrow CPR structure, which generally supports directional continuation rather than range-bound behavior. Acceptance above the CPR zone indicates short-term bullish control. However, the projected CPR ahead appears wider, hinting at the possibility of brief consolidation before the next directional phase.
Additional Structure Observations
Recent pullbacks have been shallow and followed by strong recovery attempts, indicating dip-buying behavior. Short-term moving averages remain positively aligned, while the longer-term structure continues to slope upward. The absence of heavy selling volume during declines suggests effective absorption of supply. Overall, the structure supports continuation, subject to normal consolidation and acceptance checks.
Intraday Reference Levels (Structure-Based)
The 418 zone acts as the near-term balance area and remains the key intraday reference. Sustained holding above 418 keeps the structure stable and supports upside testing toward the 436–449 zone, which represents upside reaction areas where price may pause or require acceptance. On the downside, weakness below 418 increases risk toward the 402–397 demand zone, where intraday structure would be reassessed. These levels define intraday risk versus opportunity, not directional certainty.
Swing Reference Levels (Hybrid Model | 2–5 Days)
From a short-term swing perspective, BEL remains within a positive structural framework as long as price holds above the 402–397 primary demand zone. If strength sustains, the 449–473 zone emerges as a higher range-expansion reference area over the coming sessions. Conversely, sustained acceptance below 397 would elevate downside risk and indicate a shift from consolidation toward deeper corrective behavior. Until such failure occurs, consolidation above demand should be viewed as constructive.
Final Outlook (Condition-Based)
Momentum remains strong and supportive of the prevailing structure. The trend is clearly up, with buyers maintaining control above key demand zones. Risk remains elevated due to proximity to resistance and recent price expansion, while volume stays moderate and healthy, supporting continuation rather than exhaustion.
💡 STWP Learning Note
Strong trends often pause through consolidation, not reversal.
Respect structure and let price confirm continuation.
📘 STWP Approach
Observe price. Respect risk.
Trade structure, not prediction.
⚠️ Disclaimer
This post is shared strictly for educational and informational purposes.
It is not investment advice or a recommendation.
Please consult a SEBI-registered financial advisor before making any financial decision.
🚀 Stay Calm. Stay Clean. Trade With Patience.
DIVISLAB - Range-to-Breakout Attempt from Demand💹 Divi’s Laboratories Ltd (NSE: DIVISLAB)
Sector: Pharmaceuticals | CMP: 6642.5
View: Range-to-Breakout Attempt from Demand | Momentum Rebuild in Progress
Chart Pattern: Accumulation
Candlestick Pattern: Strong Bullish Marubozu | Bullish Engulfing
Price Action:
DIVISLAB has transitioned into a well-defined accumulation phase following a prolonged corrective decline. After forming a structural base near the 6200–6300 region, price action shows repeated demand absorption, indicating that selling pressure has been largely exhausted at lower levels. The recent session printed a decisive bullish expansion candle from within the range, signalling a shift in control back toward buyers. This move marks an early breakout attempt from consolidation, with price reclaiming the mid-range and pressing toward the descending supply line. While the broader structure is still evolving, the latest price behaviour reflects a clear change in character from compression to directional intent.
Technical Analysis (Chart Readings):
The chart reflects improving technical alignment following a prolonged consolidation. Price has delivered a strong bullish Marubozu / engulfing candle, highlighting decisive buyer dominance and minimal intraday supply. This expansion follows a visible Bollinger Band squeeze, pointing to a volatility release after compression. Short-term trend alignment is improving, with EMA 9–20 crossover visible and price stabilising above key short-term averages, while the broader trend remains in recovery mode. Momentum indicators support this transition, with RSI around 63 signalling strength without immediate exhaustion, MACD showing a positive crossover with expanding histogram, and ROC confirming positive rate-of-change momentum. Volume participation has expanded above recent averages, indicating that the move is supported by participation rather than a low-liquidity spike. Overall, the technical state suggests a momentum rebuild phase emerging from accumulation.
Key Levels (Chart Readings):
The chart highlights a clear demand–supply framework guiding near-term price behaviour. On the downside, a strong structural support zone is visible in the 6200–6000 region, which has acted as a base for accumulation and repeatedly absorbed selling pressure. Intermediate support levels around 6470, 6298, and 6203 further reinforce this demand structure. On the upside, overhead supply is visible near the 6700–7000 band, where prior price reactions indicate selling interest and distribution. Intermediate resistance levels around 6737, 6832, and 7004 mark zones where acceptance will be required for sustained upside continuation. The recent push from demand toward resistance reflects a range-to-expansion attempt, with price currently navigating a transition zone rather than an open trend environment.
Demand & Supply Zones (Chart Readings):
The chart outlines clearly defined demand and supply zones shaping short-term structure. On the Daily timeframe, a major demand zone is clearly established in the 6447-6345 region, where price previously(recently) formed a strong base followed by an impulsive upside move, highlighting long-term demand absorption and accumulation by higher-timeframe participants. This daily demand zone provides the broader structural floor for the current price action.
A swing demand zone is visible near the 6381–6345 region, which has acted as a base for higher-low formation and sustained buying interest. Within this, intraday demand zones around 6510–6481 highlight immediate support areas where buyers have been active during pullbacks. On the upside, supply zones remain clustered near the 7280–7330 region on higher timeframes, while nearer-term resistance is visible around the recent swing highs. Collectively, these zones frame the current environment, with price attempting to rotate upward from demand into overhead supply, making follow-through and acceptance key variables to monitor.
STWP Trade Analysis:
DIVISLAB has triggered a bullish expansion from an accumulation base, supported by improving momentum and expanding volume. From an intraday perspective, price holding above the 6660 zone keeps the bullish bias intact, with scope for continuation toward the upper resistance bands as long as demand remains defended. From a short-term swing standpoint, the same zone supports a broader mean-expansion framework over the next few sessions, provided price continues to build above reclaimed levels without slipping back into compression. The STWP view remains constructively bullish, with trend bias turning upward, RSI reflecting healthy strength, and volume behaviour confirming participation. Risk, however, remains elevated due to the proximity of overhead supply, making disciplined position sizing and structure-based risk management essential.
Final Outlook:
Momentum: Strong
Trend: Up
Risk: High
Volume: Moderate
The structure favours a continuation attempt as long as price sustains above demand zones, but confirmation through acceptance above resistance is required for trend acceleration. Traders should prioritise structure, risk control, and follow-through over prediction during this transition phase.
⚠️ STWP Educational & Legal Disclaimer
This content is shared strictly for educational and informational purposes only. All discussions, illustrations, charts, price zones, and options structures are meant to explain market behaviour and do not constitute any buy, sell, or hold recommendation. STWP does not provide investment advice, trading calls, tips, or personalized financial guidance, and is not a SEBI-registered intermediary or research analyst.
The analysis is based on publicly available market data and observed price–derivatives behaviour, which is dynamic in nature and may change without notice. Financial markets involve inherent risk, and derivatives carry elevated risk, including the potential for significant capital loss. Factors such as option premiums, implied volatility, open interest, delta, and other Greeks can shift rapidly and unpredictably.
All trading and investment decisions, including position sizing and risk management, are solely the responsibility of the reader. Always consult a SEBI-registered investment advisor before taking any financial action. STWP, its associates, or affiliates shall not be liable for any direct or indirect loss arising from the use of this material. Past patterns, structures, or historical behaviour must never be treated as guarantees of future outcomes.
Position Status: No active position in this instrument at the time of analysis
Data Source: TradingView & NSE India
💬 Did this add value?
🔼 Boost to support structured learning
✍️ Share your views or questions in the comments
🔁 Forward to traders who value disciplined analysis
👉 Follow for clean, probability-driven STWP insights
🚀 Stay Calm. Stay Clean. Trade With Patience.
Trade Smart | Learn Zones | Be Self-Reliant 📊

Gold Futures | Bullish Reversal Setup from Demand ZoneThis chart shows a bullish setup on Gold Futures (GC1!) based on a pullback into a 2-Hour + 125-Minute Demand Zone confluence due to FII's pending orders.
I’m expecting the price to retrace back into the marked demand area before continuing higher toward the upside targets.
Plan
• Entry: Inside the 2H & 125m Demand Zone
• Stop Loss: Just below the zone
• Target 1: 4,401
• Target 2: 4,438

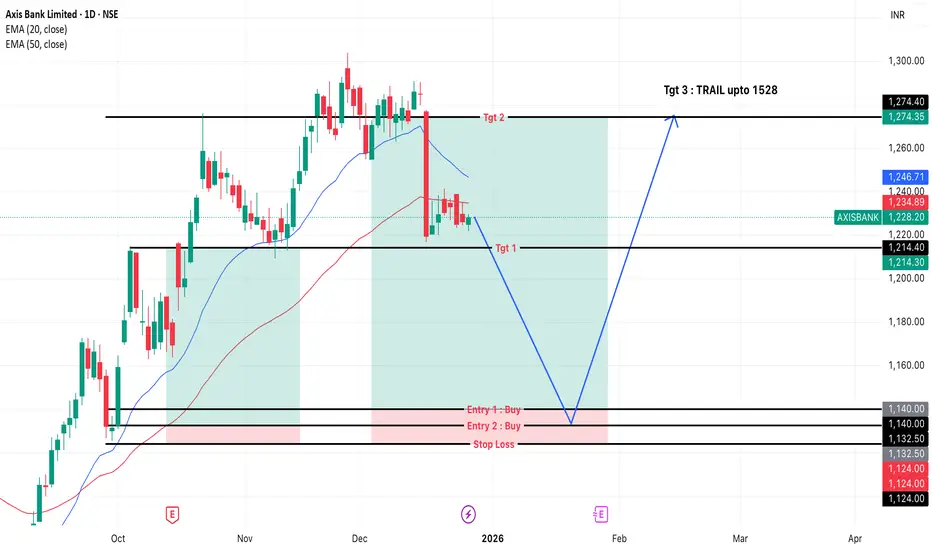
Axis Bank — Positional Long Setup | Plan the Pullback🟢 Long Plan – Buy the Dip Zone
🛒 Entry Zones
Entry 1: around ₹1140
Entry 2: around ₹1132–₹1124 (deeper fill zone)
⛔ Stop Loss
Below ₹1124 (decisive breakdown = setup invalid)
🎯 Upside Targets
Target 1: Previous support retest near ₹1214
Target 2: Resistance retest around ₹1274
Target 3: Trail the position toward ₹1528 if momentum continues
I prefer partial booking + trailing SL as price moves higher.
Trade Logic: A positive Trend & Pulse on daily and weekly time frames + A strong Demand Zone with FII's Pending Orders.
BAJAJ AUTO LONG SETUPLogic: BAJAJ AUTO is creating an up flag pattern on the weekly, followed by uptrend on the Daily.
The marked demand is strong setup.
Inspite of the fact that a stronger zone exist below that zone, but with understanding that if prices retrace into the below level the strength might be lost for an upmove.
The zone also is near 21 DEMA level.
Hence considering that and keeping strict SL below the marked level of atleast 10%DATR, long opportunities can be seen.

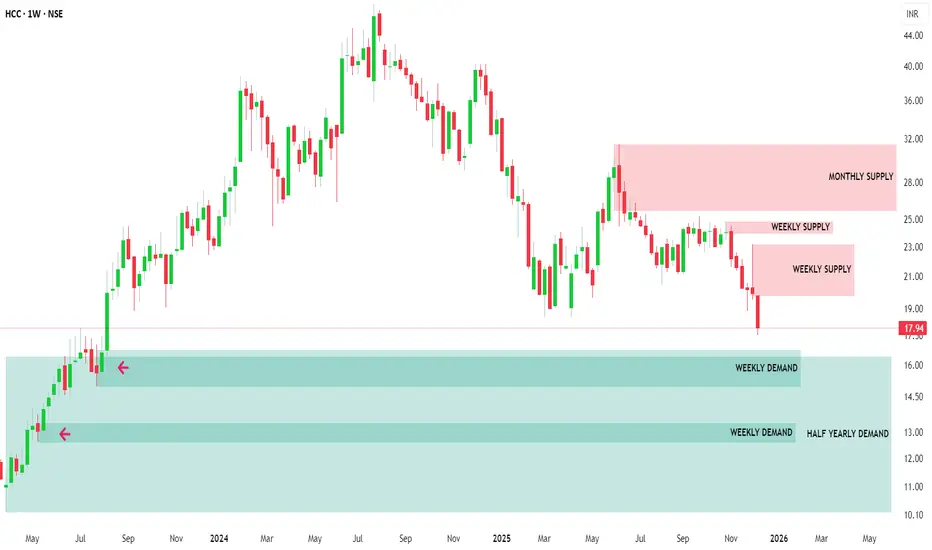
MTF Demand Confluence: High-RR Reversal SetupMulti Timeframe Supply & Demand Analysis
🕰️Yearly Timeframe
On the Yearly timeframe, price has already broken above a major supply zone, signaling strong higher‑timeframe bullish intent and possible long‑term accumulation by institutional players. Just above this breakout, price tapped into a previously tested yearly supply zone, from where it faced rejection and started to rotate lower, confirming active overhead supply.
This structure shows a classic “Break–into–higher supply” reaction, where long‑timeframe trend strength is present, but price is temporarily capped by remaining sell orders in the upper zone. A clean, sustained break above this upper yearly supply could unlock a fresh leg of long‑term upside.
📆 Half-Yearly Timeframe
On the Half-Yearly timeframe, price is currently approaching a strong demand zone — a critical level where significant buying pressure was previously observed. This prior bullish activity proved powerful enough to break through a previous Half-Yearly supply zone, clearly signaling the presence of institutional demand or major accumulation at this area. 💪
This HYTF demand confluence adds further conviction to the overall bullish structure, as it validates sustained buyer interest capable of overcoming historical supply barriers.
📉 Monthly Timeframe
On the Monthly Timeframe, price first reacted downward from a Monthly Demand Zone (MDZ) that coincided with a Half‑Yearly Supply Zone (HYSZ), creating a strong confluence area where sellers stepped in aggressively. As price moved away, the nearest Supply Zone (SZ) was respected again, extending the selling leg and confirming short‑term bearish order‑flow.
Currently, price is approaching Monthly Demand Zone that overlaps with a Half‑Yearly Demand Zone (HYDZ), forming a powerful HTF demand confluence with high probability of bullish reversal. If buyers manage to defend this HYDZ–MDZ cluster, it can act as a strong platform for a new upside swing.
If selling pressure remains elevated and this primary MDZ fails, there is one more MDZ sitting near the bottom of the structure, which can serve as a secondary demand pocket where price may still reverse to the upside. Both these stacked demand zones offer attractive areas to watch for confirmation‑based long setups.
Weekly Timeframe Focus (Reversal Zones)
On the Weekly timeframe, there are four clearly defined reversal zones where price has a high probability of reacting due to visible supply‑demand imbalances and prior impulsive moves. These levels align well with the higher‑timeframe zones, making them high‑quality decision points.
Monitoring these four zones for clean price action signals such as strong rejection wicks, engulfing candles, or structure breaks can help time entries with precision while keeping risk tightly controlled. This multi‑timeframe stacking significantly increases the reliability of any confirmed reversal from these areas.
Conclusion: Long‑Term Investment View
Given the strong confluence of demand zones across Yearly, Half-Yearly, and lower timeframes, plus multiple well‑defined reversal levels on the Weekly chart, this stock is positioned for a potentially strong bullish reversal from current or slightly lower zones. Notably, after the reaction from this higher timeframe demand zone, there are no significant supply hurdles visible on higher timeframes, clearing the path for sustained upside momentum and substantially increasing the chances of higher returns.
From a long‑term investment perspective, the structure suggests a favorable reward‑to‑risk profile and scope for strong performance if price holds above the mapped HTF demand. If demand is confirmed and price starts building a higher‑low structure from these zones, this can evolve into a high‑conviction long‑term swing or investment candidate, supported by institutional‑grade demand footprints and multi‑timeframe alignment.
UltraTech Cement: Bullish Setup at Major Demand ConfluenceWe are analyzing UltraTech Cement across multiple timeframes as it approaches a high-probability reversal area. Here is the breakdown:
1️⃣ Quarterly Timeframe (Location)
Status: Price is currently approaching a Quarterly Demand Zone.
View: We are treating this as a key "Location" for our trade setup. Since the price is correcting from its Lifetime High , this zone is significant enough to absorb incoming selling pressure and hold the price.
2️⃣ Monthly Timeframe (Trend Origin)
Status: Price is testing the Monthly Demand Zone.
Confluence: This zone perfectly coincides (overlaps) with the Quarterly Demand Zone.
Significance: This acts as a strong support because the massive rally that led to the previous Lifetime High originated right from this level.
3️⃣ Weekly Timeframe (The Setup)
Status: Price is approaching a refined Weekly Demand Zone.
Strength: This is a high-probability zone because it has triple confluence: it coincides with both the Monthly and Quarterly zones.
Support: There is also a Monthly EMA resting in this area, adding extra strength to the zone.
Outlook: If price enters this zone, we expect a strong upmove. There are no major higher-timeframe supply zones overhead to block the momentum.
🛡️ Plan B: The Safety Net
Secondary Zone: In the unlikely event that our primary weekly zone breaks, we are not out of the fight.
Fresh & Untested: Just below the current level, there is another fresh demand zone that has never been tested before.
Opportunity: Because it is "fresh," there are likely unfilled pending buy orders sitting there, ready to trigger a strong reaction and push prices back up.
🎯 Verdict: A solid long setup forming at a high-value location with momentum expected to resume toward highs.

Nifty 50: Short to 25,730 or Bounce at 25,650?📉 Market Breakdown
Nifty 50 has shown clear rejection from above resistance and the gap zone. On the 15-min timeframe, price broke structure to the downside, signalling potential continuation.
🎯 Key Levels to Watch
🔻 Possible move towards the gap below around 25,730
🛑 Key support zone sits near 25,650
🔄 Price may find demand here and attempt a reversal
👉 Let’s watch how price action unfolds around these levels. A rejection at support could set up a bounce, while a breakdown may open further downside.
Sharing my personal market view — not financial advice.

CERA – Demand Zone Confluence Supporting Bullish OutlookCERA has exhibited a notable price reaction from its Quarterly Demand Zone 📊, where price absorbed existing buy orders and initiated an upward movement 🚀. This reaction area coincides with the Yearly Demand Zone 🧭, thereby forming a strong confluence zone 🔗 that reinforces its structural significance.
On the Monthly timeframe 📅 , the active Demand Zone overlaps both the Monthly and Yearly Demand Zones . Such multi‑timeframe alignment ⚙️ typically represents a high‑probability support region 💪. Following the initial reaction from this area, price demonstrated a sustained upward move 📈 and established a new, untested Monthly Demand Zone 🟩.
Currently, the price is retracing toward this newly‑formed Monthly Demand Zone 🔄. The retracement is particularly significant because it occurs without any observable reaction from a higher‑timeframe supply zone 🚫🏗️. This suggests that the zone’s underlying demand remains intact 💼, and that the market is approaching an area of potential accumulation 🏦.
Additionally, the Weekly chart 📅 reveals that the current zone coincides with a Monthly Demand Zone 🧱, providing further confirmation of institutional-level support 🏛️. Overall, the technical setup indicates a favorable environment for a potential bullish reversal or continuation from this demand area 🔥📈.
📌 Conclusion
CERA is currently positioned within a multi‑layered structural support zone 🧱 that reflects strong institutional interest and demand alignment across timeframes. The fresh Monthly Demand Zone, combined with Yearly and Quarterly confluence, strengthens the bullish bias.
Unless price invalidates the zone through a sharp breakdown with high volume, the technical structure remains biased to the upside 🚀, favoring long accumulation setups and positioning this level as a potential launchpad for the next impulsive move 💫

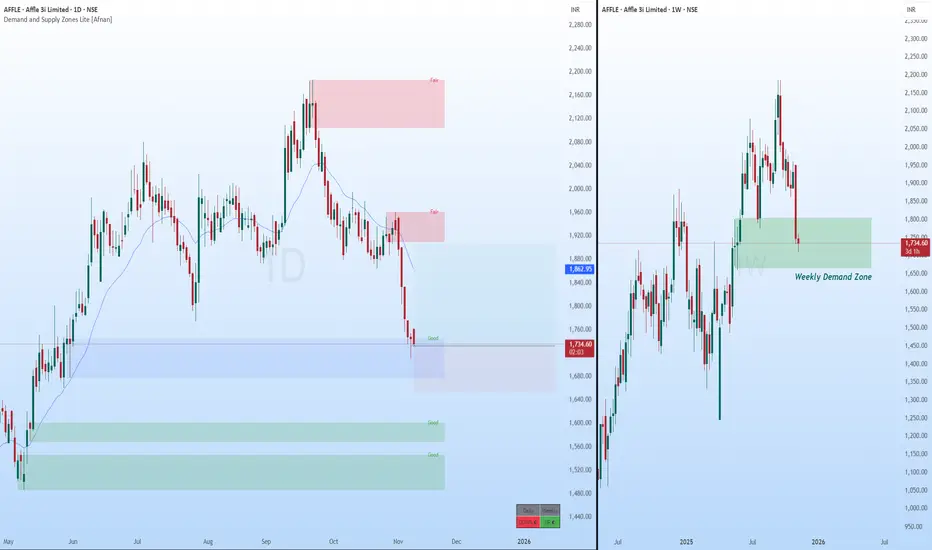
AFFLE - Demand Zone + Uptrend Intact = Perfect Storm for Bulls?Hey traders! I recently spotted something very interesting on the charts that could potentially signal a high-probability bullish setup. Let’s break it down in a simple yet professional way — so even if you’re new to price action, you’ll understand exactly what’s happening here.
📊 Multi–Timeframe Analysis Breakdown ⚡
Daily Timeframe Insight 🔍
Price is currently sitting inside a Daily Rally–Base–Rally (RBR) Demand Zone — and not just any zone, it’s a fresh, Good-quality demand zone . This means that institutional orders likely remain pending here, waiting for price to revisit.
Importantly, there’s no nearby supply zone until a 1:2 RR level, which gives the trade enough breathing space for a smooth upside move.
This zone also carries achievement strength, as it previously broke a supply zone and pushed price to a new all-time high (ATH) — a sign that big players were in control during that move.
Weekly Timeframe Context ⏳
Zooming out, the weekly trend is still bullish. We can clearly see price returning to a weekly demand zone that also has an achievement — it broke prior supply and established the recent ATH.
The retracement happening now is part of a healthy market structure — a pullback into institutional demand for re-accumulation before the next leg higher.
Even better, there’s no higher timeframe supply zone overhead, which means price is free to expand upward without major resistance.
🔥 What Does This Mean for Traders? 💡
Price is reacting from a Daily RBR Demand Zone aligned with Weekly Demand .
Trend Direction : Weekly trend is up, Daily structure supports a continuation.
Risk-Reward Outlook : Clean room till 1:2 RR, minimal supply interference.
Institutional Confluence : Both zones are achievement zones — confirming strong prior institutional participation.
Market Psychology : After creating new highs, the pullback likely represents smart money accumulation, not distribution.
🚦 Possible Trading Approach (Educational Perspective) 🧭
Entry Zone : Around the proximal line of Daily RBR demand
Stop-Loss : Just below the distal line of the demand zone
Target : 1:2 RR or next visible supply zone on the Daily timeframe
Trade Type : Set & Forget or Confirmation-based
This setup aligns perfectly with curve analysis principles, as price is trading low on the curve in an uptrend — a classic condition for demand-based entries.
💬 Final Thoughts 🚀
Trading is all about alignment — when trend, structure, and institutional footprints come together, the market often rewards patience.
“The best trades are born where patience meets preparation.”
Lastly, Thank you for your support, your likes & comments. Feel free to ask if you have questions. 💬
Stay focused, stay disciplined — and remember, every chart tells a story! 📊✨
📜 Disclaimer ⚠️
This analysis is purely for educational purposes only . It should not be considered as trading or investment advice . I am not a SEBI registered analyst .
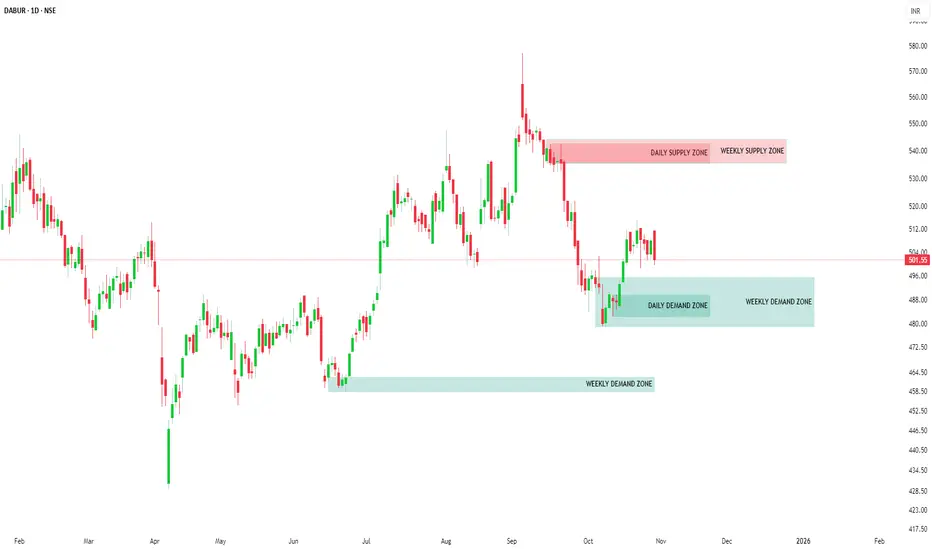
DABUR: Strong Demand Zones | Bullish Upside Setup📊 DABUR: Comprehensive Multi-Timeframe Demand-Supply Analysis
🎯 Executive Summary
This detailed analysis examines Dabur's price action across multiple timeframes using advanced demand-supply methodology. The stock demonstrates strong bullish momentum with multiple coinciding demand zones across higher timeframes, signaling potential for significant upward movement.
📅 Monthly Timeframe Analysis
Key Observations:
Strong Demand Zone Activation 💪
The monthly timeframe reveals that price has successfully picked up pending orders from a 1-month demand zone , triggering a powerful upward move. This demand zone represents institutional buying interest and forms the foundation of the current bullish structure.
Fresh Demand Zone Formation 📈
Following the initial order pickup, price has created a new 2 base candle monthly demand zone. The formation of fresh demand zones after respecting previous ones is a critical bullish signal that confirms:
Buyers maintain control of the stock
Momentum is building for continuation
The uptrend structure is solidifying
Current Month Response ✅
The current month's candle has reacted positively from this newly formed 2-base candle monthly demand zone, printing a green candle. This back-to-back demand zone respect pattern strongly suggests:
The stock has entered a confirmed uptrend
Price is preparing for a substantial upside move
Buyer dominance is firmly established
📊 Weekly Timeframe Analysis
Demand Zone Respect Pattern:
Consistent Zone Validation 🔄
The weekly timeframe mirrors the monthly bullish structure, with demand zones being consistently respected and price delivering upward moves from each zone. This repeated pattern across multiple weeks confirms the strength of the underlying demand.
Fresh Weekly Demand Zone 🆕
Currently, price is approaching a fresh weekly demand zone that has not been tested yet. Key characteristics:
Untested zones typically produce stronger reactions
Expected significant upward move from this level
High probability of continuation to higher levels
Back-to-Back Zone Formation 🏗️
The continuous formation of back-to-back demand zones, combined with price respecting and reacting from each zone with upward moves, clearly indicates:
Stock is preparing for a major upward leg
Accumulation phase is progressing systematically
Each pullback is being used for additional buying
📉 Daily Timeframe Analysis
Critical Confluence Zone:
Weekly-Daily Demand Zone Alignment 🎪
The daily timeframe shows price currently approaching a demand zone that coincides with the weekly demand zone . This creates a powerful confluence level with enhanced significance because:
Higher timeframe price structure taking precedence
Increased institutional interest at these levels
Multiple timeframe participants converging at the same price level
Maximum probability of reversal and upward continuation
Probability Assessment:
Bullish Factors ✨
✅ Back-to-back demand zone formation
✅ Consistent demand zone respect across timeframes
✅ Fresh weekly demand zone approaching
✅ Daily-Weekly demand zone coincidence
✅ Green candle formation on monthly chart
✅ Clear uptrend structure establishment
Expected Outcome 🚀
Based on the multi-timeframe demand-supply structure, Dabur is positioned for a substantial upward move. The alignment of demand zones across monthly, weekly, and daily timeframes, combined with consistent price respect and fresh zone formation, creates an exceptionally strong bullish setup with high probability of success.
📌 Conclusion
The demand-supply analysis across multiple timeframes reveals that Dabur has established a robust bullish structure with buyer dominance clearly visible. The coincidence of demand zones, back-to-back zone formation, and consistent price respect create a compelling case for s ignificant upside potential.
⚠️ IMPORTANT DISCLAIMER
Regulatory Compliance Notice
SEBI Compliance Statement:
In strict adherence to the latest Securities and Exchange Board of India (SEBI) guidelines, this content is NOT a trading recommendation, investment advice, or educational material. This publication serves informational purposes only.
Professional Disclaimer
Registration Status:
I am NOT a SEBI Registered Research Analyst (RA) nor a SEBI Registered Investment Adviser (RIA). This analysis does not constitute professional financial advice or recommendations as defined under SEBI regulations.
Risk Disclosure
Investment Advisory:
This analysis is provided solely for informational and reference purposes. Readers are strongly advised to:
Consult a SEBI-registered financial advisor or investment professional
Conduct comprehensive independent research
Perform thorough due diligence before making any investment decisions
Assess their own risk tolerance and financial situation
Liability Limitation:
The author assumes no responsibility for any financial losses, damages, or consequences arising from the use or interpretation of this information. All investment decisions remain the sole responsibility of the individual investor.
Market Risk:
Past performance and technical analysis do not guarantee future results. Markets are subject to inherent risks, volatility, and unpredictable factors.
NAUKRI - Demand & Supply🎯 INFO EDGE INDIA LTD (NSE: NAUKRI)
Sector: Internet & IT Services | CMP: ₹1,384.00 | View: Range-Bound Near Supply
________________________________________
🟥 Possible Supply Zone
Zone: ₹1,380.60 – ₹1,391.50
Price is consolidating within this resistance pocket.
Sellers may defend this area, making it a critical short-term barrier.
A decisive breakout above ₹1,391.50 can unlock momentum toward ₹1,406 – ₹1,433.
________________________________________
🟩 Possible Demand Zone
Zone: ₹1,334.80 – ₹1,322.40
Strong accumulation zone where buyers previously took control.
Likely to act as a defensive base in case of a pullback.
Re-entry by buyers expected near this zone if tested again.
________________________________________
🔹 Key Levels
Resistance: 1406.73 / 1433.67 / 1475.83
Support: 1337.63 / 1295.47 / 1268.53
💡 STWP View (Educational Insight)
NAUKRI is currently resting near supply after a sharp rally.
Sustaining above ₹1,391.50 → likely continuation toward ₹1,406 – ₹1,433.
Pullback toward ₹1,334–₹1,322 → potential re-entry zone for fresh accumulation.
Breakdown below ₹1,322 → may weaken short-term structure and invite deeper correction.
🔍 Final Outlook
Momentum: Strong |Trend: Bullish |Risk: High| Volume: High
───────────────────────────────────────────────
⚠️ **DISCLOSURE & DISCLAIMER (SEBI-Compliant)**
───────────────────────────────────────────────
📘 **Purpose:**
This content is created **solely for educational and informational purposes** to help readers understand market structure, price action, and technical analysis.
It does **not constitute investment advice**, research recommendation, or a solicitation to buy or sell any security.
👤 **Author Disclosure:**
The author is **not a SEBI-registered investment adviser or research analyst.**
All chart studies, price levels, and observations are based on publicly available data (e.g., **NSE India**, **TradingView**) and are presented purely for **learning illustration**.
📊 **Position Status:**
No active position in * * at the time of publication.
“The author may sometimes trade in the securities discussed, but such trades are independent and shared here only for educational understanding.”
⚠️ **Risk Disclosure:**
Trading and investing involve financial risk. Market movements can be unpredictable, and losses may exceed invested capital.
Readers are strongly advised to consult a **SEBI-registered investment adviser** before making any trading or investment decisions.
🧠 **Responsibility Clause:**
By engaging with this post, you acknowledge that you are **solely responsible for your own trading or investment decisions**, and that this content is intended only for **market education and awareness**.
───────────────────────────────────────────────
💬 **Did You Find This Useful?**
If this analysis helped you understand price structure or market psychology better:
🔼 **Boost** to support transparent & structured financial education.
✍️ **Comment** your insights, observations, or questions — let’s learn together.
🔁 **Share** this post with learners and aspiring traders who value discipline.
📚 **Follow stwp** for more structured, educational breakdowns on stocks & setups.
🚀 *Stay Calm. Stay Clean. Trade With Patience.*
💡 *Trade Smart | Learn Zones | Be Self-Reliant.*
───────────────────────────────────────────────

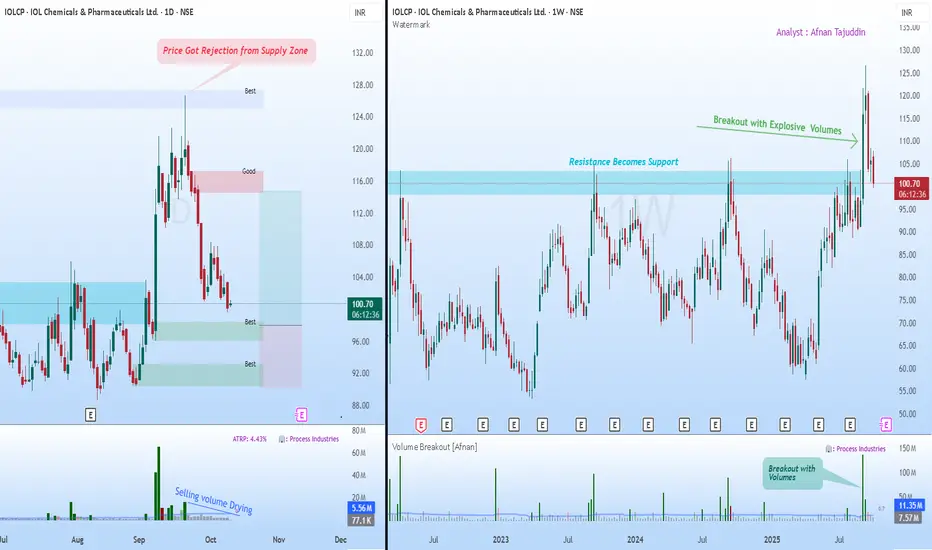
Supply & Demand Setup in IOLCP Could Signal Next Big Move📊 Supply & Demand View 📊
If you’ve been watching IOL Chemicals lately, you’ve probably noticed how cleanly it’s been respecting those key supply and demand structures. These zones aren’t random—they’re the visible fingerprints of institutions building or offloading positions in stages. When price revisits such levels, we often see sharp, almost surgical reactions.
Now, what’s catching my eye on the daily chart is the recent rejection from a supply zone. The pushback was clear, triggering a short-term decline. But here’s where it gets interesting: the selling volume has been steadily tapering off. That usually suggests the aggressive sellers are stepping aside, hinting that downside momentum could be losing steam.
Meanwhile, we’ve got multiple untested demand zones forming below—areas where buyers have shown conviction before. If price drifts into one of these regions again, I wouldn’t be surprised to see a fresh wave of institutional buying step in.
🚀 Breakout Retest View 🚀
Zooming out to the weekly chart tells a complementary story. After grinding under a major resistance for months, the stock finally broke through with explosive volume —the kind that only big money typically leaves behind. That breakout wasn’t just a blip; it reset the broader structure.
Now, the same resistance level has flipped into support—a textbook case of the law of polarity . As long as price continues to respect that zone, the larger trend remains firmly constructive.
What I find compelling is the combination of elements here: strong breakout volume, a healthy pullback, and structure alignment across timeframes. All signs point to this being a typical retest phase rather than a reversal.
✨ Final Takeaway ✨
Both charts are speaking the same language. The daily timeframe is hinting at exhaustion from sellers, while the weekly view reinforces the idea of a bullish continuation once demand reasserts itself. Should price stabilize around those lower demand zones, we could be looking at the next leg of the trend unfolding from there.
💡 Risk Management Reminder 💡
It’s easy to get carried away when the setup looks clean, but the market doesn’t owe certainty to anyone. Stick to your stop-loss, size your positions with care, and remember that discipline—more than any indicator—is what protects your capital.
“Charts reveal opportunities, but discipline secures profits.”
🔄 Stay patient, stay consistent — the market rewards preparation, not prediction. 🔄
This breakdown is shared purely for educational purposes and shouldn’t be taken as a trading or investment recommendation. I’m not a SEBI-registered analyst.
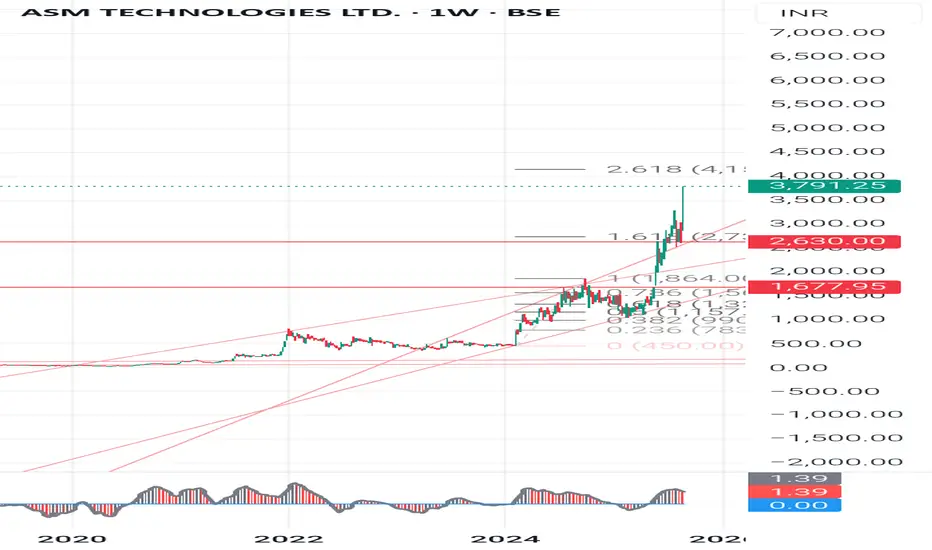
Stock Analysis: Asm technologies ASM Technologies Ltd.- technical chart and fundamentals for student learnings.
Technical & Chart Pattern Analysis (Weekly Chart)
Current Price (CMP): 1,520
Recent Move: Sharp rally from -500 in mid-2024 to a peak of -3,800 (multi-bagger move within months).
Chart Pattern Observations
1. Parabolic Rally: Price rose almost vertically - unsustainable in the short term - healthy correction likely.
2. Strong Resistance Zones:
-1,675 (immediate resistance & supply zone)
-2,630 (major resistance, recent support turned resistance)
-3,800 (swing top, all-time high)
3. Strong Support Zones:
-1,450-1,500 (immediate support, CMP zone)
- 1,250 (next support)
- 950 (major strong support, base of previous rally)
4. Candlestick Observations:
The last few weekly candles show long wicks at the top - profit booking and selling pressure.
Current trend shows bearish engulfing signals near top - short-term correction expected.
🎯Perfect Entry Points for Swing / Positional
Safe Accumulation Zone: 1,250-1,450 (near support, risk-reward favorable).
Aggressive Buy Zone: 1,650-1,700 (if stock reclaims and sustains above with volume).
Breakout Zone for Big Upside: 2,650+ weekly close - can attempt 3,200-3,800 again.
Swing Analysis:
Stock is in post-parabolic correction - Expect sideways consolidation between 1,250-2,000 for some weeks/months.
Good for gradual SIP-style accumulation instead of lump sum buy.
Fundamental Snapshot (ASM vs Competition)
Metric (FY24-25) ASM Technologies Tata Elxsi KPIT Tech L&T Tech
Market Cap -800 Cr -55,000 Cr -30,000 Cr -55,000 Cr
PE Ratio -60+ (very high) -75 -65 -55
Debt/Equity Low (Good) Low Low Low
Revenue Growth (3Y CAGR) High (-30-35%) -18% -20% -15%
Profit Margins 8-10% 20%+ 15-18% 15-20%
Dividend Yield Nil 0.8% 0.5% 0.7%
👉 Observation:
ASM is a small-cap, high-growth, high-risk IT engineering services company.
Valuation is stretched (like peers) but earnings base is tiny compared to Tata Elxsi or KPIT.
High volatility due to low liquidity in stock.
Key Learnings for Students
1. Parabolic moves always correct - don’t chase at top, wait for pullbacks.
2. Support & Resistance levels guide entry/exit - better risk-reward at support zones.
3. Volume + Candlestick confirmation is important before entering.
4. Fundamentals matter in long run - Always check PE ratio, debt levels, margins, and growth.
5. Small-cap IT can give multibaggers but carry high volatility - only invest money you can hold for 3-5 years.
👉Disclaimer:
This analysis is for educational purposes only. Not a SEBI-registered advisory. Please consult your financial advisor before making any investment/trading decision.
#ASMTechnologies #StockAnalysis #SwingTrading #ChartPatterns #SupportResistance #CandleStickAnalysis #TechnicalAnalysis #FundamentalAnalysis #InvestingForBeginners #StockMarketEducation #MultibaggerStocks #LongTermInvesting
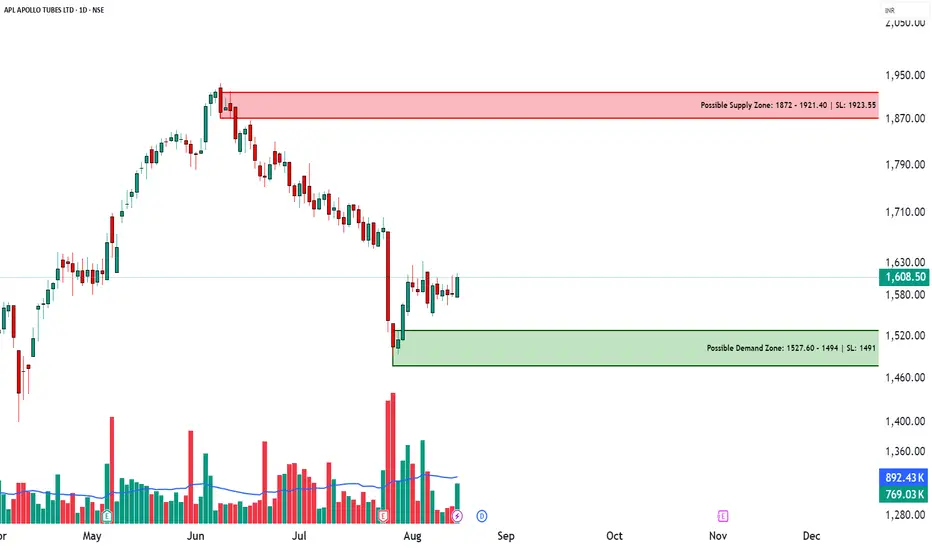
APLAPOLLO – Technical & Educational Snapshot📊 APLAPOLLO – Technical & Educational Snapshot
Timeframe: Daily / Weekly / Monthly
Overall Bias (for learning): ⭐⭐⭐⭐ Moderately Bullish – supply & demand zones identified, breakout study in progress
🔹 Candlestick Observations
Daily Bullish Piercing → Bullish Engulfing Buyers showing short-term strength
Weekly Three Black Crows → Bullish Engulfing Bearish pressure absorbed; case study of reversal attempt
Monthly NA No clear signal on higher timeframe
🔹 Supply & Demand Zones (Learning Reference)
Supply Zone (Resistance area): ₹1872 – ₹1921.40
(Stop Loss Ref: 1923.95 → possible invalidation if breached)
Demand Zone (Support area): ₹1494 – ₹1527.60
(Stop Loss Ref: 1491 → possible invalidation if broken)
🔹 Technical Observations
✅ Strong bullish candles forming
✅ Bullish Engulfing → buyer dominance visible
✅ Open = Low → intraday bullish bias illustration
✅ Double Wick → rejection from lower levels
✅ Breakout probability higher if weekly channel is cleared
📊 Volume Study
Any breakout is more reliable when supported by higher-than-average volume.
Traders typically wait for volume confirmation alongside bullish candlestick follow-through before validating a breakout.
📌 Summary (Learning View Only)
APLAPOLLO is a useful case study in demand-supply dynamics and bullish engulfing setups.
Lesson: Breakouts above consolidation + volume confirmation often strengthen trend continuation.
⚠️ Disclaimer (SEBI-Compliant)
This post is for educational & informational purposes only. It is not a buy/sell recommendation, not research, and not investment advice.
I am not a SEBI-registered advisor. Examples are for learning through chart patterns and public market data. Please consult a SEBI-registered financial advisor before making investment decisions.
💬 Found this useful?
🔼 Tap Boost so more traders can learn from structured analysis.
✍️ Share your views in the comments — let’s grow together.
✅ Follow @simpletradewithpatience for clean, zone-based setups & beginner-friendly market education.
🚀 Stay Calm. Stay Clean. Trade With Patience.
Trade Smart | Learn Zones | Be Self-Reliant 📊
KAYNES TECHNOLOGY IND LTD – Price Action + ZonesKAYNES TECHNOLOGY IND LTD – Price Action + Zones
Ticker: NSE:KAYNES | Sector: Electronics & Semiconductors
Timeframe: 15-Min | Current Price: ₹6,200.00 ▲ (+0.49%)
Technical View: ⭐⭐⭐⭐ | Chart Setup: Breakout with Zone-Based Trade Planning
Kaynes Technology (NSE:KAYNES) has exhibited strong directional momentum following a structured breakout above a prior consolidation range, as seen on the 15-minute chart. The price surged past intermediate resistance near ₹5,990 and is currently stabilizing around ₹6,200, suggesting trend continuation if supported by further volume. Marked zones like the Top Range (₹6,284) and Bottom Range (₹5,405) provide a visual framework to understand price behavior—where strength above upper resistance may invite bullish setups, while failure to hold could signal re-entry into the lower band. A clearly defined demand zone (₹5,850–₹5,764.50) with an example SL near ₹5,755 offers a contextual learning area to study zone-based entries with risk-reward alignment. Observing volume expansion on the breakout and contraction during consolidation is key for interpreting trend strength. The annotation “Trade as per Trend + Supporting Setup” reinforces the importance of directional bias and confluence. All observations are shared to help learners understand breakout structure, demand zones, and price-volume correlation in a real-world context.
⚠️ Disclaimer & Educational Note
This content is strictly intended for educational and research purposes related to the technical study of Kaynes Technology (NSE:KAYNES). I am not a SEBI-registered advisor, and no buy/sell recommendations are being made. All insights are based on personal chart analysis, price-action interpretation, and educational zone-mapping — not financial advice.
📘 The visual setup in this post demonstrates how traders and learners can study breakout structures, demand/supply zones, price-volume behavior, and risk levels in a controlled technical environment. Tools like support/resistance mapping, volume confirmation, and structure-based SL planning help illustrate disciplined trade preparation. However, trading — particularly in leveraged instruments like options or intraday setups — involves substantial risk, and losses can exceed the initial investment.
👉 Always do your own due diligence and consult a SEBI-registered investment advisor before taking any positions in the market.
👉 Practice strict risk management, and only trade with capital you can afford to lose.
The author assumes no responsibility for financial decisions based on this educational content. By engaging with this content, you acknowledge and accept these terms.
💬 Found this helpful?
Drop your thoughts, questions, or insights in the comments below ⬇️ — let’s learn together!
🔁 Share this post with your trading friends and community — help them discover clean charts, structured setups, and zone-based learning.
✅ Follow simpletradewithpatience for clear setups, educational content, and a no-nonsense approach to price action, supply-demand zones, and risk-managed trades.
🚀 Trade with patience. Trust your charts. Stay clear-headed.
Because the goal is not just to trade — it's to trade better.
Be Self-Reliant | Trade with Patience | Learn with Charts & Zones 📊

GODREJ CONSUMER PRODUCTS – Price Action + ZonesGODREJ CONSUMER PRODUCTS – Price Action + Zones
Ticker: NSE\:GODREJCP | Sector: FMCG
Timeframe: 15-Min | Current Price: ₹1,259.00 ▼ (−0.08%)
Technical View:⭐⭐⭐⭐ | Chart Setup: Range Bound Structure with Demand Zone Revisit in Focus
Godrej Consumer Products (NSE\:GODREJCP) is currently trading within a well-defined short-term range, with resistance capped near ₹1,265.50 and an anchored demand zone around ₹1,224.40–₹1,216.90. The stock has shown prior strength with a breakout above ₹1,244.35, but price is now consolidating between the orange mid-range and red supply zone, reflecting indecision. A clean zone-based structure is visible: the Top Range (₹1,265.50) may trigger bullish momentum if breached with volume, while failure to sustain may invite short setups within the range. The mid-structure zone (₹1,244.35) acts as a trend filter, while the green Demand Zone provides a case study for risk-managed entries — with example SL at ₹1,215.75 and mapped risk of ₹8.65. The Bottom Range (₹1,202.20) defines a lower band, and annotations like “Trade as per Trend + Supporting Setup” guide the learner to wait for trend + confluence. This setup is ideal for understanding how price reacts at key zones, how to frame directional bias within ranges, and how demand zones aid structured trade planning with logical stop-loss levels.
---
⚠️ **Disclaimer & Educational Note**
This content is strictly intended for educational and research purposes related to the technical study of Godrej Consumer Products (NSE\:GODREJCP). I am not a SEBI-registered advisor, and no buy/sell recommendations are being made. All insights are based on personal chart analysis, price-action interpretation, and educational zone-mapping — not financial advice.
📘 The visual setup in this post demonstrates how traders and learners can study breakout structures, demand/supply zones, price-volume behavior, and risk levels in a controlled technical environment. Tools like support/resistance mapping, volume confirmation, and structure-based SL planning help illustrate disciplined trade preparation. However, trading — particularly in leveraged instruments like options or intraday setups — involves substantial risk, and losses can exceed the initial investment.
👉 Always do your own due diligence and consult a SEBI-registered investment advisor before taking any positions in the market.
👉 Practice strict risk management, and only trade with capital you can afford to lose.
The author assumes no responsibility for financial decisions based on this educational content. By engaging with this content, you acknowledge and accept these terms.
---
💬 **Found this helpful?**
Drop your thoughts, questions, or insights in the comments below ⬇️ — let’s learn together!
🔁 Share this post with your trading friends and community — help them discover clean charts, structured setups, and zone-based learning.
✅ Follow **simpletradewithpatience** for clear setups, educational content, and a no-nonsense approach to price action, supply-demand zones, and risk-managed trades.
🚀 *Trade with patience. Trust your charts. Stay clear-headed.*
Because the goal is not just to trade — it's to trade better.
**Be Self-Reliant | Trade with Patience | Learn with Charts & Zones 📊**
---

KIRLOSBROS – A Demand-Supply Sweet Spot? My Take!🔍 What Got My Attention
We’re seeing price approach a well-formed Rally-Base-Rally demand zone, and to me, it’s got the fingerprint of institutional activity written all over it. These zones don’t just appear randomly—this kind of structure often suggests that big players may have unfinished business here, footprint of pending orders.
📐 The Demand-Supply View
Price is entering a daily demand zone —a clean RBR structure .
Just yesterday, we saw a bullish reaction candle form right off that zone. For a demand-supply trader, that’s confirmation—plain and simple.
Stop-loss placement? : just below the demand zone. And the logical target? The next known supply zone on the chart.
What’s more, the weekly chart already confirmed strength. Price bounced from weekly demand zone and powered through a traditional daily resistance—clear signs of momentum shift.
Encouragingly, there's no higher-timeframe supply standing in the way. That clears the runway.
From a demand-supply lens, this is the kind of setup we wait for—strong zone, confirmation signal, no conflicting zones above. It’s not about chasing; it’s about reacting when price comes to us.
📈 What Traditional Technical Are Saying 📈
Now, if we set aside the supply-demand lens for a moment and look at it through a more traditional view, things still line up nicely.
stock was clearly in a downtrend earlier—but that changed when it hit the weekly demand zone or say support area and reversed with strength.
What followed was a period of consolidation. That’s normal—markets pause before deciding on direction.
Then, on June 25th, the trend shifted. Price broke out above both horizontal resistance and a sloping downtrend line— and it did so with volume.
This wasn’t a fake breakout either. Price held above the resistance.
The current pullback? Honestly, it's healthy. After a move up, a dip into support (especially when it lines up with demand) often builds the base for the next leg higher.
And guess what—price is taking support from 20 EMA, which just adds to the confluence.
So even if you’re not a die-hard supply-demand trader, the technicals are telling a similar story: breakout, volume, support holding, pullback into structure—it all points toward potential continuation.
🧠 Why This Setup Stands Out 🧠
What I find compelling here is the alignment across both schools of thought which is not necessary but whether you're supply demand trader or tracking breakouts, both giving positive signal.
It's the kind of scenario where you don’t need to overcomplicate things. You’ve got:
Structure that makes sense.
Clear reaction at a proven level.
No HTF supply zone to kill the momentum.
Now, does that mean it's guaranteed to rip higher? Of course not. But when technical logics all align—this is where probability starts leaning in your favor.
🚀 Fuel for Your Trading Mindset 🚀
"You don’t need to catch every move. You just need to position yourself where risk is small and the story makes sense. 🎯"
📌 Disclaimer 📌
This analysis is shared strictly for educational purposes . It is not a recommendation to buy or sell any security. I am not a SEBI registered analyst .
Lastly, thank you for your support, your likes & comments. Feel free to ask if you have questions.
