BankNifty - Possible Ending Diagonal Scenario with Twist Ending Diagonal with a twist.
As identified support zone 39550-39600. Index post falling from 40073 highs slipped to 39759 first / did some sideways & fall continued below 39759 to very important support zone & day low in the zone as 39564
Holding in support zone we expect Index to push once again 40K + target zone where you have to be careful.
---------------Not a trading call -------Consult your financial advisor before trading----------------
Diagonals

a hit is getting ready in ONGCa fall is getting ready may give a little raise or it can fall directly from here.
disclaimer : m not a semi advisor . plan ur trade accordingly to ur strategy. this video is for sharing knowledge and educational purpose only..

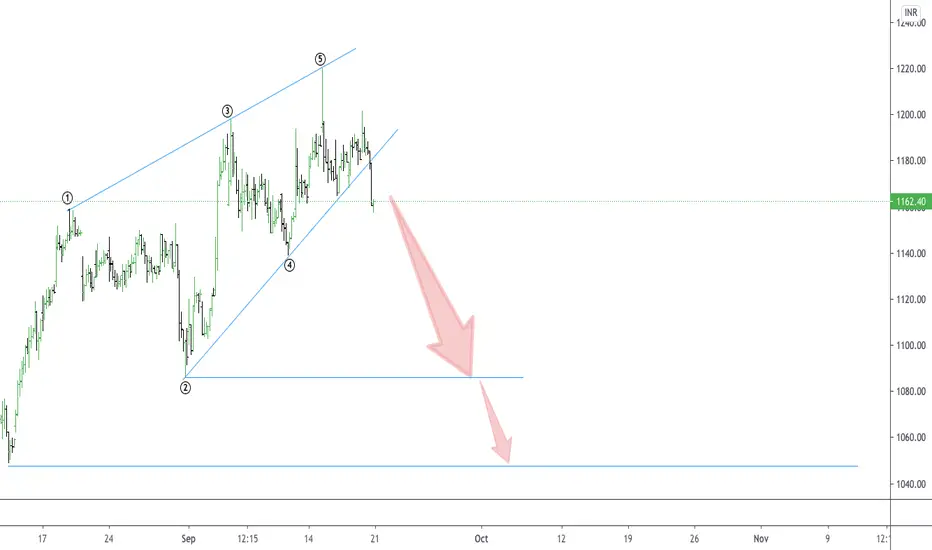
UBL Disinvestment & Downtrend Start !!TREND ANALYSIS & TRADE SETUP !
WAVE ANALYSIS !!
Follow Chart Instruction.
Do not be Hurry for entry.
Wait for Proper Entry Setup.
Buy/Sell with Best Risk Reward.
Educational Chart Only.
Wait for ENTRY CONFIRMATION !
Risk:Reward: 8-10 times.

TITAN : CASE OF ENDING DIAGONALThis is the most common diagonal that can be found out at the ending of a main trend or main correction. It consists of all the waves 1-2-3-4-5 in a single or multiple zigzags. They can be found placed at 5th wave of an impulse wave or can been seen as a wave ‘C’ of a corrective waves zigzags or flat. After the termination of the ending diagonal, a swift & a sharp reversal takes place which bring the prices back to the level from where the diagonal began.
Here in the stock of TITAN, this ending diagonal is placed as a wave-C of a corrective move.
As you can see in the chart, this pattern looks like an ending diagonal having wave-1 wave-2 wave-3 wave-4 & wave-5 . Each of these five waves are having an internal structure of three waves. So as per the wave analysis we can say the stock price of TITAN are going to fall . It has been seen that the target level of ending diagonal wave is the origin of the diagonal or the wave 2. So one should see a selling opportunity in this stock & look for the target zone as mentioned in the chart.
Bajaj FinservIt has given a diagonal breakdown which indicates 4900/4400 as possible areas before any major respite comes. On the other hand immediate resistance is at 6250 above that 6800.
