DIVISLAB - Range-to-Breakout Attempt from Demand💹 Divi’s Laboratories Ltd (NSE: DIVISLAB)
Sector: Pharmaceuticals | CMP: 6642.5
View: Range-to-Breakout Attempt from Demand | Momentum Rebuild in Progress
Chart Pattern: Accumulation
Candlestick Pattern: Strong Bullish Marubozu | Bullish Engulfing
Price Action:
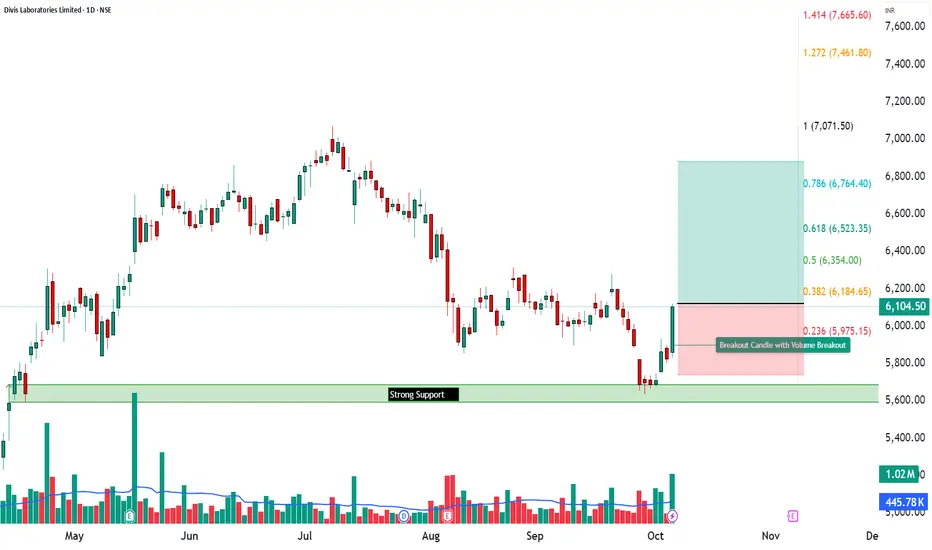
DIVISLAB has transitioned into a well-defined accumulation phase following a prolonged corrective decline. After forming a structural base near the 6200–6300 region, price action shows repeated demand absorption, indicating that selling pressure has been largely exhausted at lower levels. The recent session printed a decisive bullish expansion candle from within the range, signalling a shift in control back toward buyers. This move marks an early breakout attempt from consolidation, with price reclaiming the mid-range and pressing toward the descending supply line. While the broader structure is still evolving, the latest price behaviour reflects a clear change in character from compression to directional intent.
Technical Analysis (Chart Readings):
The chart reflects improving technical alignment following a prolonged consolidation. Price has delivered a strong bullish Marubozu / engulfing candle, highlighting decisive buyer dominance and minimal intraday supply. This expansion follows a visible Bollinger Band squeeze, pointing to a volatility release after compression. Short-term trend alignment is improving, with EMA 9–20 crossover visible and price stabilising above key short-term averages, while the broader trend remains in recovery mode. Momentum indicators support this transition, with RSI around 63 signalling strength without immediate exhaustion, MACD showing a positive crossover with expanding histogram, and ROC confirming positive rate-of-change momentum. Volume participation has expanded above recent averages, indicating that the move is supported by participation rather than a low-liquidity spike. Overall, the technical state suggests a momentum rebuild phase emerging from accumulation.
Key Levels (Chart Readings):
The chart highlights a clear demand–supply framework guiding near-term price behaviour. On the downside, a strong structural support zone is visible in the 6200–6000 region, which has acted as a base for accumulation and repeatedly absorbed selling pressure. Intermediate support levels around 6470, 6298, and 6203 further reinforce this demand structure. On the upside, overhead supply is visible near the 6700–7000 band, where prior price reactions indicate selling interest and distribution. Intermediate resistance levels around 6737, 6832, and 7004 mark zones where acceptance will be required for sustained upside continuation. The recent push from demand toward resistance reflects a range-to-expansion attempt, with price currently navigating a transition zone rather than an open trend environment.
Demand & Supply Zones (Chart Readings):
The chart outlines clearly defined demand and supply zones shaping short-term structure. On the Daily timeframe, a major demand zone is clearly established in the 6447-6345 region, where price previously(recently) formed a strong base followed by an impulsive upside move, highlighting long-term demand absorption and accumulation by higher-timeframe participants. This daily demand zone provides the broader structural floor for the current price action.
A swing demand zone is visible near the 6381–6345 region, which has acted as a base for higher-low formation and sustained buying interest. Within this, intraday demand zones around 6510–6481 highlight immediate support areas where buyers have been active during pullbacks. On the upside, supply zones remain clustered near the 7280–7330 region on higher timeframes, while nearer-term resistance is visible around the recent swing highs. Collectively, these zones frame the current environment, with price attempting to rotate upward from demand into overhead supply, making follow-through and acceptance key variables to monitor.
STWP Trade Analysis:
DIVISLAB has triggered a bullish expansion from an accumulation base, supported by improving momentum and expanding volume. From an intraday perspective, price holding above the 6660 zone keeps the bullish bias intact, with scope for continuation toward the upper resistance bands as long as demand remains defended. From a short-term swing standpoint, the same zone supports a broader mean-expansion framework over the next few sessions, provided price continues to build above reclaimed levels without slipping back into compression. The STWP view remains constructively bullish, with trend bias turning upward, RSI reflecting healthy strength, and volume behaviour confirming participation. Risk, however, remains elevated due to the proximity of overhead supply, making disciplined position sizing and structure-based risk management essential.
Final Outlook:
Momentum: Strong
Trend: Up
Risk: High
Volume: Moderate
The structure favours a continuation attempt as long as price sustains above demand zones, but confirmation through acceptance above resistance is required for trend acceleration. Traders should prioritise structure, risk control, and follow-through over prediction during this transition phase.
⚠️ STWP Educational & Legal Disclaimer
This content is shared strictly for educational and informational purposes only. All discussions, illustrations, charts, price zones, and options structures are meant to explain market behaviour and do not constitute any buy, sell, or hold recommendation. STWP does not provide investment advice, trading calls, tips, or personalized financial guidance, and is not a SEBI-registered intermediary or research analyst.
The analysis is based on publicly available market data and observed price–derivatives behaviour, which is dynamic in nature and may change without notice. Financial markets involve inherent risk, and derivatives carry elevated risk, including the potential for significant capital loss. Factors such as option premiums, implied volatility, open interest, delta, and other Greeks can shift rapidly and unpredictably.
All trading and investment decisions, including position sizing and risk management, are solely the responsibility of the reader. Always consult a SEBI-registered investment advisor before taking any financial action. STWP, its associates, or affiliates shall not be liable for any direct or indirect loss arising from the use of this material. Past patterns, structures, or historical behaviour must never be treated as guarantees of future outcomes.
Position Status: No active position in this instrument at the time of analysis
Data Source: TradingView & NSE India
💬 Did this add value?
🔼 Boost to support structured learning
✍️ Share your views or questions in the comments
🔁 Forward to traders who value disciplined analysis
👉 Follow for clean, probability-driven STWP insights
🚀 Stay Calm. Stay Clean. Trade With Patience.
Trade Smart | Learn Zones | Be Self-Reliant 📊
Divislabanalysis

DIVISLAB - Bullish Momentum + RSI & MACD Breakout📈 Divis Laboratories Ltd | Bullish Momentum + RSI & MACD Breakout 🚀
🔹 Entry Zone: ₹6,100 – ₹6,120
🔹 Stop Loss: ₹5,739.80 (Risk ~₹380 pts)
🔹 Supports: 5,917.33 / 5,730.17 / 5,628.83
🔹 Resistances: 6,205.83 / 6,307.17 / 6,494.33
________________________________________
🔑 Key Highlights
✅ Strong Bullish Candle – powerful reversal from key support zone
✅ RSI Breakout – momentum confirmation after prolonged base
✅ MACD Crossover – positive trend shift visible
✅ Bullish SuperTrend + VWAP Alignment – institutional momentum confirmation
✅ BB Squeeze-Off → volatility expansion expected
________________________________________
🎯 STWP Trade View
📊 Momentum suggests a short-term bullish rally is in play.
A close above ₹6,200 may open further upside toward ₹6,307 – ₹6,494.
⚠️ Supports at ₹5,917 & ₹5,730 act as crucial protection zones.
Volume spike confirms fresh long build-up — a classic “Buy Today, Sell Tomorrow” setup.
________________________________________
💡 Learning Note
This setup beautifully showcases how combining RSI Breakout + MACD Crossover + VWAP alignment strengthens a momentum-based reversal.
When such signals converge near Fibonacci supports, they offer high-probability swing setups with strong follow-through potential.
________________________________________
⚠️ Disclosure & Disclaimer – Please Read Carefully
The information shared here is purely for learning and awareness purposes.
It is not a buy or sell recommendation and should not be treated as investment advice.
I am not a SEBI-registered investment adviser — all observations are based on personal chart study and publicly available data.
Trading involves risk — markets can move unexpectedly, and losses can exceed invested amounts.
Past setups or patterns do not guarantee future outcomes.
If you’re a beginner, treat this content as a learning reference and start with paper trades.
If you’re experienced, align setups with your own risk and position sizing strategy.
Always consult a SEBI-registered advisor before executing any trades.
By engaging with this content, you accept full responsibility for your actions.
________________________________________
💬 Found this useful?
🔼 Give this post a Boost to help more traders learn structured setups
💬 Drop your thoughts or chart views below — let’s grow together
🔁 Share with fellow traders who love clean, data-backed analysis
👉 “If you liked this breakdown, follow for more disciplined, structured setups.”
🚀 Stay Calm. Stay Clean. Trade With Patience.
Trade Smart | Learn Zones | Be Self-Reliant 📊
DIVISLAB: Flag & Pole Breakout Setup Targets New ATHsNSE: DIVISLAB | Pharmaceuticals | Large Cap | Updated: June 17, 2025
📊 Technical Structure
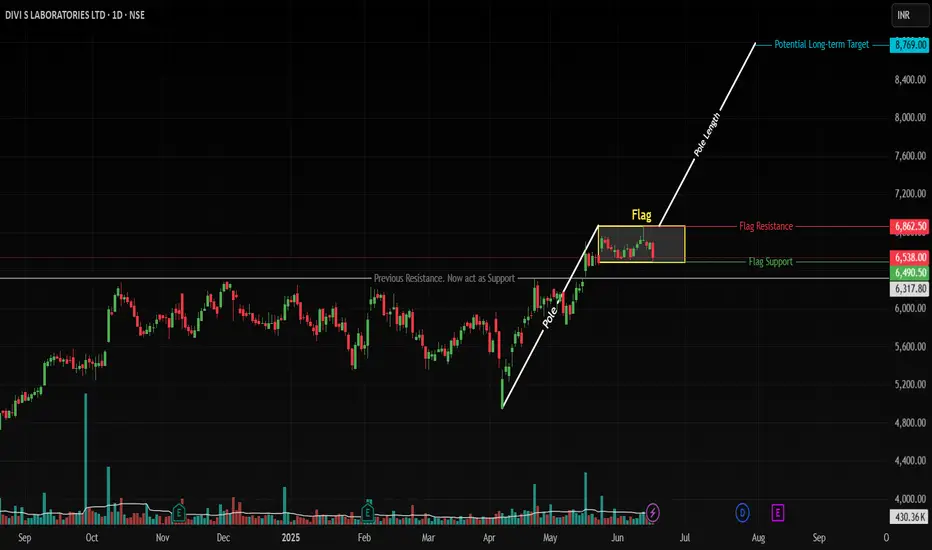
Pole Formation: Rally from 4,955 → 6,862 (1,907 points) on high volume
Flag Consolidation: Tight range between 6,490 (support) and 6,800 (resistance)
Key Breakout Trigger: Daily close above 6,862 (ATH)
Pattern Target: 8,769 (6,862 + 1,907 pole length)
Critical Support: 6,300 (confirmed swing low)
🎯 Price Targets & Roadmap
Immediate Target: 7,200 (2024 swing high)
Strong Resistance Zone: 7,600-7,750 (analysts ceiling)
Pattern Target: 8,769 (100% pole extension)
Confirmation Required for 8,769:
• Breakout volume >650K (20% above 20D avg)
• Pharma sector PE >42 (currently 39.2)
⚡ Trade Strategy
Scenario 1: ATH Breakout (Preferred)
Entry: Daily close above 6,862 (6,880-6,900 zone)
Targets:
• 7,200 (book 30% profits)
• 7,600 (book 50% profits)
• 8,769 (full exit)
Stop Loss: 6,700
Scenario 2: Flag Breakdown
Entry: 6,300-6,160 (50-DMA confluence)
Target: 6,800 flag retest → 7,200
Stop Loss: 6,050
Risk Management Essentials: Max 2% capital per trade
⚖️ Fundamental Drivers
Strengths:
• 15.4% ROE (vs sector 12.1%)
• 17% EPS growth (FY26E)
• FII holdings ↑2.1% YoY to 18.01%
Risks:
• High PE 79.2 (sector 39.2)
• Overbought risk above 7,600
⚠️ Critical Risks
Valuation Risk: Profit-booking likely near 7,600
Sector Risk: Pharma index seasonality (+4.91% avg June)
📉 Real-Time Levels
Current Price: ₹6,538 (-2.24% today)
Support: 6,490 (flag base) → 6,300 (swing flip)
Resistance: 6,800 (flag top) → 6,862 (ATH)
Volume Alert: Breakout requires >650K shares
✅ Conclusion
DIVISLAB offers a high-reward setup with defined risk parameters. The flag breakout above 6862 is the preferred play, backed by sector leadership and earnings growth. Always hedge with stops—overvaluation remains a concern.
📜 Disclaimer
This analysis represents my personal market view and not investment advice. Trading carries significant risk of capital loss. Past performance doesn't guarantee future results. Always:
Conduct your own due diligence
Consider your risk tolerance
Consult a SEBI-certified advisor
Verify real-time data before acting
Never risk more than you can afford to lose.
DIVISLAB : Rounding Bottom Consolidation Breakout..!!DIVISLAB is showing good consolidation Breakout above the Rounding Bottom structure breakout.. target and sl are on the chart....
there is lot of scope in large cap stocks as the data shows..
All data is available in public domain..
CMP : 6580
TG : 7800
SL : 5840
Stock's selection based on 5 Point Analysis:
1: Idea : Breakout.
2: Support : Volume, Delivery .
3: Technical : 21/55/200-EMA, Super trend up, RS>0 RSI.
4: Fundamental : PE, PAT, Industry & peer PE and sector performance.
5: Timing : Entry Timing on Daily chart.
Disclaimer : It is my personal view as a trader and for educational purpose only. Equity market involves risk .
Please consult your financial adviser before taking any decision.
Disclosure : might be Hold

DIVIS LAB DIVIS lab is on verge of a very very big breakout which could drive it in open sky everybody should consider it for long
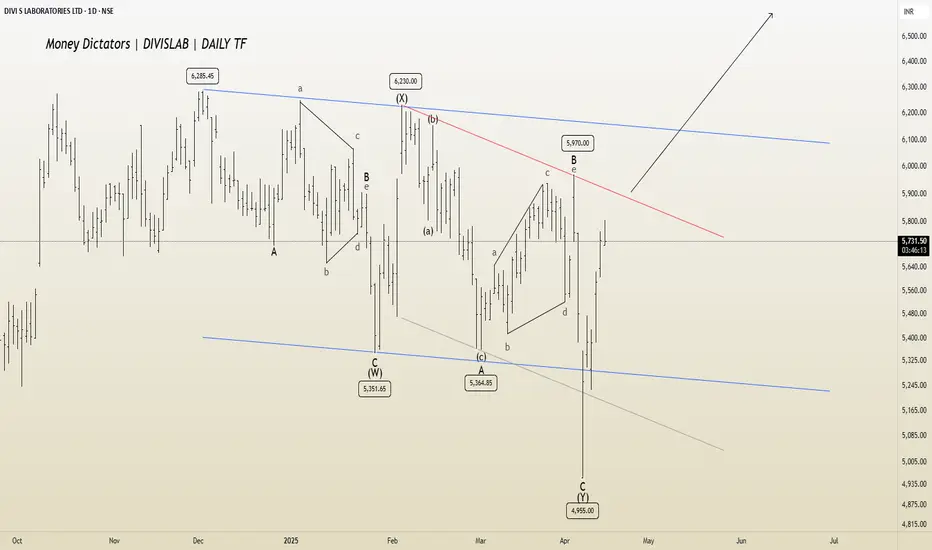
DIVISLAB: Eyeing Breakout from A-B-C Channel Daily TF
DIVISLAB is nearing the completion of a complex W-X-Y corrective pattern. A long position could be considered after a breakout from the A-B-C channel, with potential targets in the 6100–6400 range.
I will update more information soon.
Short Term Trading Opportunity in Divis Labs for > 10% UpsideHi,
NSE:DIVISLAB has given a Bullish Flag Breakout on daily charts with very good volume.
MACD is also on the bullish side on daily, weekly and monthly time frames. RSI is also on the bullish side on daily, weekly and monthly time frames.
In the current market scenario, I am expecting that the bullish momentum will continue.
Complete price projection like entry, stop loss and targets mentioned on the charts for educational purpose.
Don't Forget to Follow me to get all the updates.
Please share your feedback or any queries on the study.
Disclaimer: Please consult your financial advisor before making any investment decision.

Potential Breakout: Divi's Lab Above 5040, Targeting 5120Details:Asset: Divi's Laboratories Limited (DIVISLAB)Breakout Level: Above 5040Potential Target: 5120Stop Loss: Below breakout level or as per risk toleranceTimeframe: Short-termRationale: Divi's Laboratories Limited (DIVISLAB) is on the verge of a breakout above the 5040 level. If the stock sustains above this level, it could potentially move up to the 5120 target, indicating a short-term bullish momentum.Market Analysis:Technical Breakout: The breakout above 5040 suggests a possible upward move towards 5120, signaling a short-term bullish trend.Market Sentiment: Positive sentiment or underlying strength in the stock may support this short-term breakout scenario.Price Target:The immediate target for DIVISLAB is set at 5120, based on the breakout above 5040.Risk Management:Implementing a stop loss strategy below the breakout level is crucial to manage risk in case of unexpected price reversals.Timeframe:The move towards 5120 is anticipated in the short term, but actual timing may vary based on market conditions.Risk-Reward Ratio: Consider individual risk tolerance and adjust position size accordingly to maintain a favorable risk-reward ratio.As with any investment opportunity, conduct thorough analysis and consider factors such as market trends, company fundamentals, and risk management strategies before making trading decisions.

DIVIS LAB: Ending DiagonalTheory:
DIAGONAL:
Diagonal are the motive waves like an impulse wave, but diagonals are different from impulse wave in that they do follow the first two Sutras (rules of impulse wave) for wave analysis, but it does not follow the third one i.e. Wave 4 should not intervene the territory of the wave 1. In a diagonal wave 4 always enters into the price territory of the wave 1.
Properties Of Diagonals:
Diagonals can be contracting or expanding type being expanding diagonal a rare one.
In contracting type, wave 3 is shorter than wave 1, wave 5 is shorter than wave 3, and wave 4 is shorter than wave 2.
In expanding type, wave 3 is longer than wave 1, wave 5 is longer than wave 3, and wave 4 is longer than wave 2.
Types Of Diagonals:
LEADING DIAGONAL
ENDING DIAGONAL
LEADING DIAGONAL: In a leading diagonal , waves 1,3, and 5 are all impulsive in nature or all in corrective form of zigzags. Wave 2 and wave 4 are always present in a zigzag form. A leading diagonal suggests the starting of a new wave & that is why it can develop wave 1 of a impulse wave and a first wave of a zigzag pattern.
ENDING DIAGONAL : This is the most common diagonal that can be found out at the ending of a main trend or main correction. It consists of all the waves 1-2-3-4-5 in a single or multiple zigzags. They can be found placed at 5th wave of an impulse wave or can been seen as a wave ‘C’ of a corrective waves zigzags or flat.
After the termination of the diagonal , a swift & a sharp reversal takes place which bring the prices back to the level from where the diagonal has began. (generally it retrace back to the wave-2 of the diagonal sturcuture)
OUTLOOK:
Prices are likely to extend the recovery towards 4070 in the coming weeks with any weakness holding above the zone of 3460

DIVISlAB Selling Point Of View On 29th Feb 2024 The main support was broken yesterday, and it has also undergone a small retest. Wait for a moment; it should undergo another retest before entering.

DIVISLAB LONGLooking good for long once it break's out the resistance. Avoid short positions, however if you wanted to short let the candle close below the horizontal line
It is 0.23% retracement.

# DIVISLAB Breakout Analysis Stock is near to BO on daily chart with good volume spurts, stock retested it's support after 1st BO, follow chart for proper entry and exit levels.

DIVIS Labratories - Break Divi's Laboratories Limited is an Indian multinational Pharmaceuticals company and producer of active pharmaceutical ingredients and intermediates headquartered in Hyderabad, Telangana, India. The company manufactures and custom synthesizes generic APIs, intermediates

Divis LabHead and shoulder pattern in Divis Lab suggest more deeper levels.
Start adding for long term near 3200/3000 50% amount anda rest 50% near 2800 level if comes.


Divis Lab Analysis !! Broke Out📈 Divis Lab 📉
This broke out from a Resistance Zone of downtrending Trendline and closed above previous high of 4450.
On Buy Side I am looking for Targets of 4680, 4940 and 5370.
StopLoss should be kept below 4200-4300zone.
It offers 1:3 Risk To Reward.
All Important Supports and Resistances are drawn in chart. All levels are on closing basis.
Please have a look and revert back if you need some more study on it.
Disclaimer : Consult Your Financial Advisor Before Taking Any Decision On This Analysis.

Divis Labs - Short Term Buy - 21 April 2022HI,
Divis Labs looks good for a breakout after a consolidation of many days.
Best buy would be above 4550 with a SL of 4349 (as of now) and targets of 4960 and 5100.
Daily Macd is showing signs of bullishness and Weekly Macd is giving a breakout for upside moves.
Rsi is above 50 and a move above todays high will confirm the bullishness.
Stock is trading above Monthly pivot for quite some time now.
Could be a Flag Pattern also, with a target of Pole - of about 596 points, whichgives a target of around 5000 approx.
Disc : For educational Purpose Only!!

Divis Labs (Bullish stance)Divis Labs:
Sector: Pharma and Biotechnology
Industry: Pharma
Divis Laboratories (Weekly):
1. Double Bottom
2. Breakout of Double Bottom
3. Positive Crossover of 5,13 Weeks Exponential Moving Average
Daily:
1. RSI Bullish Divergence and Double Bottom Breakout
2. Trendline Breakout
3. Good to buy above consolidation breakout (closing above 4590)
4. Positive crossover of 5,13 Days Exponential Moving Average
5. Trading above 200 Days Exponential Moving Average
Addl Points:
1. FII/FPI have decreased holdings from 19.30% to 18.45% in Mar 2022 qtr
2. Mutual Funds have increased holdings from 13.35% to 13.68% in Mar 2022 qtr.
Note:
1. The above analysis is just for educational purpose.

Divis Lab - Long OpportunityLong Opportunity
Divis Las has moved more than 100 points on the last trading day, and then it went sideways. If it crosses the level of Rs. 4573.90 then we can go for long. there is a long target for the positional trader because this stock has created a double bottom pattern on the daily chart, which means there is bullish movement expected in upcoming days.

Divis labDivis lab buy signal Buy above 4540 for an target 1 - 4750, target - 5000. Form an W pattern in Day frame buy if cross 4540

Divis Lab - Long OpportunityLong Opportunity -
This is the recovery rally, but there is not a huge impact we have seen on Divis Lab stock, but it may go positive if there is any positive news about the Russia-Ukraine war. For now, we can expect positive movement in the stock. If this stock opens a gap up or flat we can go for long once it crosses the level of Rs. 4480.65 for the target of Rs. 4524.75.

Divis Lab - Short OpportunityShort Opportunity -
Divis lab has formed a bearish pattern on Day, 1 Hour and 5 Minutes timeframe chart and for upcoming days there will be a bearish movement expected in the pharma sector. There is no direct connection between the Russia-Ukraine war but as the many pharma sectors have their plants in Russia, there may be an effect we can see on this stock too. The level of Rs. 4430.30 is very crucial and if this support breaks there will be a sharp fall expected. We can go for short if this level breaks for the target of Rs. 4373.20.
Happy Trading!

Divis Lab - Long OpportunityLong Opportunity -
Divis lab has shown bullish sentiments, and it is expected to go up on the next trading day. If it crosses the level of Rs. 4520.55 then we can go for long for the target of Rs. 4551.30. But it has formed a double bottom pattern in 15 minutes timeframe, so it might retrace at a neckline of Rs. 4466.65.
Happy Trading!
