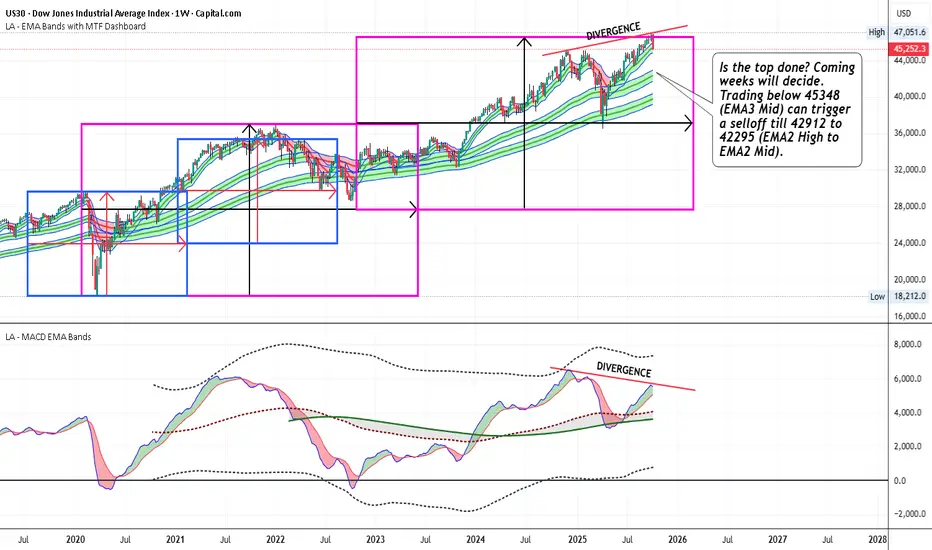
US30 - Trading below 45348 can trigger a selloff till 42912Is the top done? Coming weeks will decide. Trading below 45348 (EMA3 Mid) can trigger a selloff till 42912 to 42295 (EMA2 High to EMA2 Mid)
DJI
Bearish Signal in Dow Jones: Will 45,000 Hold?Dow Jones Analysis – Bearish Signal Emerges
The Dow Jones Industrial Average (DJI) has shown signs of weakness over the past couple of sessions. On Tuesday, the index formed a shooting star candlestick pattern — a classic reversal signal that often indicates exhaustion in the uptrend.
Yesterday, the shooting star was confirmed by a follow-up bearish candle, which strengthens the case that a short-term top may be in place for the index. This suggests that buyers are losing control, and sellers are stepping in at higher levels.
Key Support Zone – 45,000
The immediate and crucial support for DJI is placed around 45,000, a level that has held strong in the past. However, the index is now testing this zone again, and the price action shows clear weakness.
Trend Breakdown Adds to Bearish Bias
Looking at the chart, the trendline support is also at risk of breaking. If the index fails to hold 45,000 decisively, this breakdown could open the door for deeper correction, leading to further downside targets in the short term.
Conclusion
Bearish pattern confirmed: Shooting star + follow-up candle.
45,000 is key support: A breakdown here confirms bearish momentum.
Short-term top likely: Weakness could extend further if supports fail.
📉 For now, traders should stay cautious on DJI until it either reclaims higher levels or establishes fresh support below.

#XAUUSDGOLD start it's correct from 22 April 2025 ,and complete a flat correction on 15 may 2025 , after that the price rise but not able to cross the high of B wave ,so it enter in a complex correction and form a X wave on 16 jun 2025 and make its A wave on 30 june 2025 , and rice to B wave and forming a double flat correction .the price is now in its C wave and expected to come lower to the level of 3200-3100.We can put over SL to the high of B wave.

US 30 / Dow Jones / DJI forming bullish patternLooking at US30 US market is forming a bullish pattern called inverted Head and shoulder breakout can lead to a target of all time high.
SPX/ NDX/ DJI - Elliot Wave - Change in CountsI have expected May 8th as the top of the pullback in this post:
However, it seems that there were more legs pending.
View still remains that this is a counter trend rally, and we will eventually head down again.
We are in 3rd of C and we will get another move up in 5th, which should mark the end of the entire leg up.
If I am invested in US markets - I would use this rally to book profits!
View is similar in Nasdaq and DJI, so not sharing those charts again. :)
All the best!

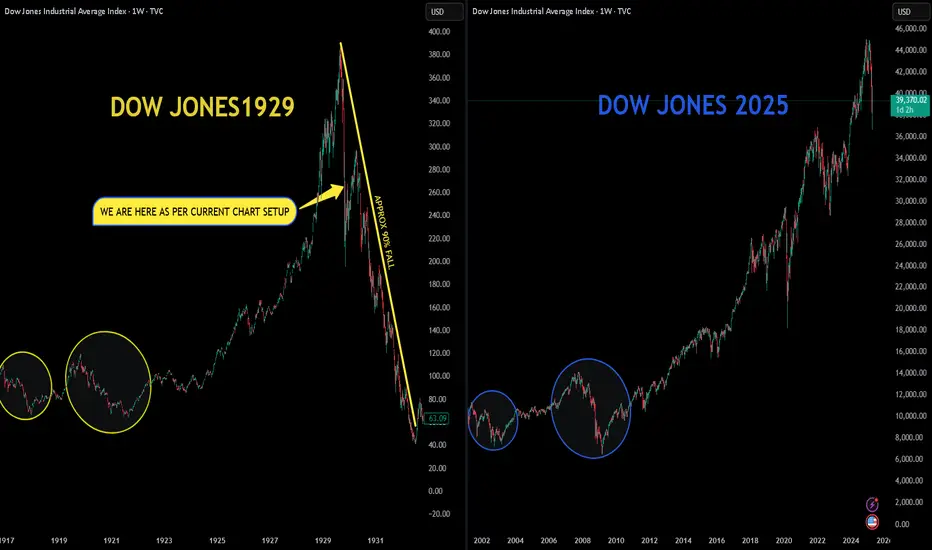
The 1929 Trade Tariff Vs The 2025 Trade Tariff (DOW JONES)Charts are self explanatory.
This is a simple comparison of the 1929 Dow Jones with the 2025 Dow Jones. As you can observe, there are many similarities.
Big Question: Can the Dow Jones again experience a 90% correction, similar to the one between 1929 and 1932 ?
NOTE: This is just an observation/correlation.
Disclaimer: This is for demonstration and educational purpose only. This is not buying or selling recommendations. Please consult your financial advisor before taking any trade.
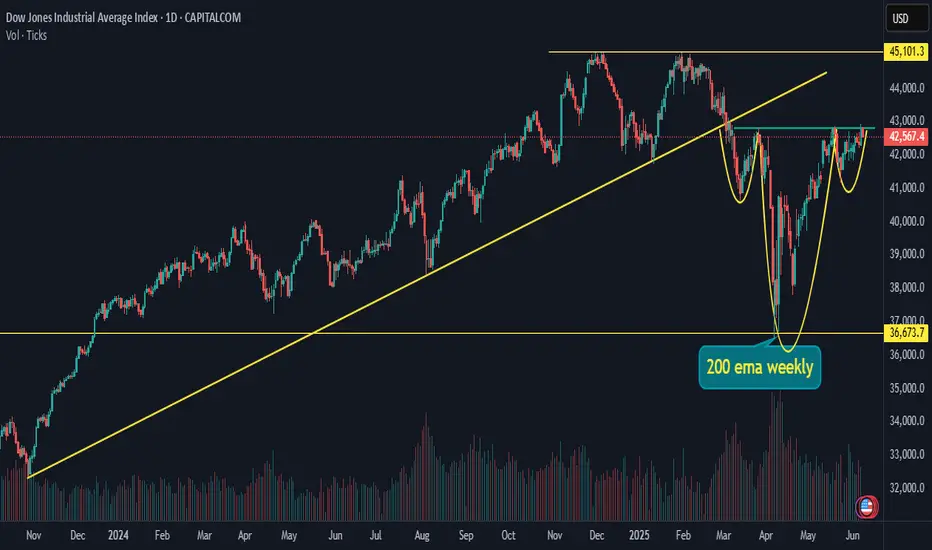
DJI Dow Jones US futuresUS30 futures are currently on a support of weekly 200 EMA.
also this is a retest of previous breakout range 36600- 36800.
This can be a good level to bounce if market wants to reverse so accumulation can be done in small quantity.
But everything is in hands of Trump chacha.

DOW JONES - TRIANGLE AT RESISTANCE - EXPECTING SELL OFFSymbol - DJI
CMP - 44593
The Dow Jones Industrial Average is currently trading within a symmetrical triangle pattern, indicating a period of consolidation. This technical structure suggests that the price is experiencing a balance between buyers and sellers, with no clear directional bias in the immediate short term. The breakout of this triangle, whether upwards or downwards, will likely determine the next significant move in the market. At present, my personal bias is towards the downside, anticipating a potential bearish breakout.
Currently, the key resistance zone for the Dow Jones lies between 44900 - 45100. This range is proving to be a formidable barrier for upward price movement. Until this zone is decisively broken to the upside, the continuation of the bullish trend appears unlikely. The market is facing significant resistance, and it seems that for any sustained bullish momentum, a strong move above this level is required.
If the triangle pattern breaks downwards, it could signal a correction that may lead the price to form a double top pattern on the larger time frame. A double top is a classic bearish reversal pattern, and its formation would likely confirm a shift from the prevailing bullish trend to a more bearish outlook. In this scenario, traders should be cautious of further downside risks, especially if the price breaks key support levels.
However, if the price manages to break above the resistance zone of 45100 and sustains that move, the bullish trend would likely continue, and any short positions would be invalidated. A breakout above this key resistance would indicate a strong continuation of the uptrend, signaling that the market is poised for further gains.

Dow Jones Next Target is $44,309Dow Jones has Breakout of the Channel Pattern and continues its Uptrend. The First Target is $44,309, and the Second Target is the Top of the Rising Channel Pattern.
I want to help People to Make Profit all over the "World".

DJI - Dow Jones Industrial Index by KRS Charts 16th October / 6:58 PM IST
What is next possible Move for DJI ❓Technically.
1️⃣ As we can see, DJI is in HHs and HLs upside trend. With recent high small Flag Target is achieved so profit booking is expected. ✅
2️⃣ Along with it, Index is above 100EMA again bullish trend it confirms. View wise Market is Bullish and new upside Target can unlock after its breakout from above Red Resistance zone as we can see in Chart.
3️⃣ In case of correction all the supports are marked in Charts will possibly help market to Bounce back from those levels.
4️⃣ Despite of all lower support my view on DJI will stay Bullish until it will break Green Support Zones and stay underneath of 100 EMA ⚠️⚠️

Dow Jones Analysis, waiting for Confirmation of the TrendThe Dow Jones is trading within a Channel Pattern. Waiting for Confirmation of the Trend, whether it breakout above the channel or retraces to the bottom of the Channel.

Dow Jones Industrial Average:All Time High Level Fresh BrackoutThe DJI is near in the fresh braclout, The DJI is ready for the Fresh brackout this is perfect time to play in the Brakout. Next month US Market is ready for the Interest Rate cut, this is boost in the Economy of the market.

Tesla (Tsla) Long Swing Idea Weekly timeframe is bullish
Daily timeframe is bullish
4HR timeframe is bullish
50ema is adding confluence

Best Buy Swing IdeaPrice has tapped into weekly and daily demand zone
Price is at 50 Ema
There is shift in 4HR structure from bearish to bullish
note: this is not financial advise and not to be treated as financial advise,.solely your decision and responsibility. Just my public journal.

MARKET CRASHNSE:NIFTY TVC:DJI
US market 1929 vs 2024
Is it just coincidence or is history going to repeat itself ??
Great Depression, was a worldwide economic downturn that began in 1929 and lasted until about 1939. It was the longest and most severe depression ever experienced by the industrialized Western world, sparking fundamental changes in economic institutions, macroeconomic policy, and economic theory.
Similarities and differences between the microeconomic conditions during the start of the 1929 market crash and those in 2024.
Similarities
Credit Expansion and Financial Innovation:
1929: The 1920s saw significant credit expansion, with many Americans buying stocks on margin (borrowing money to buy stocks), leading to inflated stock prices.
2024: Similarly, the 2020s have seen rapid credit expansion globally, with innovations in financial products and increased borrowing, contributing to elevated asset prices1.
High Leverage:
1929: High leverage was prevalent, particularly in the stock market, where investors borrowed heavily to invest.
2024: High leverage is also a concern today, not just in stock markets but across various sectors, including real estate and corporate debt1.
Financial Sector Vulnerabilities:
1929: The financial sector was vulnerable due to speculative investments and lack of regulation, leading to bank failures.
2024: Today’s financial sector, while more regulated, still faces vulnerabilities from high leverage and interconnected global markets1.
Economic Contraction:
1929: The U.S. experienced a severe economic contraction, leading to the Great Depression.
2024: There are concerns about economic contraction due to various factors, including high inflation, geopolitical tensions, and slowing growth in major economies.
Differences
Policy Responses:
1929: The policy response was slow and inadequate. The Federal Reserve’s actions were limited, and there was a lack of coordinated fiscal policy.
2024: Today’s policy responses are much more proactive. Central banks and governments have implemented significant monetary and fiscal measures to stabilize economies.
Globalization:
1929: The global economy was less interconnected, with the U.S. being the primary driver of the economic downturn.
2024: The global economy is highly interconnected, meaning economic issues in one region can quickly spread to others. This interconnectedness also allows for coordinated policy responses.
Technological Advancements:
1929: Technological advancements were limited, affecting communication and the speed of economic activities.
2024: Technological advancements have transformed economies, enabling faster communication, better data analysis, and more efficient markets1.
Regulatory Environment:
1929: There was minimal regulation of financial markets, contributing to speculative bubbles and bank failures.
2024: The regulatory environment is much stricter, with measures in place to prevent excessive risk-taking and ensure financial stability.
Conclusion
While there are some striking similarities between the microeconomic conditions of 1929 and 2024, particularly in terms of credit expansion, high leverage, and financial sector vulnerabilities, the differences in policy responses, globalization, technological advancements, and regulatory environments are significant. These differences suggest that while there are risks, the tools available to manage economic downturns are more robust today.
========================
Trade Secrets By Pratik
========================
Disclaimer
NOT SEBI REGISTERED
This is our personal view and this analysis
is only for educational purposes
Please consult your advisor before
investing or trading
You are solely responsible for any decisions
you take on the basis of our research.

DJIWhat has started in Oct 2023 has formed a parallel channel. It has completed one of the target given in Aug 2023 for 40904.
from 35210 on 8th Aug 2023 to high of 41096 and highest closing of 40842
cmp 39737
Now going forward we may expect selling continue until 37100
35500 is good support for pull back, at the same time it is the lower edge of the channel.
Bull run continue.
Please understand this is election year for US, I don't see selling until Nov 2024

US30USD 4H ProjectionUS30USD 4H Projection.
Dow Jones in ranging from last 10 Days.
The overall trend is bullish.
4H candle give confirmation for long.

DJI If 38902 doesn't sustains in hourly then it could 📉 to 38247 within 29th May
Disclaimer:
It's a personal view not a financial advice and I assume no responsibility and liability whatever outcome arises.

US30 SetupFOREXCOM:US30
Hello traders , here is the full multi time frame analysis for this pair, let me know in the comment section below if you have any questions, the entry will be taken only if all rules of the strategies will be satisfied. wait for more Smart Money to develop before taking any position . I suggest you keep this pair on your watchlist and see if the rules of your strategy are satisfied...
Keep trading
Hustle hard
Markets can be Unpredictable, research before trading.
Disclaimer: This trade idea is based on Smart money concept and is for informational purposes only. Trading involves risks; seek professional advice before making any financial decisions. Informational only!!!!

DJI If rejects from red line in next hourly candle or any closing below that then could test below 📉 📉
green line or 39819
Disclaimer:
It's a personal view not a financial advise and I assume no responsibility and liability whatever outcome arises.

Nasdaq: Ending DiagonalIndex has formed a terminal structure which is known as Ending diagonal. This suggests that index is likely to fall towards 16400-16000 zone in the coming weeks and months ahead.

Breakout in Dow Jones Industrial Average (DJI)...Chart is self explanatory. Levels of breakout, possible up-moves (where stock may find resistances) and support (close below which, setup will be invalidated) are clearly defined.
Disclaimer: This is for demonstration and educational purpose only. This is not buying or selling recommendations. I am not SEBI registered. Please consult your financial advisor before taking any trade.

DJI Intraday Prediction Levels for 29 Nov 2023DJI Intraday Prediction Levels for 29 Nov 2023
The chart indicates 15 min time frame. These Levels act as Support or Resistance according to price. They are strictly for Intraday Trading only. Execution only after break and close above the Resistance zone or below the Support zone.
Major Resistances- 35495,35555,35610,35640,35703,35780,35860,….
Major Supports-35350,35280,35230,35175,35115,35065,3500,…
These levels act as support and resistance. You have to trade according to level breakout or breakdown. First target is immediate next level. When first target is achieved go for the next one and so on.
If You are a new trader then just watch ( No Trade) these levels for some days.
Happy trading.
Disclaimer:
I am not a SEBI Registered Analyst. Anything posted here is my own analysis and views. This is created for educational purposes only. Always consult your Financial Advisor before taking any decision or trade.
