04 nov 2022 DOW jone live analysis04 nov 2022 DOW jone live analysis, for Intraday Study Purpose only
DJI

DJI DOW BOTTOM CONFIRMATIONDOW THEORY RULES:
1. How to Identify Significant bottom(valley)?
We need two parameters
1. Width:- Should be more than 31 days(≈ 4 weeks)
2. Depth:- Should be more than 4%, in the valley we measure Depth by looking from top to the bottom (visualizing as seeing a pool of water from the surface and measuring its depth).
AS PER DOW THEORY, NEW BOTTOM CAN BE CONFIRMED TOMORROW IN DJI IF IT SUSTAINS ABOVE 30K LEVEL, TOP IS AT 34856 UNTIL THAT IS NOT TAKEN OUT DJI IS STILL IN A DOWNTREND. BUT THE BOTTOM CREATION WILL BE A GREAT PLUS POINT FOR THE BULLS TO KEEP A SL. ONLY IF TOMORROW (WEEKLY BASIS) IT CLOSES ABOVE 30K.

US10Y - Looks like a high is completedUS10Y could be in at its peak in current wave cycle to stary a ABC correction.
RSI on daily is also showing divergence indicating topping out sign. The correction in US10 will be good for equities.
View will be invalid if the high 4.123 is broken and wave 5 might get extended.
User discretion!

Live DJI Analysis 14-10-2022 by SauravDJI Analysis 14-10-2022 by Saurav, Position will be LONG from the Entry point.

DJIDow jones industrial Average index is in parallel since Jul 2021 in downward bearish move.
Looking at the past, it has good probability to bounce near gap area

Bullish Divergence in Dow Jones Industrial AverageRSI Bullish Convergence was there on weekly charts of Dow Jones only 5 times in last 20 years, which was always followed by average 15-18% market rally
similar RSI convergence is visible on weekly Dow Jones chart Right now, pre-covid highs are acting as a support
Disclaimer: Chart, data and levels for study purpose only. I am not a financial advisor. Use your intelligence before investing.

DOW JONES fall prediction with levelsDJ:DJI is following the zones I had mentioned in my last post, expecting more 5-10% fall from here in dow jones.

Dow Jones - Inverse Cup and Handle / Rounding Top - Key levelsTrading at key support now.
Levels in the chart.
Forming lower lows so far.

Comparison of leading markets to anticipate the future movementAn attempt to anticipate the future movement of different markets over next 5 to 10 years. If we see the movement of 6 markets, we can have some insights.
Among the 6, Germany (DAX- purple) and India (NIFTY50 - red) look like being in the middle zone of the direction of movement since 1991.
Hong Kong (HSI - green ) came down gradually from around early 2018 to 2022, now looks at a fair level (may fall further to form a bottom).
USA(DJI - blue ) has recently started falling after forming a sharp peak, I am expecting a fall probably to 27500 levels or may go to 22000.
India (Nifty50 - red ) looks bullish for long term but may see a pullback to 15000 levels or even to 12000 levels in coming years.
UK (UKX - yellow) looks sideways and lacks long term strength as evident in the economy in recent times for United Kingdom.
France (CAC40-brown) looks sideways from a long term perspective.
Germany(Dax-purple) looks the most balanced in terms of bear and bull phases.
Overall it looks like the bear phase has started for most markets and it may take several years for healthy bull phase to be back.

WE BOUNCE THIS WEEK!Historically, when 200 MA is tested on weekly frame, it bounces. IM looking for this bounce- retest- lose 200- bearish retest- continuation to downside.

Inverted Cup & Handle pattern in monthly timeframeHello All,
Market is at very important point where it can take support and go higher and if rejection we have big fall.
My expectation is at least 3000 points if cup and handle broke.
FED hike warnings really bothering the market and on Friday it broke previous low and touches 20% fall from Jan 2022. However if it closed with the same momentum on Friday then we would’ve seen big gap down on Monday opening.
Please note this is just my observation only and for purely for educational purposes.
Trade at your own risk.

DJI 1 DAY CHART This is just view of DJI 1D chart that break the trendline in major time frame so if you are long in DJI so cut your long position and take bearish bate. And target in short term is 30600 in downside and further fall coming the break of 30600.

Dow Jones gonna Sky rocket!!Dow Jones is in a support zone now. There is a high chance for huge buying pressure. I've used a mix of Smart Money Concept + Fibonacci + Price Action.

Dow | bearish viewBearish Outlook, simple charts
*for educational purpose only, trade at your own risks !!

DJI, A Bat pattern in making?Although its too early to say, but there's a potential bat pattern in making, lets see how it goes.

Its time to DJI to take a dive!!!A very nice bearish harmonic near a probably resistance area, after a long run up, I'm expecting DJI to take a bit of cool off and retrace at least 38.2% of the move.

33300 may be a resistance going forwardIf 33300 is not broken on the upside then we may head towards 28000 levels

Dow Jones 30700 to 30915 is a crucial range for next few daysDow Jones: 30700 to 30915 is a crucial range for today and next few sessions. The market is trapped in the range. We had a brief jump over 30915 in the first hour. If we see a breakout over this range, we can expect an up move.


DJIDJI CMP 30425
A possible wave structure I'm seeing in DJI ...
Blue line is where max it should go ...
and one possible high being on cards ....
Just a view!
Vedang :)

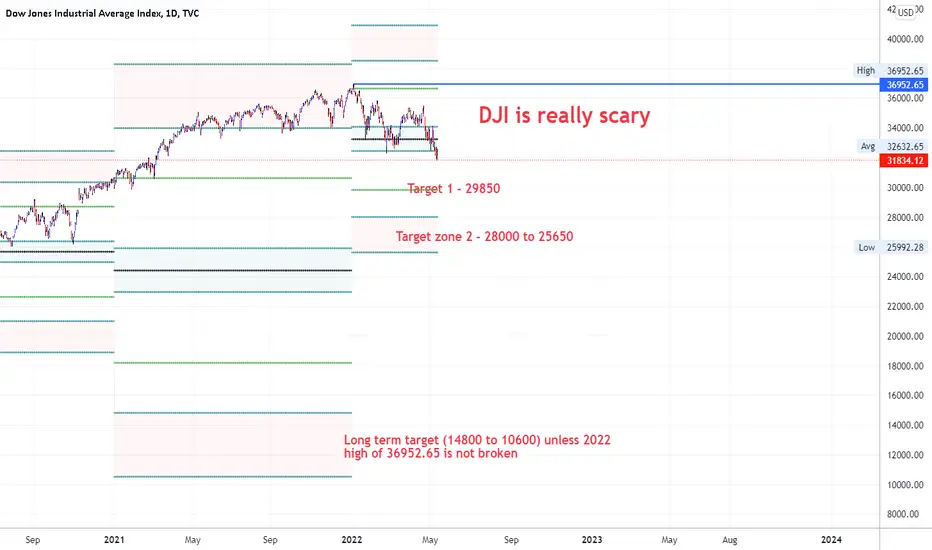
DJI is really scary with potential down target of 29850DJI gives a potential dowside target of 29850 unless the top of 2022 is not broken.
BANKNIFTY & NIFTY SUPPORT AND RESISTANCE FOR [16-06-2022]NSE:BANKNIFTY1!
The market has been moving in a range and refusing to break the 33200 support zone multiple times.
the bounce back is expected from this level.
but the downtrend is still intact unless it breaks any swing high and forms a higher low.
please find necessary support and resistance on the chart.
NSE:NIFTY
nifty major support 15650 tested multiple times and rebounded.
sgx nifty signalling a positive start today any long should be only above 15900- 15950.
happy trading , keep learning

SPYEntry into bear market ! Last expected to 3396 Gann fan and fibo on monthly are way fully in short!!
