WIPRO 1D Time frameCurrent Price: WIPRO is trading near the 520 – 525 zone (recent levels).
Current Trend: Stock is moving sideways after a sharp move earlier, showing consolidation.
Support Zone: Strong support at 510 – 515. Buyers likely to defend this area.
Resistance Zone: Key resistance around 530 – 535. A breakout above 535 can lead to upward momentum.
Indicators: Daily candles indicate indecision; volumes are stable, showing accumulation at lower levels.
Outlook:
Above 535 → bullish momentum possible toward 550+.
Below 510 → weakness may extend toward 495.
👉 In short:
Range: 510 – 535.
Neutral to bullish tone if it breaks above resistance.
DLF
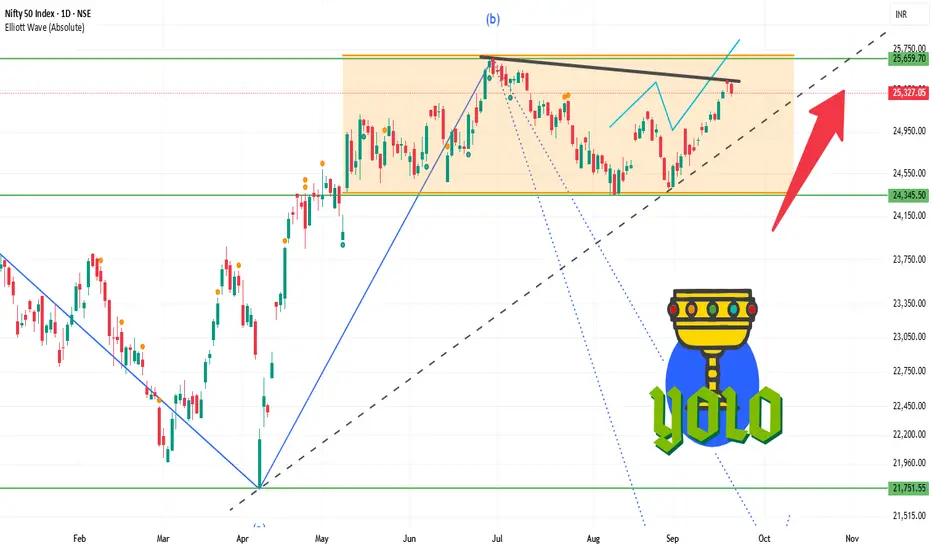
NIFTY 1D Time frameCurrent Trend: Market is moving sideways with limited momentum.
Support Zone: Strong support is around 25,200 – 25,250; bounce is possible from here.
Resistance Zone: If NIFTY sustains above 25,350 – 25,400, fresh upward momentum may come.
Indicators: Daily candle shows buyers are slightly in control, but resistance breakout is important.
Outlook: As long as NIFTY holds above 25,200, the uptrend remains safe. A close above 25,400 can trigger new buying.
👉 In short:
Sideways to bullish tone.
Weakness below 25,200, strength above 25,400.
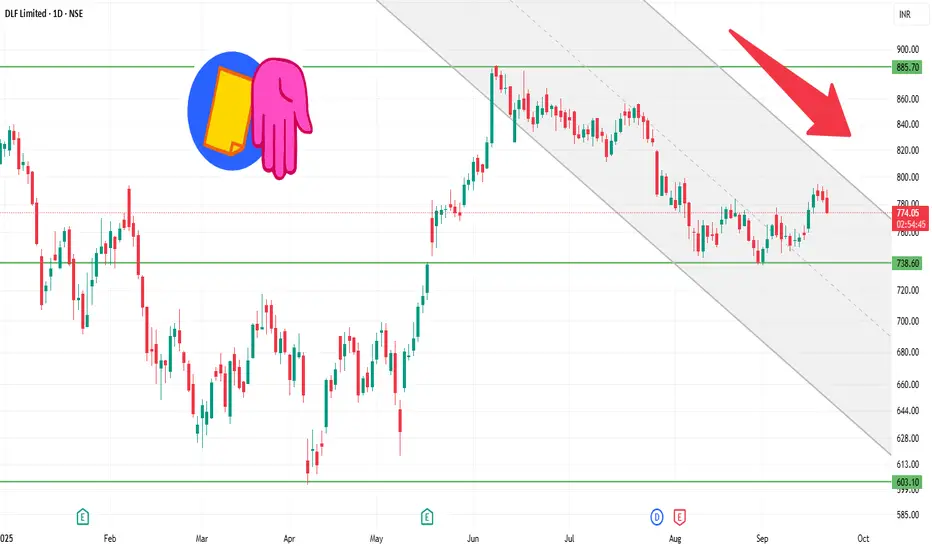
DLF 1D Time frameCurrent
Price: ₹783.10 (as of last close)
52-Week Range: ₹601.20 – ₹929.00
Market Cap: ₹1.94 lakh crore
P/E Ratio: 43.26 (lower than sector average)
EPS (TTM): ₹18.12
Dividend Yield: 0.77%
Debt-to-Equity: 0.10 (very low)
ROE: 10.76%
ROCE: 6.51%
⚙️ Technical Indicators
RSI (14-day): 56.38 — Neutral to slightly bullish.
MACD: 4.28 — Positive, supporting bullish momentum.
Moving Averages: Trading above both 50-day and 200-day EMAs, indicating a long-term uptrend.
Trend Rating: Strong Buy, according to daily technical analysis.
📈 Short-Term Outlook
Bullish Scenario:
Entry: Above ₹800 with strong volume.
Targets: ₹820–₹825, ₹840–₹850.
Stop Loss: ₹780.
Bearish Scenario:
Entry: Below ₹780 with confirmation.
Targets: ₹760–₹765, ₹740–₹745.
Stop Loss: ₹800.
⚠️ Risks
Breakdown below ₹780: Could lead to a short-term correction toward ₹760–₹765.
Failure to break above ₹800: May result in consolidation or minor pullback.
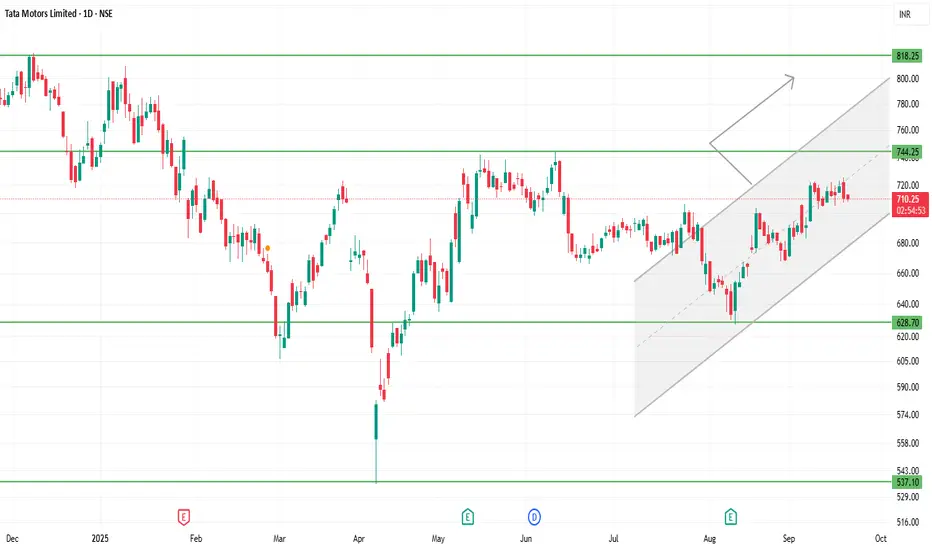
TATAMOTORS 1D Time frameTata Motors is trading around ₹710-₹720 (give or take).
The 52-week high is roughly ₹1,000+, and the 52-week low is approx ₹535-₹550.
There is visible investor concern: production halts (especially in JLR, its luxury arm) and demand pressures are weighing.
Recent performance is mixed; some short-term strength, but many indicators suggest resistance and caution.
⚙️ Technical / Trend Insights
The trend shows a mildly bullish bias in the short-term: price action is forming higher lows (e.g. holding above ₹700-705) which suggests buyers are defending downside.
Resistance zones are limiting gains: repeated attempts to push above ~₹720-725 have met selling.
Momentum indicators (RSI, MACD etc.) are positive but not deeply overbought — there’s room, but risk of pullbacks if resistance holds.
There are hints of bullish chart patterns (for example, ascending structures or potential reversal formations) if price manages to cross certain resistance levels.
⚠️ Risks / Things That Could Go Wrong
If it breaks down below ₹700-705, risk increases toward lower support in the ₹686-₹700 band.
Failure to break above ₹720-₹725 with decent volume could lead to sideways trading or minor corrections.
Macro / sectoral headwinds — demand issues, international business (JLR), cost pressures — could press down on fundamentals.
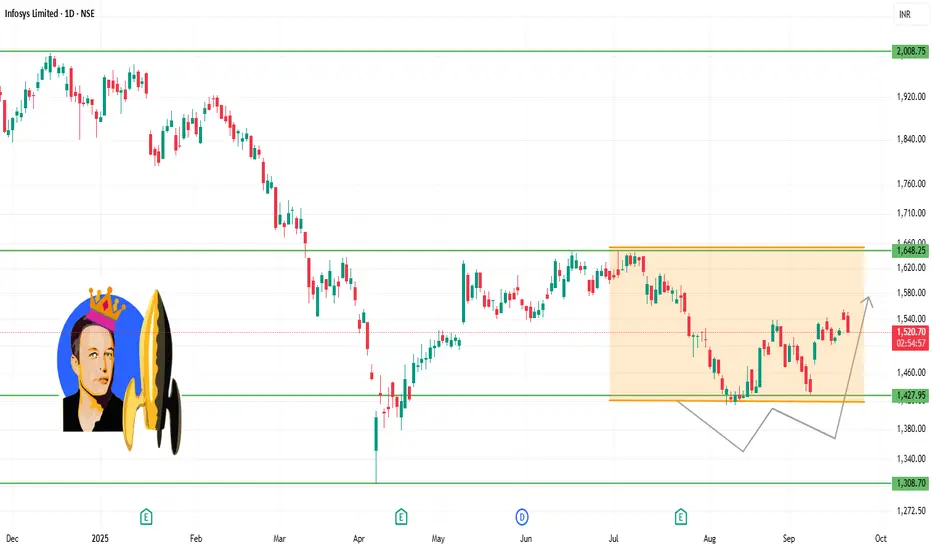
INFY 1D Time frameCurrent Facts
INFY is trading around ₹1,525-₹1,530.
Recent high / resistance being tested around ₹1,540-₹1,550.
The stock has a 52-week low around ₹1,307 and a high near ₹2,006.
Technical momentum is neutral to mildly bullish. Indicators like MACD are positive but RSI is not yet overbought.
🔍 Key Support & Resistance Levels
Immediate Support: ~ ₹1,500-₹1,510 — this is the level to watch closely. If INFY remains above this, it helps maintain bullish bias.
Secondary Support: ~ ₹1,470-₹1,490, in case the nearer support fails.
Immediate Resistance: ~ ₹1,540-₹1,550 — price is facing supply pressure here.
Stronger Resistance: ~ ₹1,560-₹1,570 if INFY manages to break above the nearer resistance.
⚙️ Interpretation & Outlook
As long as INFY stays above the ~₹1,500 support, bulls have a chance to push toward resistance.
Selling pressure is visible near the resistance zone; repeated failures at that zone could lead to consolidation or a pullback.
If INFY breaks above ₹1,550 with strong volume, the upside may extend toward ~₹1,560-₹1,570 and beyond.
⚠️ Risk Points
Breakdown below ₹1,500 may drag INFY toward the ~₹1,470-₹1,490 support.
If that too fails, deeper weakness may set in, possibly toward lower zones depending on market sentiment.
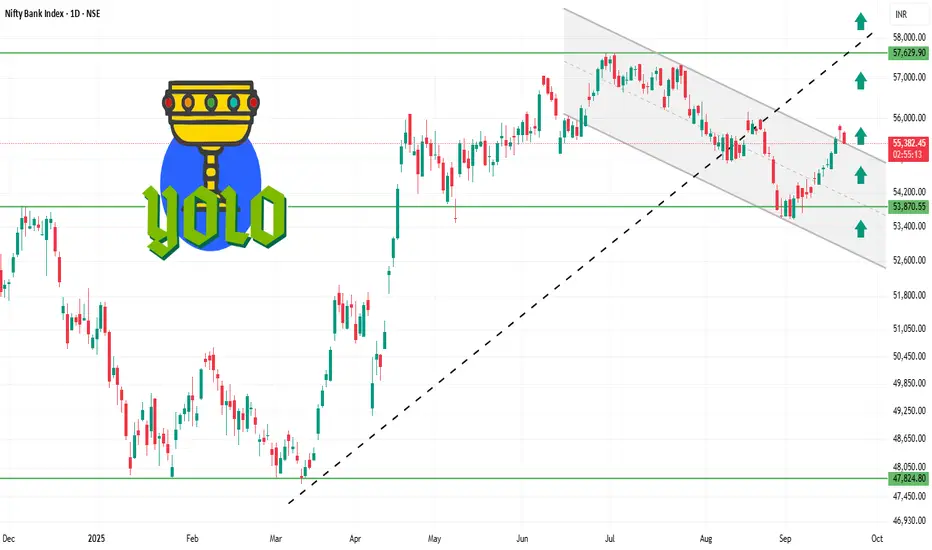
BANKNIFTY 1D Time frame✅ Current Facts
Current Level: ~ 55,400 – 55,480
Trend: Mildly bullish; trading above short-term moving averages (20-day & 50-day EMA).
Momentum Indicators:
RSI (14-day): ~61 → bullish but not overbought.
MACD: Positive → supporting the upward trend.
Price Action: Daily candles show small upper wicks → minor profit-taking near resistance.
⚙️ Outlook
Bullish Scenario:
Holding above 55,350 → retest 55,550–55,600 and possibly 55,700–55,750.
Range / Consolidation:
Price oscillates between 55,350 – 55,550 → sideways trading likely.
Bearish Scenario:
Close below 55,350 → downside risk toward 55,150–55,200 or lower.
⚠️ Key Facts
55,400 – 55,500 is acting as a short-term pivot: above it favors bulls, below it favors bears.
Resistance at 55,550–55,600 is the first hurdle; breakout here can lead to further upside.
Support at 55,300–55,350 is critical; failing to hold may lead to short-term correction.
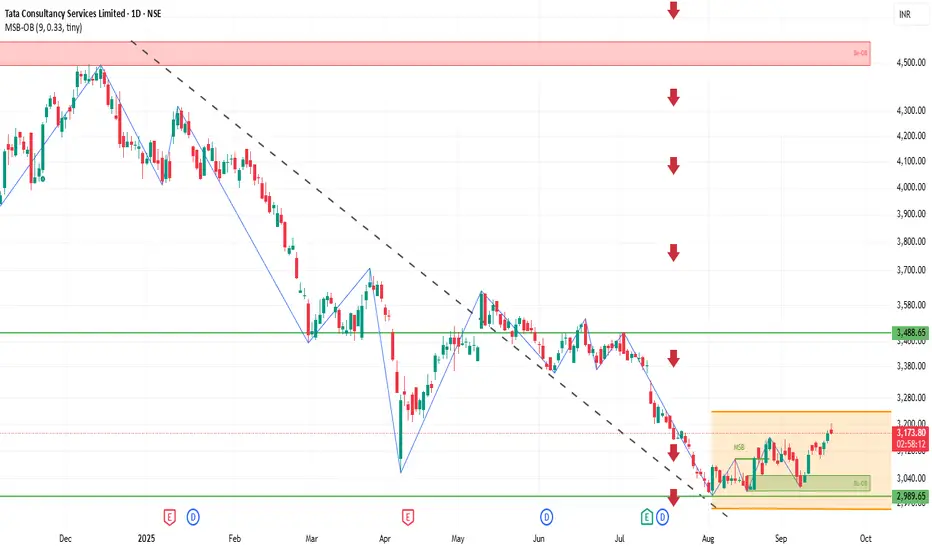
TCS 1D Time frameCurrent Snapshot
Price: ₹3,174
Stock has moved above earlier resistance zones (₹3,150 – ₹3,170).
Momentum looks positive, buyers are holding strength.
📌 Key Levels
Immediate Resistance: ₹3,190 – ₹3,200
Next Resistance: ₹3,220 – ₹3,250
Immediate Support: ₹3,150 – ₹3,160
Stronger Support: ₹3,100 – ₹3,120
✅ Outlook
If TCS sustains above ₹3,170, it can extend the rally toward ₹3,200 – ₹3,220.
If it slips back below ₹3,160, consolidation may happen around ₹3,120 – ₹3,150.
Larger trend remains bullish as long as price stays above ₹3,100.
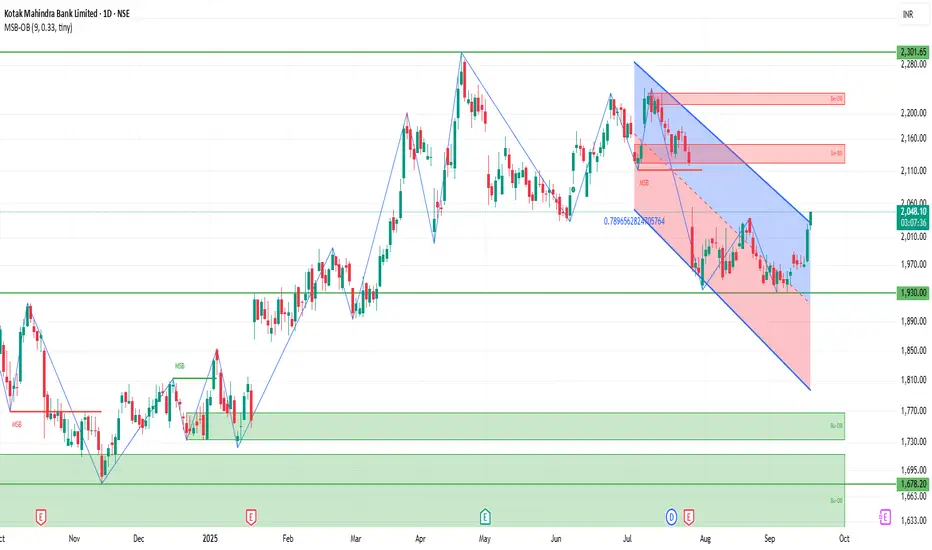
KOTAKBANK 1D Time frameCurrent Stock Price
Current Price: ₹2,045.60
Day’s Range: ₹2,020.30 – ₹2,045.60
52-Week Range: ₹1,679.05 – ₹2,301.90
Market Cap: ₹4.05 lakh crore
P/E Ratio (TTM): 20.47
EPS (TTM): ₹96.30
Dividend Yield: 0.12%
Book Value: ₹740.29
📈 Trend & Outlook
Short-Term Trend: Bullish; the stock is trading above key support levels and showing positive momentum.
Resistance Levels: ₹2,045.60 (day’s high), ₹2,301.90 (52-week high).
Support Levels: ₹2,020.30 (day’s low), ₹2,000.00 (psychological support).
Investor Sentiment: Positive, with strong institutional interest and favorable analyst outlooks.
🧭 Analyst Insights
Valuation: The stock is trading at a P/E ratio of 20.47, which is slightly above the sector average of 19.82, indicating a premium valuation.
Growth Prospects: The bank's strong earnings growth and robust capital position support its premium valuation.
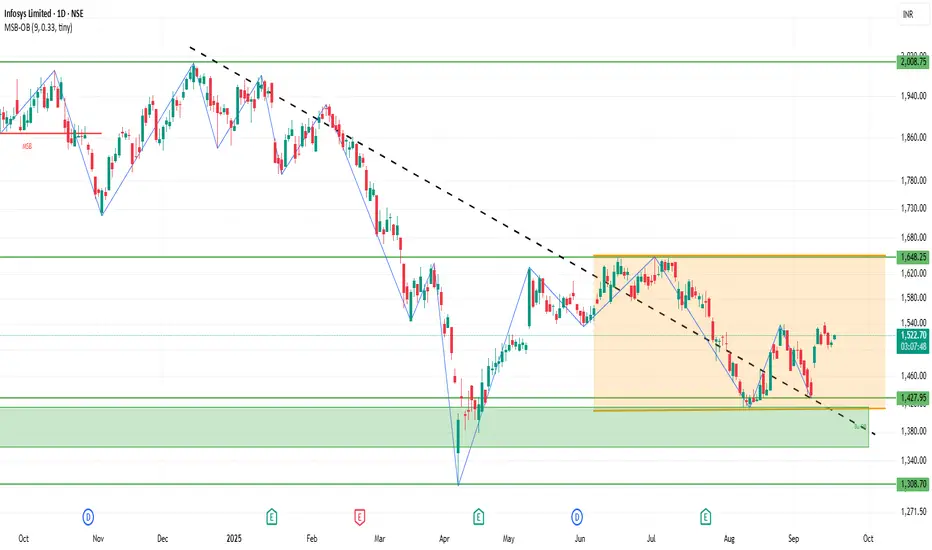
INFY 1D Time frameCurrent Stock Price
Current Price: ₹1,525.60
Day’s Range: ₹1,521.10 – ₹1,542.90
52-Week Range: ₹1,307.00 – ₹2,006.45
Market Cap: ₹6.33 lakh crore
P/E Ratio (TTM): 23.0
EPS (TTM): ₹65.63
Dividend Yield: 2.82%
Book Value: ₹230.65
📈 Trend & Outlook
Short-Term Trend: Bullish; the stock is trading near its 52-week high, indicating strong investor confidence.
Resistance Levels: ₹1,542.90 (day’s high), ₹2,006.45 (52-week high).
Support Levels: ₹1,521.10 (day’s low), ₹1,500.00 (psychological support).
Investor Sentiment: Positive, with strong institutional interest and favorable analyst outlooks.
🧭 Analyst Insights
Valuation: The stock is trading at a P/E ratio of 23.0, which is below the sector average of 28.56, suggesting potential value.
Growth Prospects: The company’s strong earnings growth and robust capital position support its premium valuation.
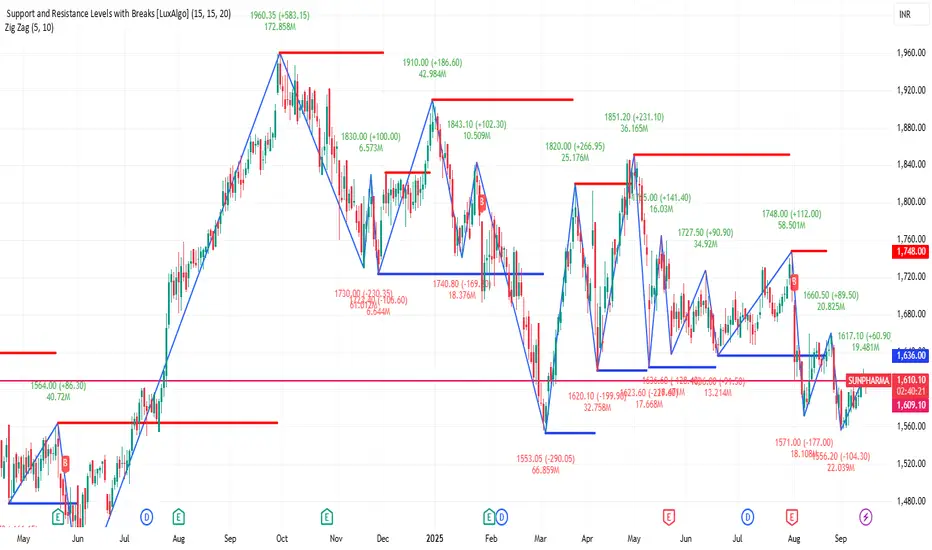
SUNPHARMA 1D Time frameUpdated Snapshot
Current Price: ₹1,607
Day’s Range: ₹1,595 – ₹1,617
Previous Close: ₹1,610
🔹 Support & Resistance
Immediate Support (S1): ₹1,600 – ₹1,595
Next Support (S2): ₹1,585 – ₹1,580
Immediate Resistance (R1): ₹1,615 – ₹1,617
Next Resistance (R2): ₹1,630 – ₹1,635
ANGELONE 1D Time frameCurrent Price: ₹2,238 – ₹2,240
Day’s Range: ₹2,212.60 – ₹2,274
Previous Close: ₹2,222.30
🔹 Support & Resistance
Support 1: ₹2,220 – ₹2,215
Support 2: ₹2,200 – ₹2,180
Resistance 1: ₹2,250 – ₹2,260
Resistance 2: ₹2,270 – ₹2,280

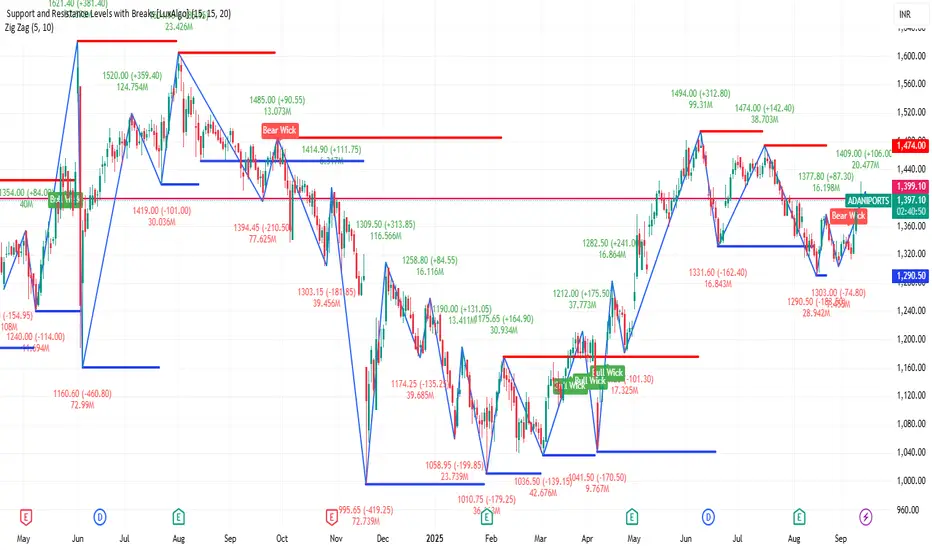
ADANIPORTS 1D Time frameUpdated Snapshot
Current Price: ₹1,399
Day’s Range: ₹1,391 – ₹1,406.50
Previous Close: ₹1,393.10
🔹 Support & Resistance
Support 1: ₹1,391 – ₹1,385
Support 2: ₹1,370 – ₹1,360
Resistance 1: ₹1,406 – ₹1,410
Resistance 2: ₹1,420 – ₹1,430
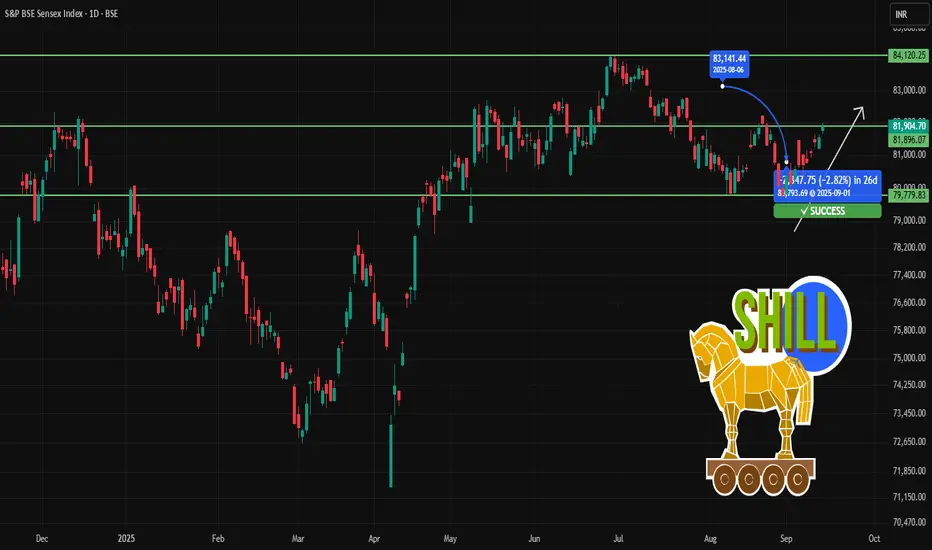
SENSEX 1D Time frameCurrent Price & Trend
Current Level: 81,904
Trend: Neutral to bullish — trading near the upper part of its 52-week range (71,425 – 85,978).
Momentum: Stable; holding above key supports.
Bullish Scenario
If Sensex holds above ~ 81,900 and breaks past ~ 82,200 with conviction, upside toward 82,400-82,600 looks possible
Sustained strength and positive sentiment (especially from financials, tech etc.) can drive moves higher.
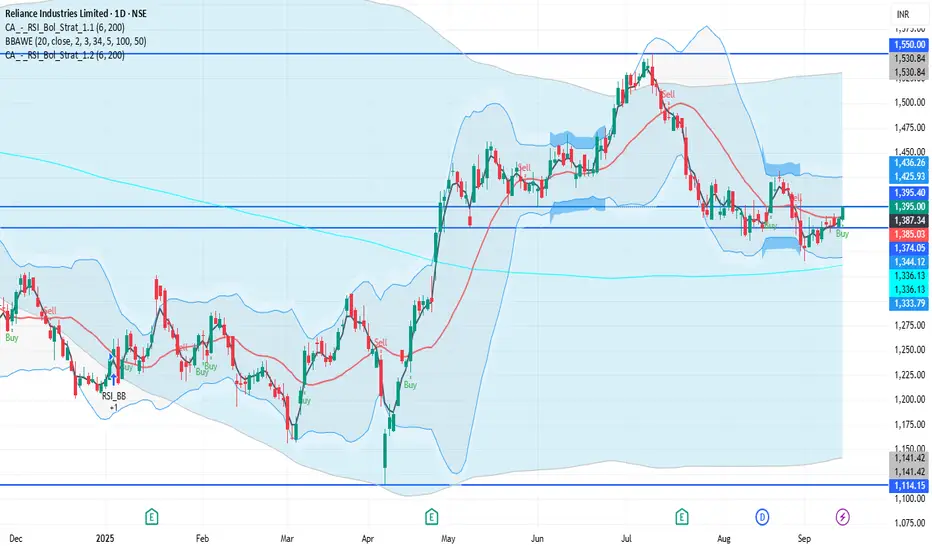
RELIANCE 1D Time frameCurrent Price & Trend
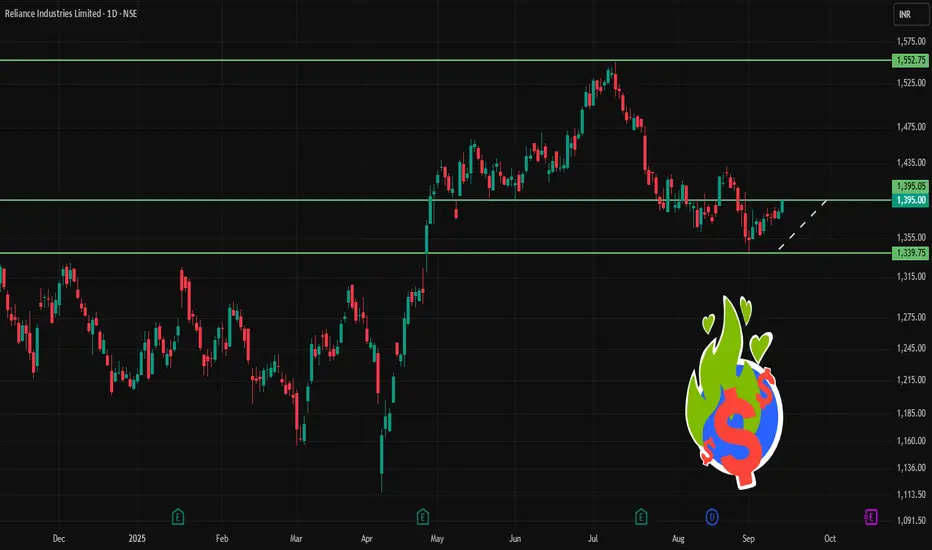
Price: ₹1,395.00
Trend: Neutral to mildly bullish; trading approximately 10.1% below its 52-week high of ₹1,551.00, achieved on July 9, 2025.
Momentum: Indicators suggest a neutral to slightly bullish outlook.
Bullish Scenario
Breakout Above ₹1,396: A sustained move above ₹1,396 could target ₹1,400 – ₹1,420 in the short term.
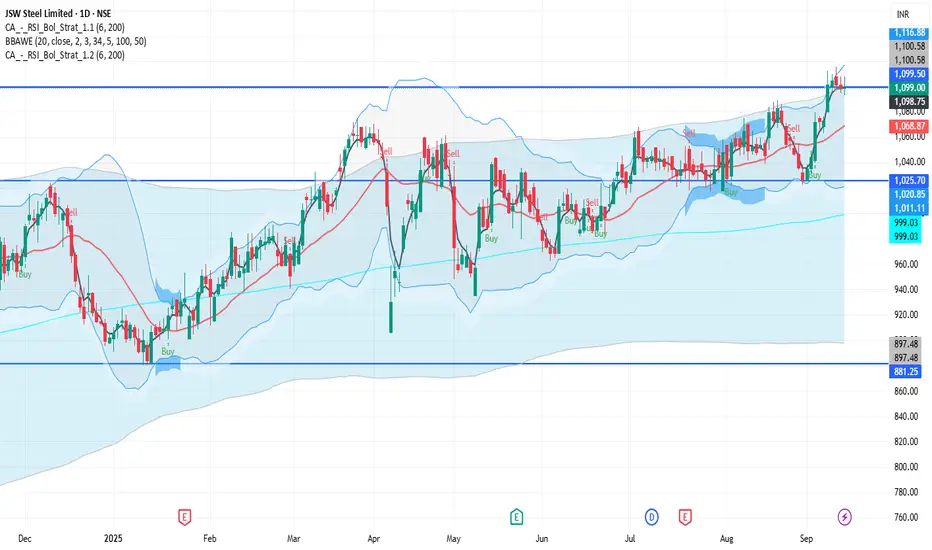
JSWSTEEL 1D Time frameCurrent Price & Trend
Price: ₹1,099.00
Trend: Neutral to mildly bullish; trading near the upper end of its 52-week range (₹880.00 – ₹1,115.50).
Momentum: Indicators suggest a neutral to slightly bullish outlook.
Bullish Scenario
Breakout Above ₹1,115: A sustained move above ₹1,115 could target ₹1,130 – ₹1,135 in the short term.
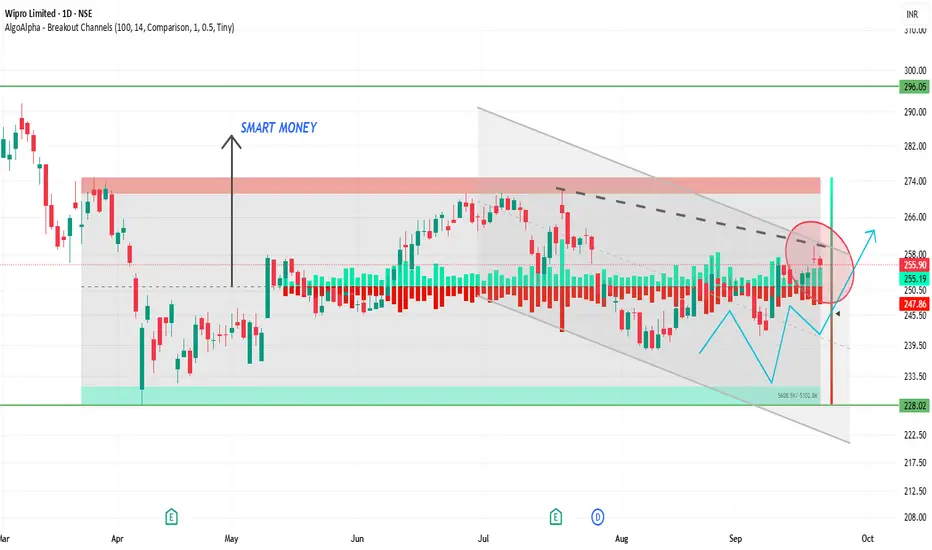
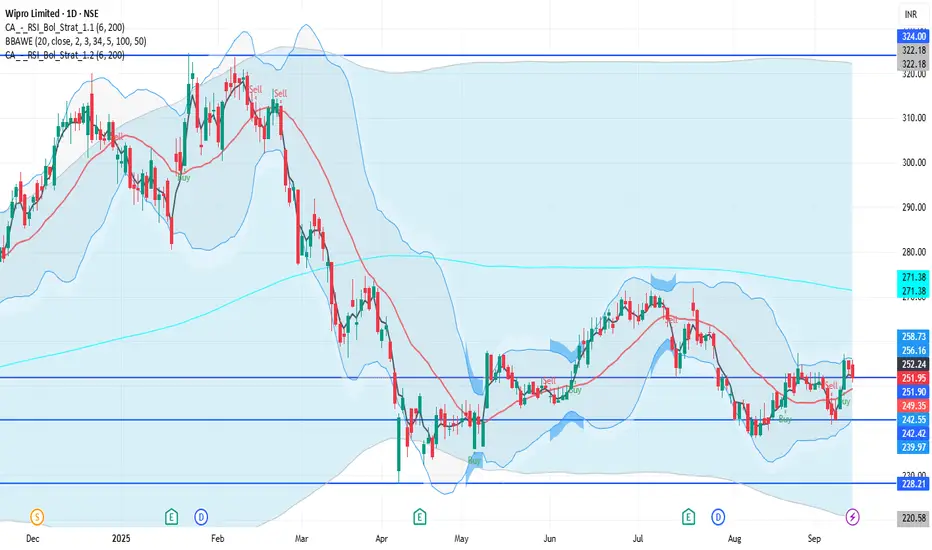
WIPRO 1D Time frameCurrent Price & Trend
Price: ₹251.95
Trend: Neutral; trading approximately 22.5% below its 52-week high of ₹324.60, reached on July 2, 2025.
Momentum: Indicators suggest a neutral to slightly bearish outlook.
Bullish Scenario
Breakout Above ₹257: A sustained move above ₹257 could target ₹265 – ₹270 in the short term.
RELIANCE 1D Time frameClosing Price: ₹1,395.00
Day's Range: ₹1,380.50 – ₹1,396.30
52-Week High: ₹1,551.00
52-Week Low: ₹1,114.85
Market Cap: ₹18,87,780 crore
P/E Ratio (TTM): 25.30
Dividend Yield: 0.85%
Book Value: ₹1,100.00
EPS (TTM): ₹55.00
Face Value: ₹10.00
Volume: 7.4 million shares
VWAP: ₹1,388.40
BAJFINANCE 1D Time frame📉 Current Market Snapshot
Current Price: ₹1,003.25
Previous Close: ₹970.25
Day's Range: ₹970.85 – ₹1,004.60
52-Week High: ₹1,004.60
52-Week Low: ₹645.10
Market Cap: ₹6,24,270 crore
P/E Ratio: 35.8
Book Value: ₹156
Dividend Yield: 0.44%
ROE: 19.2%
Debt-to-Equity Ratio: 3.74
Beta: 1.01
EPS (TTM): ₹28.00
Face Value: ₹1.00

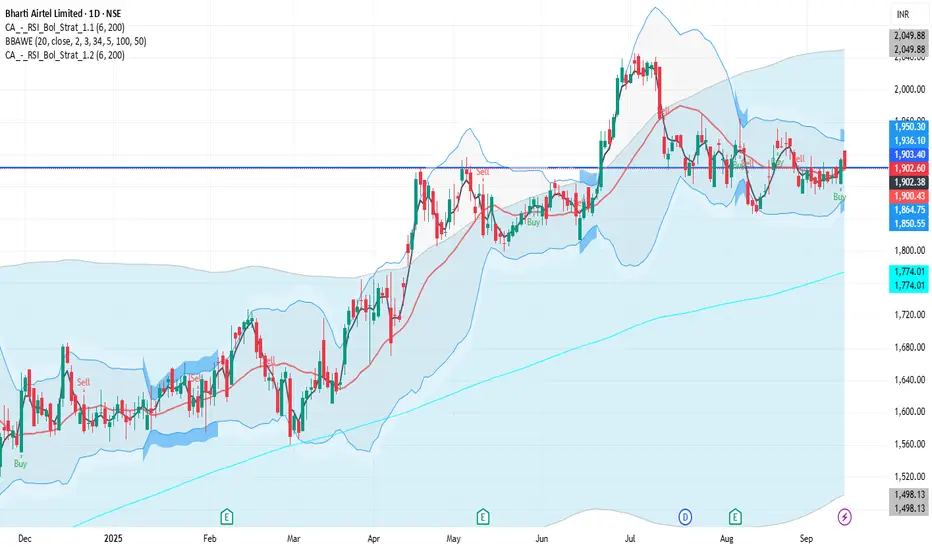
BHARTIARTL 1D Time frame📉 Current Market Snapshot
Previous Close: ₹1,902.00
Day's Range: ₹1,901.60 – ₹1,925.00
52-Week High: ₹2,045.80
52-Week Low: ₹1,511.00
Market Cap: ₹11.03 lakh crore
P/E Ratio: 30.72
Dividend Yield: ~0.81%
ROE: 23.80%
Debt-to-Equity Ratio: 1.88
Beta: 0.94
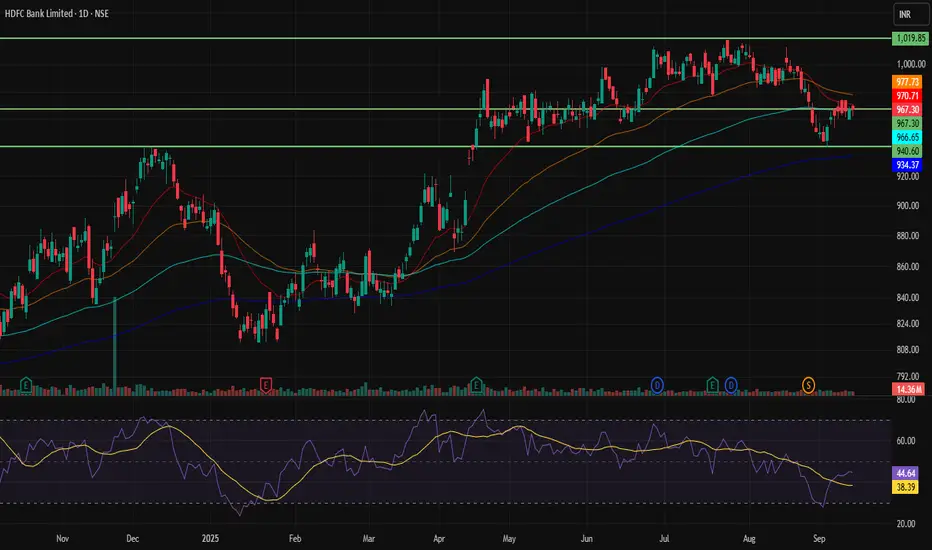
HDFCBANK 1D Time frame🔢 Current Level
Trading around ₹967
🔑 Key Resistance & Support Levels
Resistance Zones:
~ ₹970 – ₹975 (near-term resistance)
~ ₹980 – ₹985 (stronger resistance zone if it moves past the first)
Support Zones:
~ ₹962 – ₹960 (immediate support)
~ ₹955 – ₹950 (short-term support)
~ ₹945 – ₹940 (deeper support if price falls further)
📉 Outlook
Bullish Scenario: If HDFCBANK holds above ₹970 and clears resistance around ₹975, it may aim for ₹980+.
Bearish Scenario: If it drops below ₹960, it could test support in the ₹950-₹940 region.
Neutral / Range: Likely to trade sideways between ₹960-₹975 unless there’s a strong breakout or breakdown.
SBIN 1D Time frame🔢 Current Level
Trading around ₹823.65
🔑 Key Resistance & Support Levels
Resistance Zones:
₹825.00 – ₹830.00 (recent highs; breakout above this may lead to further upside)
₹835.00 – ₹840.00 (stronger resistance above)
Support Zones:
₹815.00 – ₹820.00 (immediate support; failure to hold above this may lead to a decline)
₹810.00 – ₹815.00 (short-term support; a break below this could indicate weakness)
₹800.00 – ₹805.00 (deeper support zone if price dips further)
📉 Outlook
Bullish Scenario: If SBIN holds above ₹820.00, upward momentum may continue. Break above ₹830.00 can open the way toward ₹840.00+.
Bearish Scenario: If it falls below ₹800.00, risk increases toward ₹790.00 – ₹795.00.
Neutral / Range: Between ₹820.00 – ₹830.00, SBIN may consolidate before a directional move.

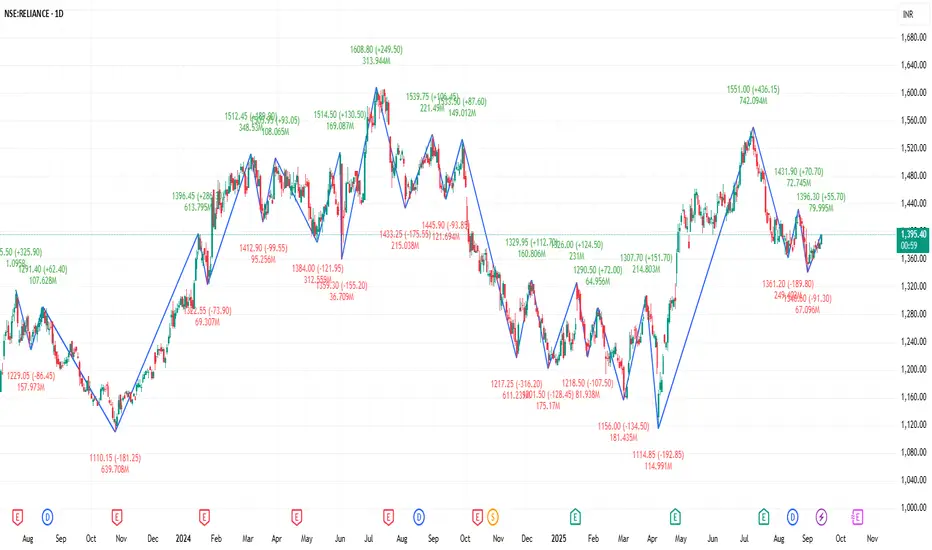
RELIANCE 1D Time frame🔢 Current Level
Trading around ₹1,393 - ₹1,395
🔑 Key Resistance & Support Levels
Resistance Zones:
~ ₹1,400 – ₹1,431 (immediate resistance band)
~ ₹1,440 – ₹1,460 (higher resistance if momentum continues)
Support Zones:
~ ₹1,380 – ₹1,370 (short-term support)
~ ₹1,360 (important support below)
📉 Outlook
Bullish Scenario: Holding above ₹1,400 and breaking past ₹1,431 can open the path toward ₹1,440–₹1,460.
Bearish Scenario: A fall below ₹1,370–₹1,360 increases risk of deeper decline.
Neutral / Range: Between ₹1,360–₹1,431, Reliance may move sideways until a clear breakout happens.
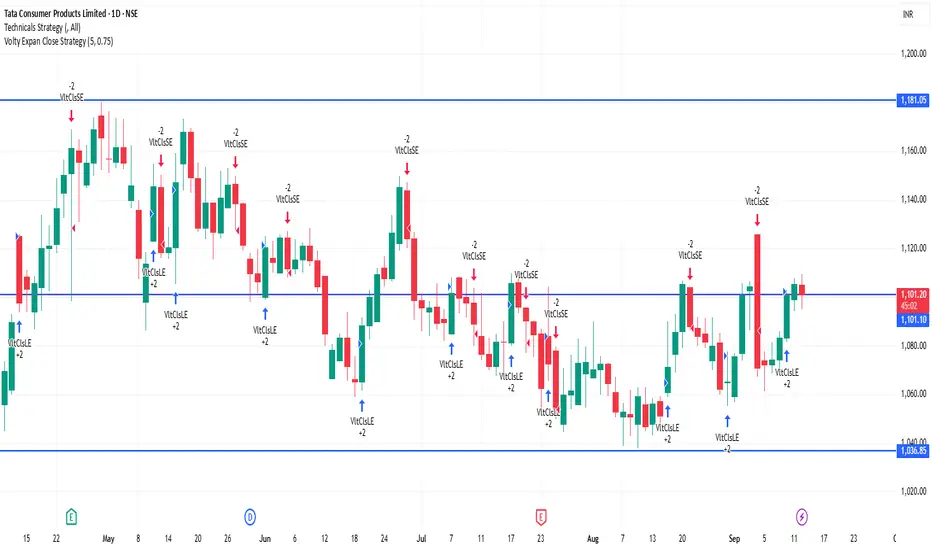
TATACONSUM 1D Time frame🔢 Current Level
Trading around ₹1,101.30
🔑 Key Resistance & Support Levels
Resistance Zones:
₹1,110 – ₹1,115 (recent highs; breakout above this may lead to further upside)
₹1,120 (psychological resistance)
₹1,130 – ₹1,140 (stronger resistance above)
Support Zones:
₹1,095 – ₹1,100 (immediate support; failure to hold above this may lead to a decline)
₹1,085 – ₹1,090 (short-term support; a break below this could indicate weakness)
₹1,070 – ₹1,080 (deeper support zone if price dips further)
📉 Outlook
Bullish Scenario: If Tata Consumer holds above ₹1,100, upward momentum may continue. Break above ₹1,115 can open the way toward ₹1,120+.
Bearish Scenario: If it falls below ₹1,085, risk increases toward ₹1,070 – ₹1,080.
Neutral / Range: Between ₹1,100 – ₹1,115, Tata Consumer may consolidate before a directional move.