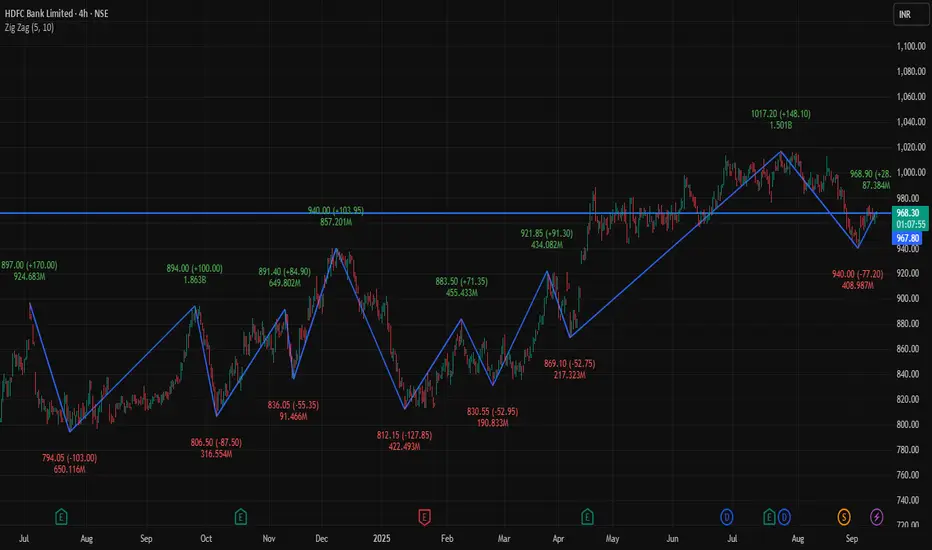
HDFCBANK 4Hour Time frame 📊 Current Snapshot
Current Price: ₹967.95
Day’s Range: ₹959.90 – ₹968.90
Previous Close: ₹965.90
Opening Price (4H): ₹960.30
Volume: Approximately 7.2 million shares
📈 Trend & Indicators
Trend: Neutral to mildly bullish; trading near short-term resistance.
RSI (14): Neutral zone.
MACD: Positive → indicating mild bullish momentum.
Moving Averages: Short-term averages indicate neutral to slightly bullish outlook.
🔮 Outlook
Bullish Scenario: Break above ₹968.90 with strong volume could target ₹975.00.
Bearish Scenario: Drop below ₹960.00 may lead to further decline toward ₹950.00.
Neutral Scenario: Consolidation between ₹960.00 – ₹968.90; breakout needed for directional move.
📌 Key Factors to Watch
Economic Indicators: Interest rates, inflation, and RBI policy updates.
Sector Performance: Trends in the banking sector.
Global Cues: Global market trends, US indices, crude oil, and currency movements.
DLF
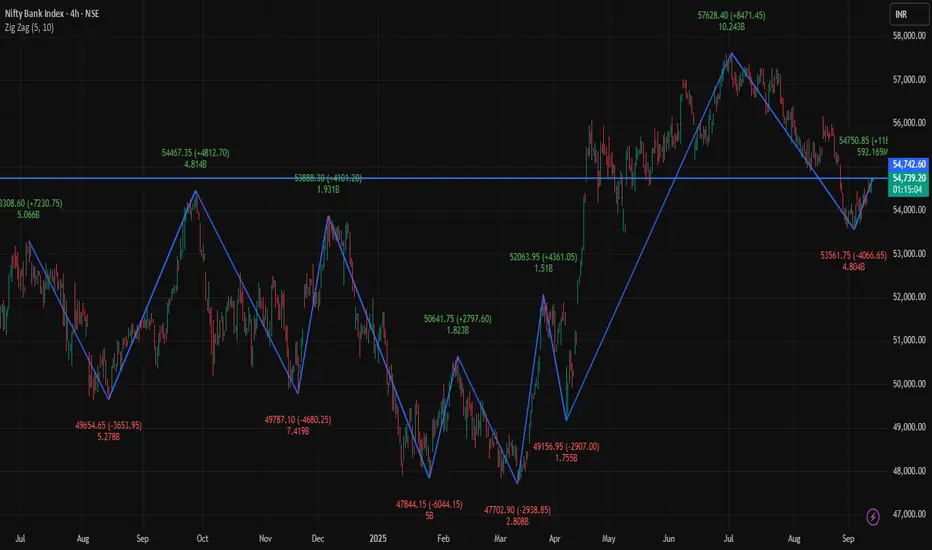
BANKNIFTY 4Hour Time frame📊 Current Snapshot
Current Price: ₹54,731
Day’s Range (4H): ₹54,600 – ₹54,800
Previous Close: ₹54,228
Opening Price (4H): ₹54,350
Volume: Moderate
🔑 Key Support & Resistance Levels
Immediate Support: ₹54,650
Next Support: ₹54,600
Immediate Resistance: ₹54,800
Next Resistance: ₹54,900
📈 Trend & Indicators
Trend: Mildly bullish; trading near short-term resistance.
RSI (14): ~64 – Neutral to slightly bullish.
MACD: Positive → indicates bullish momentum.
Moving Averages: Short-term averages indicate bullish bias.
🔮 Outlook
Bullish Scenario: Sustained move above ₹54,800 may push toward ₹54,900–₹55,000.
Bearish Scenario: Drop below ₹54,650 could lead to retracement toward ₹54,600.
Neutral Scenario: Consolidation between ₹54,650 – ₹54,800; breakout needed for directional move.
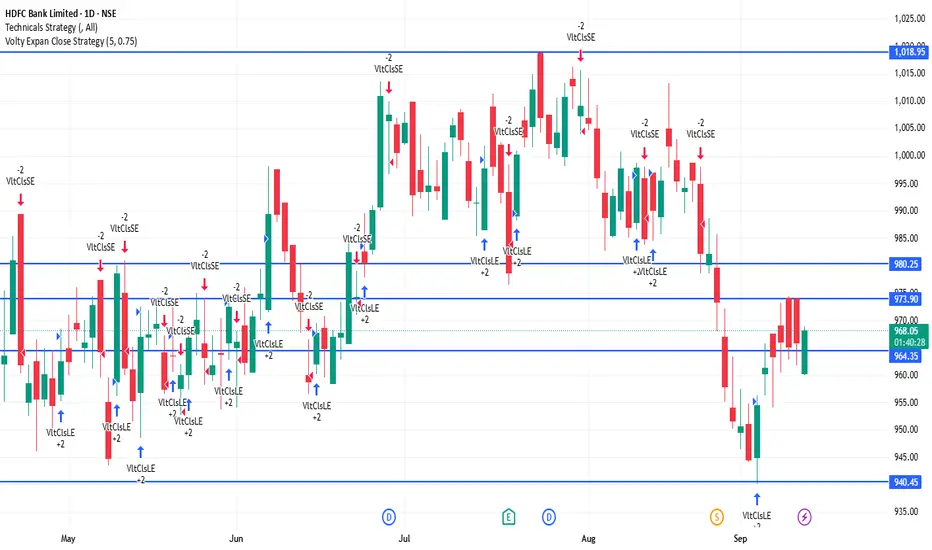
HDFCBANK 1D Time frameCurrent Price Action
HDFCBANK is trading around ₹962–968.
Day’s low is near ₹960 and high is around ₹978.
The stock is consolidating in a tight range.
⚖️ Key Levels
Immediate Resistance: ₹968 – ₹970
Next Resistance: ₹975 – ₹980
Immediate Support: ₹960
Strong Support: ₹950 – ₹955
📊 Indicators
Moving Averages: Price is below the 50-day MA (short-term weakness) but above the 200-day MA (long-term trend still intact).
RSI (14-day): Around 40–45 → neutral to slightly weak momentum.
MACD: Negative bias, showing limited upside strength.
📈 Outlook
If HDFCBANK stays above ₹960, a bounce toward ₹970 – ₹975 is possible.
A breakout above ₹975 – ₹980 could turn the trend stronger.
If the stock slips below ₹955 – ₹950, it may head lower toward ₹940 – ₹935.
Current bias: Neutral to slightly bearish until price breaks above resistance.
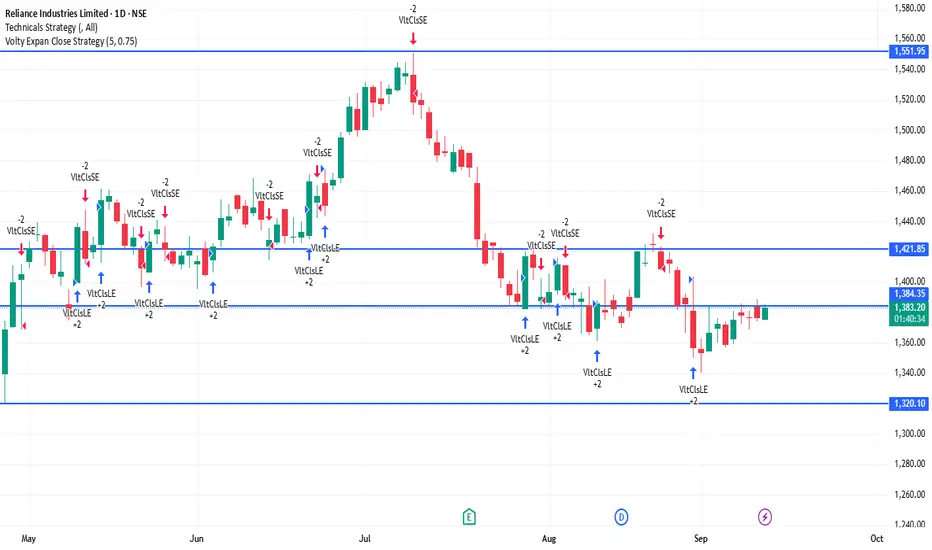
RELIANCE 1D Time frameCurrent Price Action
Reliance is trading around ₹1,384.
Day’s low is near ₹1,375 and high is near ₹1,385.
Price is consolidating in a narrow band after recent gains.
⚖️ Key Levels
Immediate Resistance: ₹1,385 – ₹1,390
Next Resistance: ₹1,400 – ₹1,410
Immediate Support: ₹1,375
Strong Support: ₹1,360 – ₹1,350
📊 Indicators
Moving Averages: Short- and medium-term averages remain bullish, confirming uptrend strength.
RSI (14-day): Around 58–60 → showing bullish momentum, still not overbought.
MACD: Positive crossover → indicates bullish bias.
📈 Outlook
As long as Reliance holds above ₹1,375, the bias stays bullish.
A breakout above ₹1,390 – ₹1,400 can push the stock toward ₹1,410 – ₹1,420.
If it falls below ₹1,375, it could slip toward ₹1,360 – ₹1,350.
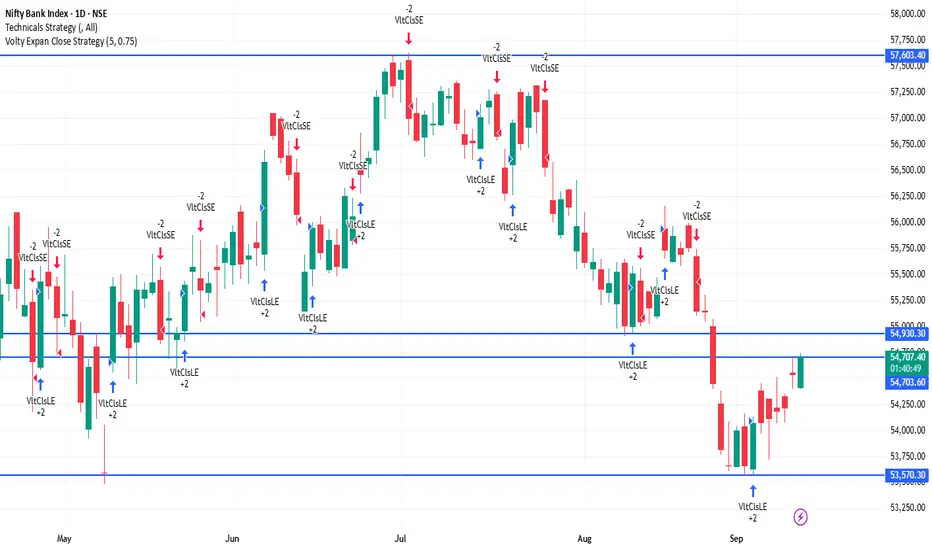
BANKNIFTY 1D Time frame📍 Current Price Action
BankNIFTY is trading around 54,680 – 54,817.
Day’s low is near 54,400, and high is near 54,825.
Index is consolidating near the upper end of the recent range.
⚖️ Key Levels
Immediate Resistance: 54,700 – 55,000
Next Resistance: 55,300 – 55,500
Immediate Support: 54,400
Strong Support: 53,800 – 53,500
📊 Indicators
Moving Averages: Short-, medium-, and long-term averages remain in a bullish alignment → trend still positive.
RSI (14-day): Around 60-65 → showing bullish momentum, but not extreme.
MACD: Still positive, indicating bullish momentum, though strength is flattening.
📈 Outlook
As long as BankNIFTY stays above 54,400, the bias remains bullish to neutral.
A breakout above 55,000 could push the index toward 55,300 – 55,500.
A breakdown below 54,400 could trigger a slide toward 53,800 – 53,500.
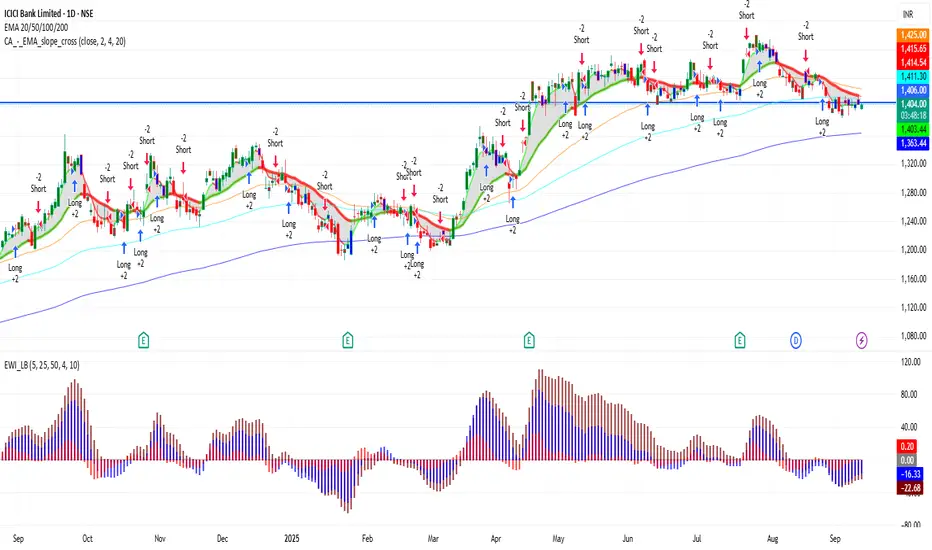
ICICIBANK 1D Time frame📊 Current Snapshot
Current Price: ₹1,406.10
Day’s Range: ₹1,402.00 – ₹1,416.35
52-Week Range: ₹1,186.00 – ₹1,500.00
Previous Close: ₹1,403.90
Opening Price: ₹1,403.70
Market Cap: ₹10.02 lakh crore
Volume: ~81.3 lakh shares
📈 Trend & Indicators
Trend: Neutral to mildly bullish; trading near 50-day and 200-day moving averages.
RSI (14): 60 – Neutral; no immediate overbought or oversold conditions.
MACD: Positive → indicates bullish momentum.
Moving Averages: Short-term moving averages suggest neutral to slightly bullish outlook.
🔮 Outlook
Bullish Scenario: Break above ₹1,416 with strong volume could target ₹1,450.
Bearish Scenario: Drop below ₹1,400 may lead to further decline toward ₹1,375.
Neutral Scenario: Consolidation between ₹1,400 – ₹1,416; breakout needed for directional move.
📌 Key Factors to Watch
Market Sentiment: Overall market trend and investor behavior.
Economic Indicators: Interest rates, inflation, and RBI policy updates.
Global Cues: Global market trends, US indices, crude oil, and currency movements.
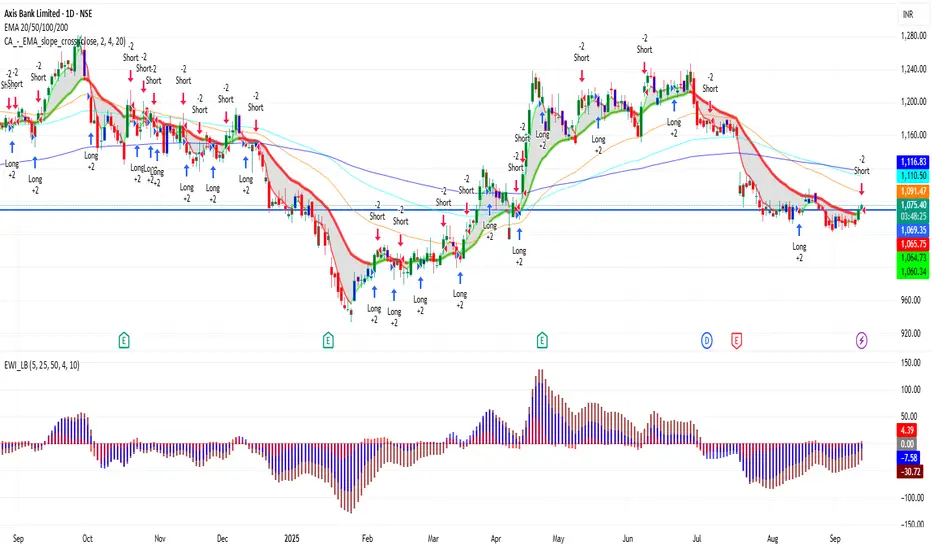
AXISBANK 1D Time frame📊 Current Snapshot
Current Price: ₹1,073.50
Day’s Range: ₹1,069.00 – ₹1,073.20
52-Week Range: ₹934.00 – ₹1,281.75
Previous Close: ₹1,070.10
Opening Price: ₹1,069.00
Market Cap: Approx. ₹3.32 lakh crore
Volume: ~1.65 lakh shares
📈 Trend & Indicators
Trend: Neutral to mildly bullish; trading near 50-day and 200-day moving averages.
RSI (14): 60 – Neutral; no immediate overbought or oversold conditions.
MACD: Positive → indicates bullish momentum.
Moving Averages: Short-term moving averages suggest neutral to slightly bullish outlook.
🔮 Outlook
Bullish Scenario: Break above ₹1,075 with strong volume could target ₹1,090.
Bearish Scenario: Drop below ₹1,065 may lead to further decline toward ₹1,050.
Neutral Scenario: Consolidation between ₹1,065 – ₹1,075; breakout needed for directional move.
📌 Key Factors to Watch
Market Sentiment: Overall market trend and investor behavior.
Economic Indicators: Interest rates, inflation, and RBI policy updates.
Global Cues: Global market trends, US indices, crude oil, and currency movements.
SENSEX 1D Time frame📊 Current Snapshot
Current Price: ₹81,475
Day’s Range: ₹81,235 – ₹81,644
52-Week Range: ₹71,425 – ₹85,978
Previous Close: ₹81,101
Opening Price: ₹81,504
Market Cap: Approx. ₹15.47 lakh crore
Volume: Moderate
🔑 Key Support & Resistance Levels
Immediate Support: ₹81,235
Next Support: ₹81,000
Immediate Resistance: ₹81,644
Next Resistance: ₹82,000
📈 Trend & Indicators
Trend: Neutral to mildly bullish; trading near 50-day and 200-day moving averages.
RSI (14): 60 – Neutral zone.
MACD: Positive → indicating mild bullish momentum.
Moving Averages: Short-term MAs indicate neutral to slightly bullish outlook.
🔮 Outlook
Bullish Scenario: Break above ₹81,644 with strong volume could target ₹82,000.
Bearish Scenario: Drop below ₹81,235 may lead to further decline toward ₹81,000.
Neutral Scenario: Consolidation between ₹81,235 – ₹81,644; breakout needed for directional move.
📌 Key Factors to Watch
Market Sentiment: Overall market trend and investor behavior.
Economic Indicators: Interest rates, inflation, and RBI policy updates.
Global Cues: Global market trends, US indices, crude oil, and currency movements.

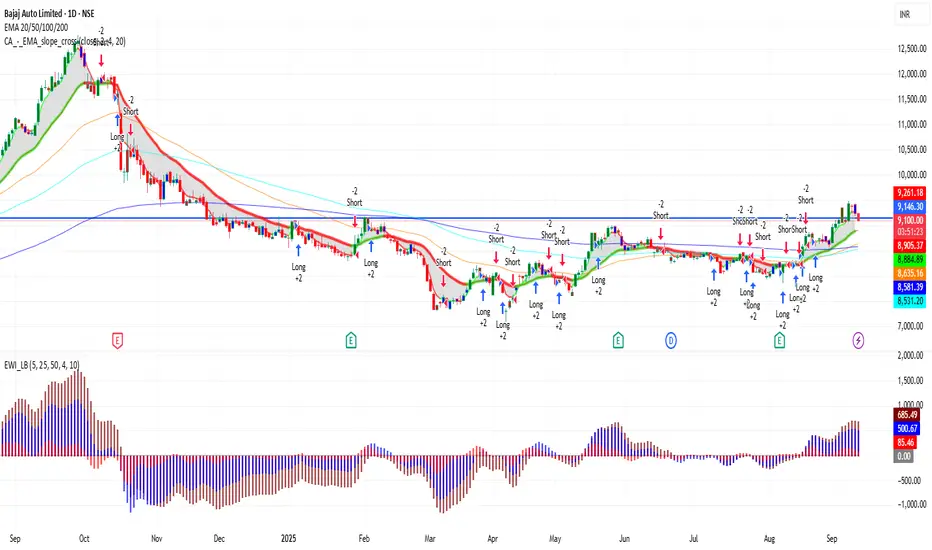
BAJAJ_AUTO 1D Time frame📊 Current Snapshot
Last Traded Price: ₹9,124.00
Day’s Range: ₹9,117.00 – ₹9,244.00
52-Week Range: ₹8,132.50 – ₹9,490.00
Market Cap: ₹2.54 lakh crore
Volume: 236,411 shares
VWAP: ₹9,186.50
📈 Trend & Indicators
Trend: Neutral to mildly bullish; trading above 20-day and 50-day EMAs.
RSI (14): 68.78 – Approaching overbought territory; caution advised.
MACD: Positive at +158.15 – Indicates bullish momentum.
Moving Averages: Short-term MAs indicate a neutral to bullish outlook.
🔮 Outlook
Bullish Scenario: Break above ₹9,244.00 with strong volume could target ₹9,350.00.
Bearish Scenario: Drop below ₹9,117.00 may lead to further decline toward ₹8,900.00.
Neutral Scenario: Consolidation between ₹9,117.00 – ₹9,244.00; breakout needed for directional move.
📌 Key Factors to Watch
Market Sentiment: Broader market movements can influence Bajaj Auto's performance.
Economic Indicators: Changes in interest rates or inflation can impact automotive stocks.
Company News: Any announcements regarding Bajaj Auto's financials or strategic initiatives.
SENSEX 1H Time frameCurrent Snapshot
Sensex Last Price: around 81,425
Intraday High (1H): near 81,580
Intraday Low (1H): around
📈 Trend View (1H)
Above 81,580 → 82,000 = bullish momentum likely.
Below 81,225 → 81,000 = bearish sentiment can increase.
Staying between these = sideways consolidation.
📊 Trend & Bias
Above 81,600–82,000 → bullish breakout, upside momentum likely.
Below 81,000 → bearish pressure, possible drift toward 80,500.
As long as price holds higher lows on 1H candles, trend stays mildly positive.
⚠️ Risk Factors
Sudden global news or domestic policy updates may cause sharp reversals.
If volume is weak during up-moves, breakouts may fail.
Overbought conditions on momentum indicators (RSI/MACD) could slow the rally.

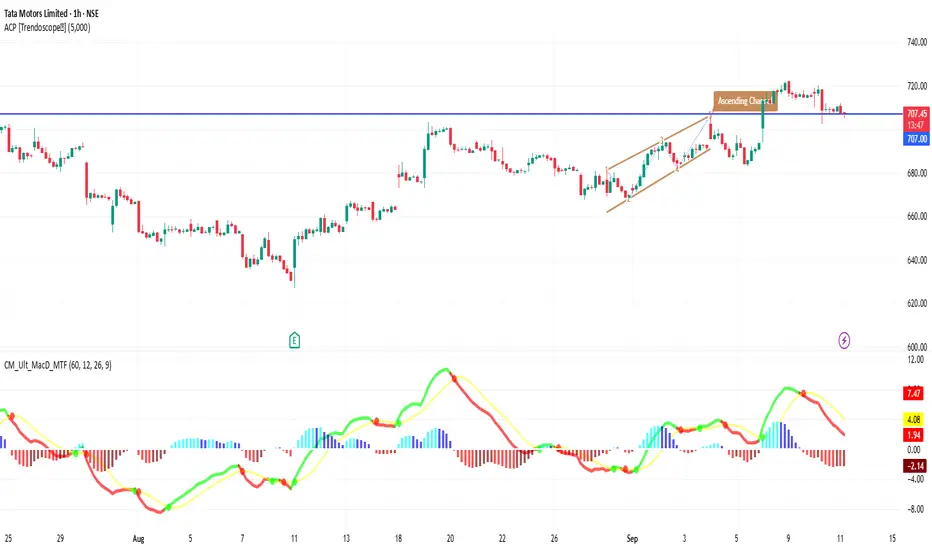
TATAMOTORS 1H Time frameMarket Snapshot
Current Price: ~₹708
Intraday Range: ~₹706 – ₹712
Bias: Sideways to mildly bullish
📈 Moving Averages (1H)
20-hour MA: ~₹707 → acting as short-term support
50-hour MA: ~₹704 → supportive level below
200-hour MA: ~₹699 → strong base, long-term intraday support
All moving averages are aligned above each other → bias is bullish.
🔎 Indicators
RSI (14, hourly): ~59 → Momentum positive, not overbought
MACD (1H): Bullish crossover, showing upward momentum
ADX: ~20 → Trend strength is still weak to moderate
Stochastic: Near overbought → caution for minor pullback
🔧 Key Levels
Support: ₹705 → first support, then ₹700 as stronger base
Resistance: ₹712 → immediate resistance, next at ₹715
🧭 Short-Term Outlook
Bullish Case: Break above ₹712–715 zone could push price toward ₹720+.
Bearish Case: Failure at resistance + RSI overbought may drag it back to ₹705 or even ₹700.
Overall Bias: Slightly bullish, but resistance is close and strong.
Technical Analysis Mastery🧠 What is Technical Analysis?
Technical Analysis (TA) is the skill of analyzing price charts and patterns to predict future movements of stocks, indices, commodities, forex, or cryptocurrencies. It’s like reading the mood and psychology of the market by observing price and volume.
Instead of studying company balance sheets or industry trends (that’s fundamental analysis), technical analysis assumes that everything important is already reflected in the price. It’s used by intraday traders, swing traders, and even investors to make smarter entries and exits.
📚 The Core Principle of Technical Analysis
There are three main beliefs that form the base of technical analysis:
Price Discounts Everything
All news, emotions, expectations, and fundamentals are already priced into the chart. So, instead of worrying about inflation or earnings, a technical analyst looks at price action.
Price Moves in Trends
Markets don’t move randomly. They trend – either up, down, or sideways. TA helps you identify the direction of the trend and when it might be changing.
History Repeats Itself
Market behavior is repetitive because human psychology is repetitive. Fear and greed create familiar patterns. Candlestick patterns, chart patterns, and indicators are all built on this belief.
🧭 Types of Market Trends
To master technical analysis, you need to understand trends first:
📈 Uptrend (Bullish): Higher highs and higher lows.
📉 Downtrend (Bearish): Lower highs and lower lows.
➡️ Sideways (Range-bound): Price moves within a horizontal range.
Your first job as a technical analyst is to identify the current trend. Once you know this, your job becomes easier:
Buy in an uptrend, sell in a downtrend, stay cautious in a sideways market.
📊 Reading Price Charts (The Visual Language)
The chart is your battlefield. Let’s break down the types:
1. Line Chart
Shows the closing price over time.
Clean and simple, but lacks detail.
2. Bar Chart
Shows open, high, low, close (OHLC).
More informative than a line chart.
3. Candlestick Chart (Most Popular)
Shows OHLC in a visually rich format.
Green (or white) candles = price went up.
Red (or black) candles = price went down.
Candlesticks reveal trader emotions and help spot patterns like Doji, Hammer, Engulfing, etc.
🔍 Support & Resistance – The Foundation
Support = A price level where demand is strong enough to stop the price from falling further.
Resistance = A level where selling pressure prevents the price from rising.
Imagine support as a floor and resistance as a ceiling. Once broken, these levels often flip roles (old resistance becomes new support).
Example:
If Nifty keeps bouncing back from 21,000 – it’s a support zone.
If it keeps failing near 22,000 – that’s resistance.
✍️ Chart Patterns – Visual Clues to Price Moves
Chart patterns are shapes formed by price on a chart, often signaling upcoming moves.
✅ Continuation Patterns
Price will likely continue in the same direction.
🔺 Flag & Pennant
🔻 Triangle (Symmetrical, Ascending, Descending)
📦 Rectangle
🔄 Reversal Patterns
Suggests trend may reverse.
👨🦲 Head and Shoulders
🧍♂️ Double Top / Bottom
🛑 Rounding Top / Bottom
These patterns help you plan trades with entry, stop loss, and target.
🧠 Candlestick Patterns – Market Psychology in Action
Candlestick patterns show short-term momentum and emotion.
🔥 Bullish Candles
Hammer: Long wick at bottom – buyers stepping in.
Bullish Engulfing: Green candle swallows previous red one.
Morning Star: A 3-candle reversal pattern.
🧊 Bearish Candles
Shooting Star: Long wick at top – sellers taking over.
Bearish Engulfing: Red candle engulfs previous green one.
Evening Star: Opposite of Morning Star.
Candlestick mastery = understanding buyer vs seller fight in every candle.
🧰 Indicators & Oscillators – Your Technical Tools
Indicators are formulas applied to price data to give more insight.
🛣️ Trend Indicators
Moving Averages (MA):
SMA: Simple Moving Average.
EMA: Exponential (gives more weight to recent price).
Used to identify and confirm trends.
MACD (Moving Average Convergence Divergence):
Measures momentum and crossover signals.
Parabolic SAR:
Gives entry/exit dots on chart.
📉 Momentum Indicators (Oscillators)
RSI (Relative Strength Index):
Measures overbought (>70) or oversold (<30).
Stochastic Oscillator:
Shows momentum, good for spotting reversal zones.
CCI (Commodity Channel Index):
Helps detect cyclical trends.
These are tools to confirm what you see on price action – never trade based on indicators alone.
🧪 Volume – The Fuel Behind Moves
Volume tells you how strong or weak a price move is.
Rising volume + rising price = strong uptrend.
Low volume + breakout = fakeout risk.
Volume spike at support/resistance = possible reversal or breakout.
Smart traders always watch volume with price action. It shows institutional interest.
🧱 Building a Trading Setup (Strategy Framework)
A solid technical trading setup has:
Market Context (Trend, Sentiment)
Entry Trigger (Pattern, Indicator, Breakout)
Stop Loss Level (Support/Resistance, ATR, Swing High/Low)
Target (Risk:Reward ratio, Resistance/Support, Fibonacci)
Volume Confirmation
Risk Management Plan
🧠 Psychological Mastery in TA
Even the best technical setup can fail without the right mindset.
Stick to Plan: Don’t react emotionally.
Accept Losses: TA gives probabilities, not guarantees.
Avoid Overtrading: Quality > Quantity.
Backtest Your Strategies: Practice builds confidence.
Mastering TA is not just about charts – it’s about mastering yourself.
🧪 Advanced Concepts in Technical Analysis
Once you’re comfortable with the basics, explore:
🔁 Fibonacci Retracement & Extensions
📏 Average True Range (ATR) for volatility
📈 Ichimoku Cloud for trend + momentum
🔎 Multi-Time Frame Analysis
🔄 Divergence (RSI/Price divergence for reversal signals)
These tools help fine-tune entries and exits.
🧩 Common Mistakes in Technical Analysis
Avoid these traps:
Trading every breakout – wait for confirmation.
Ignoring the trend – don’t go against it.
Using too many indicators – analysis paralysis.
Revenge trading – leads to big losses.
Disrespecting stop loss – small loss can become disaster.
✅ How to Master Technical Analysis?
Learn from real charts – theory alone won’t help.
Practice Daily – track 1-2 instruments closely.
Journal Your Trades – analyze what worked/failed.
Backtest Setups – check success over historical data.
Follow Experts – learn from professional TA traders.
Join Communities – share and get feedback.
Consistency is the key to mastery. 📈
🧠 Final Thoughts: Why Technical Analysis Works
Because humans behave in predictable patterns, and TA captures those behaviors in charts. Whether it’s fear of missing out or panic selling, the psychology leaves footprints on price action.
You don’t need to predict the future. You need to react smartly to what the chart is telling you.
Mastering technical analysis takes time, patience, and lots of screen time – but once you get it, it becomes a powerful edge in the market.
BTCUSD 1D TimeframeBitcoin is trading near $117,800 – $118,400
It’s in a sideways consolidation zone after a strong uptrend
📊 Technical Summary
📈 Trend Direction:
Primary Trend: Bullish (long-term)
Short-Term Trend: Sideways to slightly bullish
Structure: Higher highs and higher lows still intact
🔍 Key Support & Resistance Levels
🟢 Support Zones:
$117,000 — Immediate support zone
$115,000 — Minor demand zone
$112,000 — Key swing low support
$108,000 – $110,000 — Strong base if correction deepens
🔴 Resistance Zones:
$119,000 — Current price ceiling
$121,000 — Breakout target
$123,000 – $125,000 — All-time high resistance area
🧠 Indicators Overview
📌 RSI (Relative Strength Index):
Around 58–60
Shows moderate bullishness — not overbought
📌 MACD (Moving Average Convergence Divergence):
MACD line above signal line, but momentum is weakening
Indicates potential slowing of bullish push
📌 Moving Averages:
20-day EMA: Below price — short-term support
50-day EMA: Also below — confirms mid-term uptrend
200-day EMA: Far below — strong long-term bullish signal
🕯️ Candlestick Behavior
Recent candles are small-bodied: suggests indecision
Wicks both sides: market waiting for next trigger
No bearish reversal patterns visible yet

Master Institutional Trading🏛️ Master Institutional Trading
Unlock the secrets of how the smart money dominates the market
Learn to think, plan, and trade like top institutions and hedge funds.
What You’ll Master:
Advanced Market Structure – Breakouts, fakeouts & liquidity grabs
Smart Money Concepts – Accumulation & distribution like a pro
Order Flow & Volume Logic – Follow the real money
Entry & Exit Precision – Based on logic, not guesswork
Institutional Risk Management – Capital protection & scaling
Trader Psychology – Discipline, patience & strategy
No more random trades. No more emotional decisions.
This is structured, high-level trading built for serious traders.
📌 Master the mindset. Read the market. Trade like institutions.

Learn Institutional Trading🏛️ Learn Institutional Trading
Step into the world of smart money and learn how the big players trade!
Institutional Trading isn’t about following indicators—it’s about understanding market structure, liquidity, and smart money moves.
🔍 What You’ll Learn:
Market Structure – Trends, ranges, and liquidity zones
Smart Money Concepts – Accumulation , distribution , and manipulation traps
Volume & Order Flow – See what the institutions see
Precision Entries – No guessing, just calculated moves
Risk Management – Trade like a pro, protect your capital
💡 Why It Matters:
Retail traders often get trapped 🚧 by institutional strategies. When you learn how institutions think and operate, you stop reacting and start predicting market behavior.
🚀 Final Thought:
Think like a pro. Trade like an institution. 🏛️ Win with structure.
Learn Institutional Trading and transform the way you see the market—forever

Ride The Big Moves🚀 Ride The Big Moves 📈
"Ride The Big Moves" is a powerful trading strategy and mindset that focuses on capturing large, high-probability market moves—rather than chasing small, uncertain fluctuations. It’s about positioning yourself with the trend, identifying institutional footprints, and holding trades with discipline and conviction for maximum reward.
This concept is rooted in smart money principles: letting your winners run, minimizing overtrading, and waiting for momentum-backed breakouts instead of guessing tops and bottoms. Whether you're trading options, stocks, or futures, the goal is simple—enter with precision, and ride the wave to its full potential.
👉 Perfect for:
✅ Swing Traders
✅ Intraday Momentum Traders
✅ Institutional-Style Traders
✅ Traders seeking fewer but higher-quality setups
🔍 Key Components:
Identifying high-volume breakout zones
Trend confirmation using price action
Entry triggers aligned with momentum shifts
Risk management for extended holds
Avoiding noise & false signals
Stop settling for crumbs — Ride The Big Moves and trade like the pros.

Technical Analysis vs Fundamental AnalysisWhat’s the Difference?
When people analyze stocks or any tradable asset, they usually follow one of two main approaches: Technical Analysis or Fundamental Analysis. Each one is like using a different lens to look at the same object. Both methods try to answer the same question:
“Should I buy, sell, or avoid this stock?”
But how they arrive at that answer is completely different.
1️⃣ What is Technical Analysis?
Technical Analysis is all about reading charts. It’s based on the belief that everything that affects a stock's price is already reflected in the stock price itself.
So instead of reading about a company's earnings or business strategy, technical analysts look at price movements, trading volumes, and patterns on charts to try to guess what might happen next.
How It Works:
Technical traders believe that history repeats itself.
Price moves in trends — up, down, or sideways.
Patterns like flags, triangles, and head-and-shoulders are seen as hints.
Indicators like RSI (Relative Strength Index), MACD (Moving Average Convergence Divergence), and moving averages are used to make decisions.
Key Concepts in Technical Analysis:
Candlestick Patterns: These show how the price moved in a given time — whether buyers or sellers were in control.
Support & Resistance: Support is a price level where a stock tends to stop falling. Resistance is where it often stops rising.
Volume: Helps you understand the strength behind a price movement.
Breakouts & Reversals: Important signals that indicate possible trend changes.
Real-Life Example:
Let’s say Stock A is trading at ₹500. It has bounced from this price three times before. That level becomes a support. If it suddenly jumps above ₹550 with high volume, that could be seen as a breakout, and a trader might enter a short-term position.
Pros of Technical Analysis:
Helpful for short-term trading like intraday or swing trades.
Fast decision-making based on visual cues.
Doesn’t require knowledge of a company’s financials.
Can be used across all asset classes (stocks, forex, commodities, crypto).
Cons of Technical Analysis:
It doesn’t look at what the company actually does.
False signals can mislead.
It works on probability — not certainty.
Can be overwhelming with too many indicators.
2️⃣ What is Fundamental Analysis?
Fundamental Analysis is like doing background research on a company before deciding whether to invest in it. Instead of looking at charts, you look at the company’s financial health, industry conditions, economic trends, and management quality.
The main goal is to find the true value (intrinsic value) of a stock and compare it with the current market price.
How It Works:
If the intrinsic value is more than the market price, the stock is considered undervalued and worth buying.
If the market price is more than the intrinsic value, it’s seen as overvalued, and better to avoid or sell.
Key Tools of Fundamental Analysis:
Financial Reports: Balance Sheet, Income Statement, Cash Flow Statement.
Ratios: PE (Price-to-Earnings), ROE (Return on Equity), Debt-to-Equity, EPS (Earnings Per Share).
Company's Business Model: What the company does, how it earns, and whether it's sustainable.
Management Quality: Experience and vision of the leadership.
Industry & Economy: Is the industry growing? Are economic conditions favorable?
Pros of Fundamental Analysis:
Ideal for long-term investment.
Helps understand the actual business you’re putting money into.
Less affected by short-term volatility.
Encourages rational decision-making.
Cons of Fundamental Analysis:
Takes time and effort to study.
May not tell you when exactly to buy or sell.
Requires understanding of finance, economics, and accounting.
Stock may stay undervalued for a long time despite good fundamentals.
✅ Which One Should You Choose?
It all depends on your personality, goals, and time commitment.
Go for Technical Analysis if:
You’re active and want to trade daily or weekly.
You like working with patterns and visuals.
You want to time your entry and exit precisely.
You are okay with taking risks for quick gains.
Go for Fundamental Analysis if:
You think long-term and want to build wealth.
You want to invest in solid companies.
You have patience and a stable mindset.
You prefer logic and numbers over charts.
⚖️ Can You Combine Both?
Yes, and that’s what many experienced market participants do.
This combined approach is called techno-fundamental analysis.
For example:
You use fundamentals to select a good company.
You use technicals to find the right entry point.
This way, you get the best of both worlds.
🧠 Final Thought
There’s no universal rule that says one method is always better. It’s all about what suits your style and objective.
If you’re building a portfolio for retirement or wealth over 10+ years, fundamental analysis is your friend.
If you want to trade actively and spot market opportunities daily or weekly, technical analysis is the way to go.
Over time, learning both will make you a more flexible and better-informed market participant.
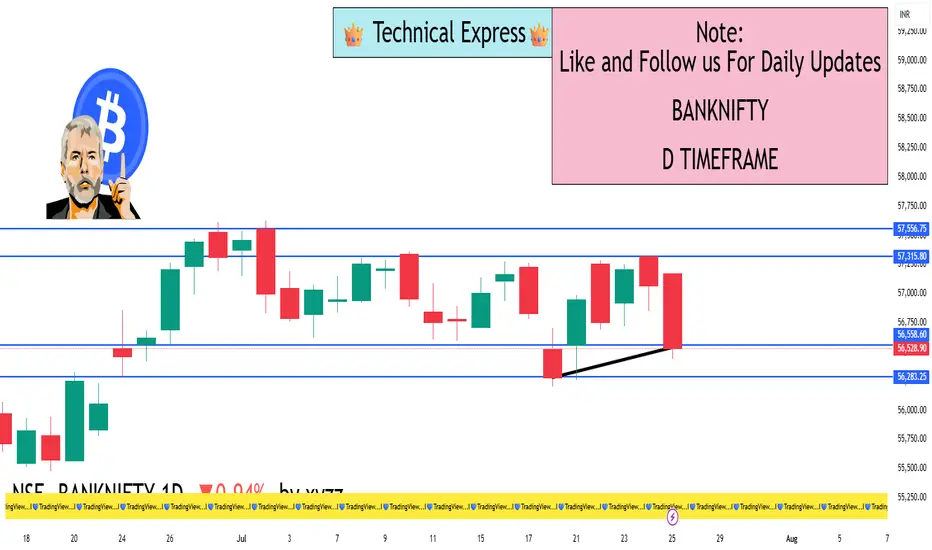
BANKNIFTY 1D TimeframeClosing Value: 56,528.90
Net Change: −537.15 points (−0.94%)
Opening Price: 57,034.40
Day’s High: 57,170.70
Day’s Low: 56,439.40
Trend: Bearish
📊 Technical Analysis
✅ Candle Pattern:
A strong bearish candle was formed.
Price opened higher but failed to sustain and closed near the day’s low — a sign of heavy intraday selling.
🔻 Support Zones:
56,400 – Immediate support (also the day's low)
56,000 – Psychological round number
55,750 – Medium-term support (from earlier price consolidation)
🔺 Resistance Zones:
56,800 – Near-term resistance
57,000 – Critical level; needs to be reclaimed for bullish reversal
57,300 – Stronger resistance zone based on recent highs
📈 Indicator Summary:
RSI (Relative Strength Index): Likely below 50, signaling weakening bullish momentum
MACD (Moving Average Convergence Divergence): Bearish crossover remains intact
Volume: Higher than average, suggesting institutional selling pressure
🧠 Market Sentiment:
Bearish sentiment prevailed across major banks including HDFC Bank, ICICI Bank, Axis Bank, Kotak Bank, and SBI
Pressure also visible in PSU banks (like PNB, Bank of Baroda, Canara Bank)
Overall market mood was risk-averse due to global uncertainty and potential interest rate impact
Foreign Institutional Investors (FIIs) continued their selling streak
Traders remain cautious ahead of upcoming quarterly bank results
✅ Conclusion:
Bank Nifty is currently in a short-term downtrend.
If 56,400 breaks decisively, it may head toward 56,000 and 55,750.
For bulls to regain strength, Bank Nifty must cross back above 57,000 with strong volume and momentum.
Advance Option Trading💼 Advance Option Trading
Advance Option Trading is the next level of trading options — where strategies go beyond simple buying of calls and puts. It involves using multi-leg strategies, understanding the Greeks, managing volatility, and hedging risk like professionals do.
This level of trading is used by experienced traders, institutions, and fund managers who want to take advantage of market complexity, pricing inefficiencies, and risk-reward opportunities in a calculated way.
🔧 What You Learn in Advanced Option Trading:
⚖️ Multi-leg strategies:
Spreads (Bull/Bear, Debit/Credit)
Iron Condors 🕊️, Butterflies 🦋, Straddles & Strangles 🔄
Calendar spreads 🗓️ and Diagonal spreads ➕
🧠 Options Greeks Mastery:
Delta (directional risk)
Theta (time decay)
Vega (volatility sensitivity)
Gamma & Rho (rate of change and interest rate risk)
📈 Volatility Trading:
Learn to trade Implied Volatility (IV) vs. Historical Volatility (HV)
Use volatility crush during earnings
Find edge in IV skew and term structure
🛡️ Hedging and Portfolio Management:
Use options to protect investments
Manage long-term positions with short-term trades
Build delta-neutral portfolios that profit in any direction
🧩 Why It’s Powerful:
🧮 Offers custom risk-reward setups
🔄 Allows you to profit in all market conditions (up, down, sideways)
🎯 Gives you precision control over market exposure
💰 Generates income through strategies like covered calls and credit spreads
🛡️ Helps hedge large portfolios or speculative positions safely
📌 In simple words:
Advanced Option Trading is like playing chess in the financial markets — it’s strategic, thoughtful, and designed to give you an edge over ordinary traders. You don’t just guess direction; you plan for every move the market can make.

Institutional Trading🏦 Institutional Trading
Institutional Trading refers to the buying and selling of large volumes of financial assets by big organizations such as banks 🏛️, hedge funds 📊, mutual funds 💼, pension funds 💰, and proprietary trading firms. These trades are typically high in value and are executed with sophisticated strategies, tools, and market access that retail traders don’t have.
Institutional traders use:
📈 Advanced algorithms
🧠 Data-driven analysis
💹 Block orders
🔍 Deep market research
🛡️ Strong risk management systems
Because of their size and influence, institutional trades can impact market prices, create liquidity zones, and often set the trend for retail traders to follow.
📌 In simple words:
Institutional Trading is how the "big players" move the markets — strategically, in high volume, and with professional precision.

Master Institutional Trading🎯 Master Institutional Trading
Master Institutional Trading means learning to trade like the top financial institutions – with precision, strategy, and data-driven decisions. It’s the highest level of trading where you think and act like banks 🏦, hedge funds 📊, and investment firms 💼.
This mastery involves:
🔍 Understanding how smart money moves
📈 Analyzing volume, liquidity zones, and order flow
💹 Executing large trades without impacting the market
🛡️ Applying risk-controlled option & futures strategies
🧠 Using advanced tools, indicators, and market depth
🔄 Adapting to news, events, and institutional triggers
To master this skill, traders must develop:
📊 Strong technical + fundamental analysis
🧘 Discipline and emotion control
🧾 A solid, backtested trading system
💬 Knowledge of macroeconomic impacts
🧮 Command over greeks, derivatives, and hedging
📌 In simple words:
Mastering Institutional Trading means stepping into the shoes of the pros – learning how the big money operates, and trading with structure, edge, and confidence.

Institutional Intraday option Trading🏦 Institutional Intraday Option Trading
Institutional Intraday Option Trading is the practice of trading options contracts within the same trading day by large financial institutions such as hedge funds 📊, proprietary trading firms 💼, banks 🏛️, and asset managers 💰.
These trades are high-speed, high-volume, and data-driven, designed to capitalize on short-term price movements in the market.
🔧 How It Works:
Institutions use:
⚙️ Advanced algorithms & HFT (High-Frequency Trading)
📉 Options Greeks (Delta, Theta, Vega) to manage risk precisely
🔍 Market depth, volume flow, and order book analysis
🧠 Technical patterns + real-time news feeds
🛡️ Hedging strategies to protect larger positions
🧩 Key Objectives:
💰 Generate quick profits from intraday volatility
📈 Use options premium decay (Theta) to their advantage
📊 Adjust positions rapidly as market conditions change
🧾 Create delta-neutral or gamma-scalping strategies
🧠 What Makes It Different From Retail Intraday Trading?
🚫 No guesswork – it's all data-backed decisions
💼 Huge capital allows for tight spreads and custom contracts
📍 Institutional traders don’t chase trades – they create liquidity
📌 In simple words:
Institutional Intraday Option Trading is how the smart money uses options to profit from minute-to-minute market moves, while controlling risk and maintaining strategic precision.

BANKNIFTY 1D Timeframe📉 Bank Nifty – Daily Overview (as of July 25, 2025)
Opening Price: Around 57,170
Day’s High: Around 57,170
Day’s Low: Around 56,439
Closing Price: Approximately 56,520
Net Change: Down by around 545 points (–0.95%)
🕯️ Candlestick Pattern (1D Chart)
The daily candle is bearish with a long upper wick and small lower wick.
This indicates strong selling pressure from the opening level.
The index failed to hold the highs and reversed sharply during the session.
🔍 Key Technical Zones
Level Price Range
Support 56,500 – 56,400
Next Support 56,150 – 56,000
Resistance 57,200 – 57,300
Major Resistance 57,500 – 57,650
If Bank Nifty breaks below 56,400, it may slide further toward 56,000 or even 55,800.
A move above 57,300 may invite bullish momentum.
📊 Trend & Technical Outlook
Short-Term Trend: Bearish
Medium-Term Trend: Neutral to mildly positive (if above 56,000)
Price Structure: Lower highs are forming; a descending pattern is developing.
Volume Analysis: Increasing volume on red candles suggests sellers are active.
Indicators (general behavior):
RSI may be near 50–55 range — neutral zone.
MACD likely showing bearish crossover.
Moving averages are flat to slightly negative.
✅ Strategy Suggestions
For Swing Traders:
Look for a bullish reversal pattern near 56,400–56,150 zone for possible long entries. Avoid long positions until price shows strength above 57,200.
For Breakdown Traders:
Wait for a solid close below 56,400 with high volume. Target levels can be 56,150 and 55,800.
For Intraday Traders:
Expect a volatile range between 56,400 and 57,200. Trade breakouts or reversals near these levels with confirmation.
📌 Summary
Bank Nifty is currently weak, with clear selling from resistance levels.
It is trading near key support (56,500–56,400). If this zone breaks, expect further downside.
Bulls need to reclaim 57,200+ for any reversal signals.
Trend remains bearish in short term, neutral in medium term.
