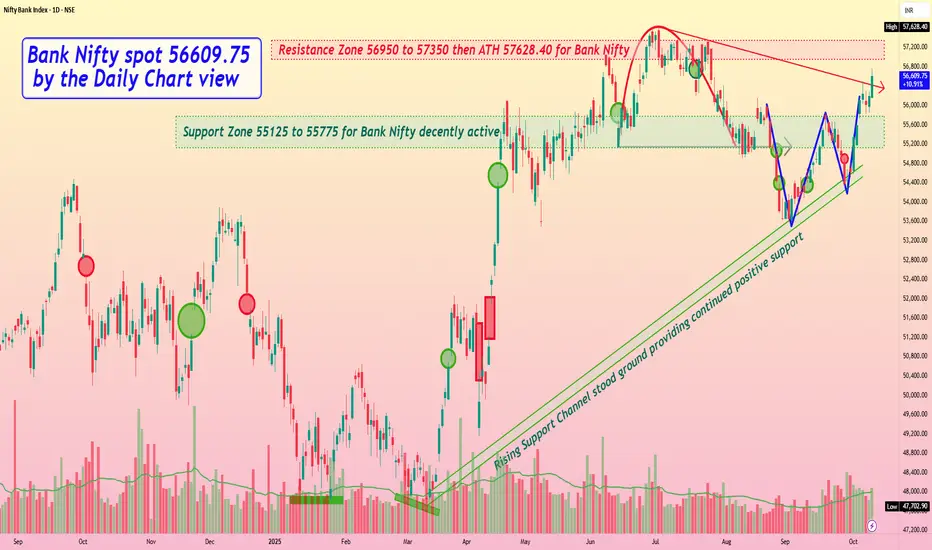
Bank Nifty spot 56609.75 by the Daily Chart view - Weekly updateBank Nifty spot 56609.75 by the Daily Chart view - Weekly update
- Support Zone 55125 to 55775 for Bank Nifty decently active
- Resistance Zone 56950 to 57350 then ATH 57628.40 for Bank Nifty
- Falling Resistance Trendline Breakout seems in the making for uptrend
- Rising Support Channel stood ground and provided steady positive support
- Bullish Rising W pattern done and well sustained by current trending momentum
- Support Zone tested and tested over the past full week, indicating probable positive trend
Doublebottompattern
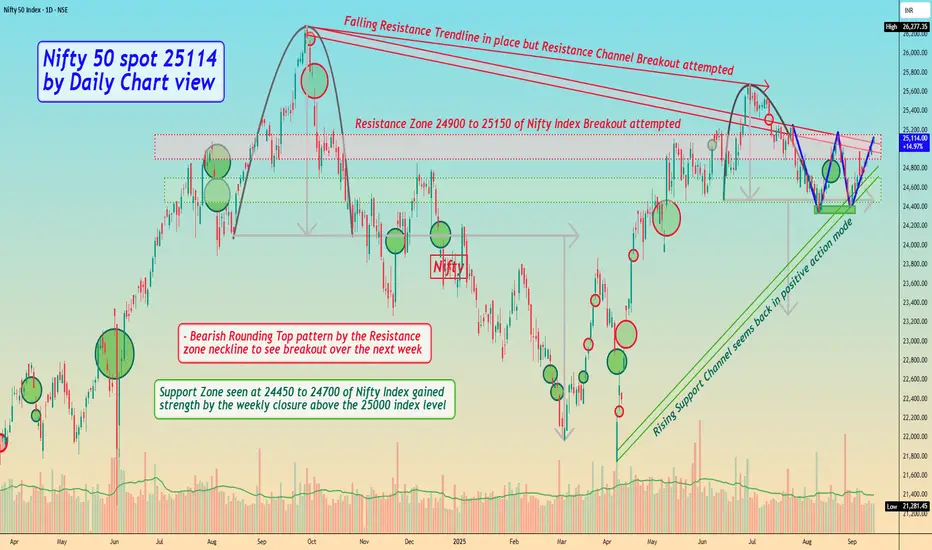
Nifty 50 spot 25114 by Daily Chart view - Weekly UpdateNifty 50 spot 25114 by Daily Chart view - Weekly Update
- Rising Support Channel seems back in positive action mode
- Resistance Zone 24900 to 25150 of Nifty Index Breakout attempted
- Falling Resistance Trendline in place but Resistance Channel Breakout attempted
- Bearish Rounding Top pattern by the Resistance zone neckline to see breakout over the next week
- Bullish "W" with Double Bottom formed below Support Zone, seems instrumental for uptrend momentum
- Support Zone seen at 24450 to 24700 of Nifty Index gained strength by the weekly closure above the 25000 index level
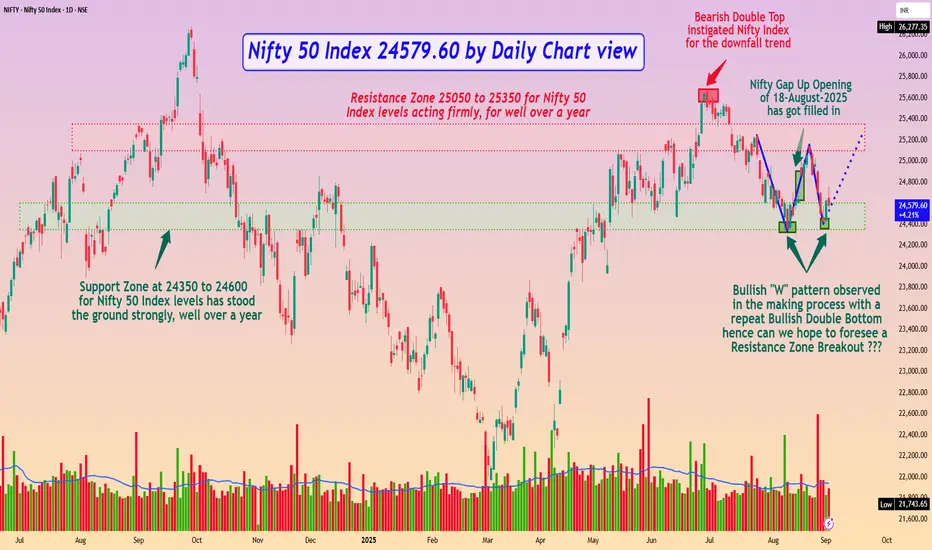
Nifty 50 Index 24579.60 by Daily Chart viewNifty 50 Index 24579.60 by Daily Chart view
- Nifty Gap Up Opening of 18-August-2025 has got filled in
- Bearish Double Top instigated Nifty Index for the downfall trend
- Resistance Zone 25050 to 25350 for Nifty 50 Index levels acting firmly, for well over a year
- Support Zone at 24350 to 24600 for Nifty 50 Index levels has stood the ground strongly, well over a year
- Bullish "W" pattern observed in the making process with a repeat Bullish Double Bottom hence can we hope to foresee a Resistance Zone Breakout ???
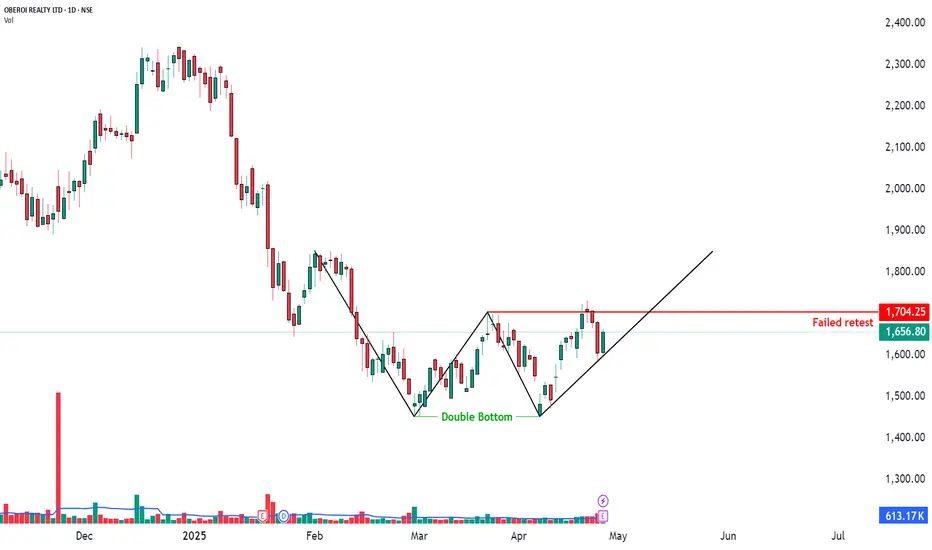
Double Bottom but Failed Breakout Retest | Daily Time Frame📉 OBEROI REALTY LTD – Double Bottom but Failed Breakout Retest
📅 Date: April 28, 2025
📈 Timeframe: Daily Chart
🔍 Stock: Oberoi Realty Ltd (NSE)
📌 Technical Overview:
A Double Bottom pattern was formed indicating bullish reversal potential.
Price attempted a breakout above the neckline near ₹1704.25, but the retest failed — price could not sustain above the breakout zone.
Price is currently trading at ₹1656.80, under the trendline support.
🧩 Key Observations:
✅ Double bottom structure was confirmed.
❌ Breakout retest failed — caution needed.
📉 Watch trendline support (black line) closely — breakdown could trigger weakness.
📊 Volume during the failure was moderate (not aggressive selling yet).
🧠 Observational Bias:
Weak below the trendline support.
Bulls must reclaim and hold above ₹1704.25 to regain strength.
BEL – Sector Strength + Double Bottom + Volume Thrust 📈 BEL – Sector Strength + Double Bottom + Volume Thrust = A Setup Worth Tracking
The India Defence Index just broke into new all-time highs, possibly driven by rising geopolitical tensions — but beyond the headlines, the sector remains structurally strong.
BEL (Bharat Electronics Ltd) is showing powerful confluence:
A double bottom breakout
Sectoral support
Rising volumes
Key moving averages reclaimed
All of this sets up a technically sound positional opportunity.
🧠 Technical Highlights
✅ Stock trading above key DMAs
✅ Volume picking up — watch for 4x–5x surge to confirm strength
✅ ATH at ₹339.90 may act as resistance; clean breakout above it = add/fresh entry
✅ Defence sector index at ATH – macro tailwind active
🧮 Setup Overview
Entry Zone ₹32.7
Stop Loss (SL) ₹287.65
ATH Resistance ₹339.90
Target (Positional) ₹399.10
SL % -10.09%
Target % +24.72%
Risk : Reward 1 : 2.45
🧭 Suggested Strategy
🔄 Add 30–40% at breakout
🧘 Wait for pullback or retest to add more
🚫 Avoid chasing — shakeouts are very likely
🧠 Gradual accumulation + disciplined risk management > FOMO
📊 Volumes should confirm — clean candle with strong demand = green signal
⚠️ Final Note:
We are not entirely out of danger — markets can throw brutal pullbacks and false breakouts. Defensive positioning, proper sizing, and exit planning are essential.
📉 Disclaimer:
This is not a buy/sell recommendation. For educational purposes only. Do your own research and manage risk as per your trading style.

NIIT LTD - Bullish Reversal Setup📊 NIIT LTD – Bullish Reversal Setup
🕰️ Timeframe: 1D | 🧩 Pattern: Double Bottom
🔍 Technical Chart Overview:
NIIT is showing a strong Double Bottom reversal pattern on the daily chart — a classic signal of potential trend reversal from bearish to bullish.
After bouncing from the major support zone near ₹105, the price has broken out above the neckline (around ₹133.5) on strong volume, indicating bullish conviction.
🔑 Key Technical Levels:
🔵 Resistance Levels:
₹159.70
₹171.50
🔴 Support Levels:
₹133.50 (neckline retest zone)
₹127.90 (minor support)
₹105.00 (base support)
📈 Breakout Confirmation:
Price has broken above the neckline with a high volume spike, confirming the double bottom breakout.
Next targets lie in the ₹159–₹171 range, aligning with previous supply zones.
📊 Volume & Price Action Notes:
Recent bullish candles with above-average volume
Potential retest of neckline could offer a favorable risk-reward entry
🧠 Bias: Bullish (as long as price holds above ₹133.5)
📌 Chart Indicators Used:
📉 Volume Spike confirmation
🔃 Double Bottom Pattern
🔍 Key S/R Levels marked
📍 Entry/Target Path projection with arrow
⚠️ Disclaimer: This analysis is for educational purposes only and not financial advice. Please DYOR before making trading decisions.
📈 Follow for more actionable chart patterns | PriceAction_Pulse
💬 Drop a comment if you're tracking NIIT!

SCI(Shipping Corporation of India) Analysis!NSE:SCI – Double Bottom Pattern Forming a Bullish Reversal?
📊 Chart Pattern:
A Double Bottom pattern has been identified on the daily chart of Shipping Corporation of India (SCI), indicating a potential trend reversal from the recent downtrend.
🔍 Key Observations:
Falling Bottom & Rising Bottom:
The first bottom formed at a lower level, followed by a second bottom at a slightly higher level, aligning with bullish RSI divergence (indicating possible strength in the price action).
Neckline Breakout Level:
The neckline of the pattern is around ₹169-172, which serves as the critical resistance level. A breakout above this level could confirm a bullish move.
Projected Target:
The pattern height projection suggests a potential target of ₹193.65 upon a successful breakout.
EMA Resistance Levels:
The price is currently below the 50 EMA (₹198.76), 100 EMA (₹212.83), and 200 EMA (₹218.62). A breakout above these levels would further strengthen the bullish outlook.
RSI Recovery:
The Relative Strength Index (RSI) is recovering from oversold levels, currently at 42.38, suggesting that bullish momentum is slowly building.
📈 Trading Plan:
A confirmed breakout above ₹169-172 with strong volume could indicate a further bullish rally toward the ₹193-195 zone.
Stop-loss: Below the second bottom level to manage risk.
Watch EMA Levels: The stock needs to sustain above key moving averages to continue upward momentum.
Disclaimer: Consider my analysis for educational purposes only.
Before entering any trade:
1️⃣ Educate Yourself – Understand market dynamics and technical patterns.
2️⃣ Do Your Own Research & Analysis – Never rely solely on external opinions.
3️⃣ Define Your Risk-Reward Ratio – Ensure your trade aligns with your risk appetite.
4️⃣ Never Trade with Full Capital – Always manage risk and preserve capital.
Trade wisely! ✅📊

Mastering the Double Bottom Pattern for Trend Reversal Trading!Understanding the Double Bottom Pattern: A Key to Trend Reversal
Hello Traders! Today, let’s dive into the Double Bottom Chart Pattern , a classic technical pattern that signals a potential reversal in a downtrend. The double bottom is considered one of the most reliable patterns for identifying trend reversals, especially in the context of bullish market movements .
This pattern is typically found when the price forms two consecutive lows , each close to the same level, with a peak (or “neckline”) in between. Once the price breaks above the neckline, it indicates a potential long entry point.
Identifying the Double Bottom Pattern
Formation: Recognized by two consecutive lows, the Double Bottom forms when the price hits a support level, bounces up, and then returns to retest the same low before reversing higher.
Neckline Breakout: The pattern is confirmed when the price breaks above the “neckline” (the resistance level formed between the two bottoms). This breakout is typically followed by a sharp upward movement.
Volume Confirmation: Volume typically increases during the breakout, confirming the pattern and signaling strong momentum.
Support Zone: The area between the two bottoms, where the price repeatedly tests support, is a key area for setting stop losses and defining your risk management.
Trading Strategy: Double Bottom Pattern
Entry Point: Consider entering a long position once the price breaks above the neckline, confirming a trend reversal.
Stop Loss: Place your stop loss just below the second bottom to minimize risk if the price retraces.
Profit Targets: Measure the distance from the bottom to the neckline and project that distance upwards from the breakout point to determine your potential target.
Real-World Application: Lumax Industries Case Study
Looking at the chart of Lumax Industries , we can see a perfect example of the Double Bottom Pattern from 2008-2010. After the price tested the support zone twice, it broke above the neckline, confirming the reversal and setting the stage for strong upward momentum. This would have been an excellent entry point for traders who understood the power of this chart pattern.
Risk Management Considerations
Position Sizing: Adjust your position size according to the risk involved in trading this pattern.
Stop Loss Placement: The stop loss should be placed below the second bottom to protect against potential false breakouts.
Patience & Confirmation: Wait for confirmation of the breakout, and ensure volume is increasing as the price breaks through the neckline.
What This Means for Traders
By mastering the Double Bottom Pattern , traders can confidently enter trend reversals and capitalize on the subsequent price movement.
Look for the pattern in downtrending markets to identify potential opportunities for reversal.
Use volume as confirmation to validate the breakout and avoid false signals.
Be disciplined with stop losses to manage risk while allowing for maximum reward.
Outcome:
The Double Bottom Pattern is a powerful tool for identifying trend reversals, and when used correctly, it can provide high-probability trade setups with excellent risk-to-reward ratios. By understanding its formation and applying proper risk management, traders can enhance their trading strategies and improve their overall performance.
What’s your experience with the Double Bottom pattern?
Have you used this pattern in your trading? How did it work for you? Share your thoughts in the comments below!

Sundaram Finance | Double Bottom | Market Structure Breakout Sundaram Finance
Reasons for Breakout
1) Market Structure Breakout forming higher highs and higher lows
2) Trying to fill the gapup
3) Formation of "W" at the bottom

Nifty 50: Double Bottom Pattern & Price Channel InsightsNifty 50 Analysis - A Learning Opportunity
Let’s break down what’s happening in the chart:
1. Double Bottom Pattern
Do you see that "W" shape forming on the chart? That’s called a double bottom pattern. It’s one of the most reliable indicators that the market might reverse from a downtrend to an uptrend. This happens because the price tested a low point twice but couldn’t go lower, showing that buyers stepped in strongly.
2. Support Zone
The highlighted area on the chart is a support zone. Think of it as a safety net where the price tends to stop falling because buyers jump in. This zone has shown its importance before, so it’s no surprise that the market reversed here again.
3. Price Channel
Notice how the price is moving within that green channel? That’s an ascending price channel, which means the market is trending upwards in a structured way. The bottom line of the channel acts as support, while the top acts as resistance. It’s like a guide to understanding how the price might behave if the trend continues.
4. MACD Indicator
At the bottom, you’ll see the MACD (Moving Average Convergence Divergence) indicator. It’s showing signs of momentum improving. The lines are coming closer together, and if they cross upwards, it confirms the trend shift. It’s like getting a green light for the bullish move.
What Can We Learn From This?
1. Patterns Tell a Story
The double bottom pattern tells us that buyers are stepping up, and sellers are losing strength. Learning to recognize this pattern early can give you a head start in understanding market trends.
2. Support Zones Matter
Support zones are like battlefields where buyers and sellers fight for control. When the price bounces off a support zone, it shows that buyers are winning. These zones are great reference points for understanding market movements.
3. Channels Are Roadmaps
Price channels give structure to the market. The price tends to respect the channel boundaries, so understanding these can help you anticipate where the price might head next.
4. Indicators Confirm Trends
The MACD is like a second opinion—it helps confirm what the chart is already telling you. Watching for a crossover or changes in the histogram can give you confidence in your analysis.
Why This Matters
Understanding these patterns and indicators isn’t about predicting the future—it’s about reading what the market is telling us right now. It’s a way to build confidence in your ability to analyze charts and make informed decisions.
Keep practicing, and soon, identifying patterns, channels, and key zones will become second nature!
If you found this analysis insightful, don’t forget to hit like and follow for more such content!
For related trading ideas and educational posts, check out our profile @TraderRahulPal Let’s learn and grow together!

W Pattern Neckline & Falling Trendline Breakout seen in HavellsHello Everyone, i hope you all will be doing good in your trading and your life as well. Today i have brought a stock which has taken perfectly support at upward support trendline and formed a double bottom (W) pattern and also given a faliing resistance trendline breakout on daily timeframe price is still above to neckline and falling resistance trendline. Stock is giving good discounted entry price at these levels. Stock is down almost 17% from all time high., stock name is Havells India Limited and it is a leading Fast Moving Electrical Goods (FMEG) Company and a major power distribution equipment manufacturer with a strong global presence. It enjoys enviable market dominance across a wide spectrum of products, including Industrial & Domestic Circuit Protection Devices, Cables & Wires, Motors, Fans, Modular Switches, Home Appliances, Air Conditioners, Electric Water Heaters, Power Capacitors, Luminaires for Domestic, Commercial and Industrial Applicationsand.
Company is almost debt free.
Company has been maintaining a healthy dividend payout of 42.5%.
Company's working capital requirements have reduced from 16.7 days to 12.6 days.
Stock is good for short term to long term, Company is consistent profit maker every year it is posting exponantial growth on profits.
Market Share
The company has a market share of 10-15% for products like modular switches, SDA, Lighting, cables, and ACs and a 15-20% market share in the water heaters, MCBs, fans, and wires business.
Fundamental Analysis
P/E ratio is 76.3379 which is lower than it's Industry P/E 76.34
Interest Coverage ratio is 21.28
Stock has given a return of 30.9% in last 52 Weeks
ROCE is 25.46%
ROCE 25.46% has increased as compared to last year's ROCE 23.07%
ROE is 18.07%
ROE 25.46% has increased as compared to last year's ROE 23.07%
Operating Profit Margin (EBITDA Margin) is 10.12%
Operating Profit Margin (EBITDA Margin) 10.12% has improved as compared to last year's OPM 9.58%
Net Profit Margin (PAT Margin) 6.84% has improved as compared to last year's NPM 6.34%
Free Cash Flow yield is 1.32%
Free Cash Flow yield 1.32% has improved as compared to 5 Yrs avg FCF yield 1.19%
Cash Conversion Days 10.39 has improved as compared to 5 Yrs avg Cash Conversion Days 11.24
Annual Profit has grown over by 18.56%
3 Years Sales CAGR is 25.34%
3 Years Profit CAGR is 20.03%
Quarterly Sales has grown over by 16.38% YoY
DII have increased their stakes by 0.39% in the latest quarter (8.28% to 8.67%)
Promoters + FIIs + DIIs hold 92.84% in the company
Disclaimer:- Please always do your own analysis or consult with your financial advisor before taking any kind of trades.
Dear traders, If you like my work then do not forget to hit like and follow me, and guy's let me know what do you think about this idea in comment box, i would be love to reply all of you guy's.

AGI Greenpac Ltd. - Looks Good!NSE:AGI
This stock has formed a pattern called Double Bottom.
A "double bottom" is a chart pattern used in technical analysis to predict a potential reversal of a downtrend. It typically occurs after a prolonged decrease in price and consists of two distinct lows at approximately the same level, separated by a moderate peak.
target price for the intermediate-term in the range of 955.00 to 965.00.
Also The MACD has also generated a bullish signal.
RSI above 60.
PLEASE NOTE THAT:
This chart analysis is only for reference purpose.
This is not buying or selling recommendations.
I am not SEBI registered.
Please consult your financial advisor before taking any trade

Multipattern Analysis on IDFC First Bank!NSE:IDFCFIRSTB Analysis!
Multipattern Analysis on $NSE:IDFCFIRSTB!
Analysis on a Weekly Timeframe!
Analysis:
I have done the overfall analysis of IDFCFIRSTB since its inception. It looks very complicated but if you know all the patterns it is just like anything. I have combined all the patterns with the Support and Resistance Trendline. Don't get confused. Read the chart thoroughly and you'll get a better idea of where to enter and where to exit. As you can see in Chart 3 most important reversal patterns are there.
1) Triple Bottom Pattern 2) Double Bottom Pattern 3) Inverted Head and Shoulders Pattern
Now the price is moving in a parallel channel but we can see the Flag and Pole Pattern Formation is going on. Aggressive investors can enter at current price levels as the price is above 50EMA. But my suggestion would be to enter only after the upside channel breakout.
Trade Setup:
Entry= Current levels are good for aggressive investors. Conservative investors can enter after Flag/upper channel breakout
Target= Nearest Possible Target would be 100.70(New All-Time High Level)
Stop Loss= Below 75.66
Disclaimer = Consider my analysis for Educational Purposes only.
Before entering into any trade -
1) Educate Yourself
2) Do your research and analysis
3) Define your Risk to Reward ratio
4) Don't trade with full capital

RKEC - DOUBLE BOTTOM FORMATION WITH A BREAKOUTHi All,
THis idea is about RKEC Projects Ltd
Fundamentals
Mkt Cap - 308 Cr
Stock PE - 15
ROE - 12.5%
ROCE - 15.5%
Mkt Cap/Sale < 1
D/E - 0.83
Quick Ratio - 1.09
RKEC Projects Ltd is in the business of Civil and Defence Construction
Technical Analysis
As the chart depicts, the price went for a double bottom formation and give a contraction of more than 70% while forming both bottoms.
It has given a successful breakout and first resistance has been marked. This trade can continue till next results as it could give a surprise being in a sector which is having strong tail winds.
Happy Trading,
Thanks,
Stock-n-Shine

HDFCAMC Analysis!NSE:HDFCAMC Analysis on a weekly timeframe!
Double Bottom Pattern in HDFCAMC!
RSI Divergence in HDFCAMC!
Entry = Above Neckline
Stop Loss = Below 2216.95
Target = 3344.40
Disclaimer = All my analysis is for Educational Purposes only. Before entering into any trade -
1) Educate Yourself
2) Do your research and analysis
3) Define your Risk to Reward ratio
4)Don't trade with full capital

Double Bottom & Head and Shoulders Bottom PatternRushil Decor Ltd.
Daily Chart showing Double Bottom & Head and Shoulders Bottom Pattern Formation
Double Bottom Pattern
The price seems to have reached a bottom after failing to break through a support level and ultimately rising higher in a sign of reversal to a new uptrend.
The Double Bottom pattern forms during a downtrend as the price reaches two distinct lows at roughly the same price level.
Head and Shoulders Bottom Pattern
The price seems to have reached the end of a period of "accumulation" at the bottom of a major downtrend; the break up through resistance signals a reversal to a new uptrend.
The Head and Shoulders Bottom is created by three successive declines in the price following a significant downtrend.
Note for everyone who came across this reference:
This chart analysis is only for reference purpose.
This is not buying or selling recommendations.
I am not SEBI registered.
Please consult your financial advisor before taking any trade.

SBI - Double Bottom PatternSBI has formed Double Bottom Pattern and started to gave a breakout from 568 as that was resistance line. Based on the pattern target can be set as 625-630.
Disclaimer:
This idea is only for education purpose, Please consult your financial advisor.
I am not SEBI registered.

Double Bottom Pattern FormationDouble Bottom Pattern Formation in Daily Chart of PONNIERODE
What is Double Bottom Pattern?
The double bottom pattern is a popular technical chart pattern used in financial markets, particularly in stock trading and investing. It is considered a bullish reversal pattern, signaling a potential change in the trend from a downtrend to an uptrend.
The pattern consists of two significant lows (or troughs) on a price chart that are approximately at the same level, separated by a temporary peak (or high) in between. Visually, it looks like the letter "W."
Here are the key characteristics of the double bottom pattern:
Downtrend: The double bottom pattern occurs after a prolonged downtrend, indicating that the price of the asset has been decreasing over time.
First trough: The first low point (trough) forms as the price reaches a bottom and begins to rebound slightly.
Temporary peak: After the first trough, the price retraces upwards, forming a temporary peak or a small rally.
Second trough: Following the temporary peak, the price declines again but typically does not fall below the level of the first trough. The price then rebounds once more, forming the second trough at a similar level to the first trough.
Breakout: The confirmation of the double bottom pattern comes when the price breaks above the resistance level formed by the temporary peak between the two troughs. This breakout signals that the downtrend may have ended and a new uptrend is potentially starting.
Volume: Ideally, the trading volume should show a decrease as the pattern forms and then increase when the price breaks out of the pattern. The volume pattern should generally mirror the price pattern, with a higher volume during the breakout.
Traders and investors often use the double bottom pattern to identify potential buying opportunities. Once the pattern is confirmed with a breakout, they may enter a long (buy) position with a stop-loss order placed below the pattern's lowest point. The profit target can be set based on technical analysis or by measuring the pattern's height and projecting it upwards from the breakout level.
As with any technical analysis pattern, it's essential to use the double bottom pattern in conjunction with other indicators and analysis tools to increase the probability of successful trades and to manage risks effectively. Moreover, like all technical patterns, the double bottom is not foolproof, and there is always a risk of false signals, so it's essential to practice prudent risk management when trading based on chart patterns.
Note for everyone who came across this reference:
This chart analysis is only for reference purpose.
This is not buying or selling recommendations.
I am not SEBI registered.
Please consult your financial advisor before taking any trade.

Micro cap company potential to double current price Stock chart show current price will be double stock price keeping 27-30 as Stop loss.
Company last 3 quater giving positive results
Positive of the company is giving UPI service by this company. Pramoter itself telling this company global 30% online money transfer using this company
No cash generating company
Operating cash flow is negetive

HIMATSEIDE Analysis(Double Bottom)!HIMATSEIDE Analysis on Weekly Timeframe
Bullish view on HIMATSEIDE
Double Bottom Pattern Formation in HIMATSEIDE
Neckline Breakout
HIMATSEIDE has made double bottom patten on Weekly Timeframe. The price has given breakout to the neckline 85.45 and now it is trading above it. We can see the breakout has happend with the good volume. We can expect further upmove upto 107.80.
Trade Psychology and Setup =
Entry = Between 85 - 90 but it will good if we can enter with lower price
Target = 107.80
Stop Loss = Below 75.80
Disclaimer = All my analysis are for Educational Purpose only. Before entering into any trade - 1) Educate Yourself 2) Do your own research and analysis 3) Define your Risk to Reward ratio 4)Don't trade with full capital

BAJAJFINSV Analysis(Double Bottom)!NSE:BAJAJFINSV ANALYSIS!
BAJAJFINSV Daily Analysis!
Double Bottom Pattern Formation and Breakout in BAJAJFINSV!
RSI Divergence in BAJAJFINSV!
Double Bottom Pattern analysis with RSI Divergence
BAJAJFINSV has made Double Bottom Pattern on a daily timeframe it has given a breakout to the neck level and retested it's support level at the neckline only. If we see the RSI we can see the clear Divergence, while price making falling bottoms RSI making Rising Bottoms. We can expect price to move in the upward direction.
Entry = Aggressive investors can buy at current levels, Conservative investors can wait for small retest.
Stop Loss = Below 1393.90
Targets = 1) 1486.40 3) 1570.35 3) 1665.25
Disclaimer = All my analysis are for Educational Purpose only. Before entering into any trade - 1) Educate Yourself 2) Do your own research and analysis 3) Define your Risk to Reward ratio 4) Don't trade with full capital

TATACONS BUYBUY TATA CONS, 725 till 700 for 750/775 and 805. Invalid below 685 on closing basis. Stock after making double bottom has given breakout.

EDELWEISS FIN SERVICES - 120% RETURNS!!BUY - EDELWEISS FINANCIAL SERVICES
CMP -Rs. 67
Target - 1: Rs. 96
Target - 2: Rs. 124
Target - 3: Rs. 150
.
.
Technicals - Bullish Triangle
.
This is just a view by an expert analyst, please invest at your own risk.
.
Follow me for more!
