Double Top Pattern🧭 Overview
A Double Top is a bearish reversal pattern that indicates a potential end to an uptrend and a shift toward a downward phase. It forms an “M”-shaped structure on the chart, marked by two consecutive peaks at nearly the same level, separated by a moderate pullback known as the neckline. The pattern is confirmed when price decisively breaks and closes below the neckline, signaling weakening buying strength and a change in market control.
------------------------------------------------------------
🔑 Key Components of a Double Top Pattern
1️⃣ First Peak
Price rallies strongly to a high, marking the end of an extended upward move. A pullback follows, indicating the first sign of resistance.
2️⃣ Trough / Neckline
After the first peak, price retraces to a support area and stabilizes. This level forms the neckline, which acts as a key decision zone.
3️⃣ Second Peak
Price attempts to rise again toward the previous high but fails to break above it. This failure reflects weakening buying momentum and growing selling pressure.
4️⃣ Breakdown (Confirmation)
The pattern is confirmed when price breaks and closes below the neckline, signaling a shift in trend direction.
------------------------------------------------------------
📊 Chart Explanation
Two prominent peaks form near the same price level, highlighting strong resistance.
The pullback between the peaks creates a clear neckline support.
The second peak shows reduced strength compared to the first.
A decisive breakdown below the neckline confirms the reversal and opens the path toward lower levels.
------------------------------------------------------------
📝 Summary
• Double Top forms after a strong uptrend.
• Failure at the second peak indicates buyer exhaustion.
• Neckline acts as a key confirmation level.
• Breakdown below the neckline validates the reversal structure.
------------------------------------------------------------
⚠️ Disclaimer
📘 For educational purposes only
🙅 Not SEBI registered
❌ Not a buy/sell recommendation
🧠 Shared purely for learning and pattern understanding
📊 Not Financial Advice
Double Top

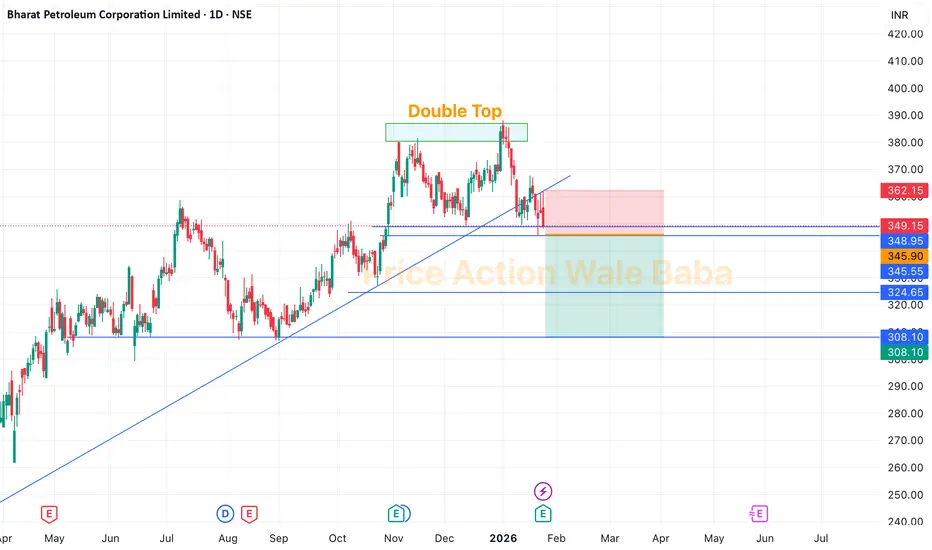
BPCL - Double TopBPCL is forming a Double Top which is has neckline of 345.
Delivery Based Selling Strategy:
Sell below 345,
Keep SL on high of 23rd Jan candle, which is 361.
Targets are 320-300.
Option Buying Strategy
So, for the option trading in this stock, you can choose any PUT option on BPCL, mark high of 21st Jan candle in option, once it breaks it just buy and keep SL below same day's low.
BSE- Correction phase startsAfter more than 2000% rally in 2 years, BSE finally formed a double top pattern in monthly. The target for this pattern is 1241 which is the confluence of fib 0.618 + Monthly support + blue channel support.
Note: This is for educational purpose and not a trade recommendation.

HINDALCO double top detectedDouble top with divergence detected in the Hindalco daily chart.
Bearish invalidation above 864.
Bearish continuation below 847.50 with downside targets of 838, 829 and 822 as early supporting key levels.

#ADANIPOWER – Double Top Danger Zone!📉⚡ #ADANIPOWER 🚨
ADANIPOWER has formed a monthly double top 🔝 near the 179–183 (ATH) zone and is now slipping toward its rising trendline 📉
Price is also trading inside the September monthly candle (182.70–120.00). MCB or sustained close below 120 will signal major weakness ⚠️👇
If selling continues, price may head toward 112.50–124, 92–96 , and the breakout retest supports at 83–87 .
Bulls must defend the trendline to avoid a deeper correction 🛡️🔥
Resistances: 151.20 / 179–183 (ATH)
#ADANIPOWER #PriceAction #DoubleTop #ChartPattern #InsideBar #CandlestickPattern
📌 #Disclaimer: This analysis is shared for educational purposes only. It is not a buy/sell recommendation. Please do your own research before making any trading decisions.

NIFTY MIDCAPNIFTY MIDCAP formed with DOUBLE TOP with DIVERGENCE with first target 14,403, and next support at 13,995. If it didn't take supports at 13,995 we can see further downside with FINAL TRAGET 13,900.

Zcash Formed Triple TopZcash Formed Triple Top And Ready For Breakdown.
But Twist is, 0.38 retracement level. trend still strong
Ready short for setup
Reverse Scenario:
Break That Triple Top High
Any Bullish Pattern breakout in smaller time frame.
🧠 Always DYOR (Do Your Own Research)
⚖️ This is not financial advice or suggestion
👉 “Risk Is Real 💸 Stay Practical🚀”
💬 Please feel free to ask any questions (It's Free)

SOL DUMP TO THE $40YES, YOU SEEN RIGHT
CRYPTO:SOLUSD
SOL ready with multiple negative patterns.
1. all time resistance
2. triple top
3. cup and handle failure
First pattern is already activated and triple top near to active.
Reverse scenario
take support from major strong support. cup and handle breakout
🧠 Always DYOR (Do Your Own Research)
⚖️ This is not financial advice or suggestion
👉 “Risk Is Real 💸 Stay Practical🚀”
💬 Please feel free to ask any questions (It's Free)

#Silver Alert: Double Top Breakdown Incoming?🚨 Double Top on XAGUSD daily chart:
1️⃣ First Top: Bearish Engulfing
2️⃣ Second Top: Dark Cloud Cover
Pattern confirms DCB 🔻 below $45.55 , 🎯 targeting $36.71 .
🚧 Resistance: $52.32 - $54.49
🛡 Support: $50.62, $49.38 - $48.91, $47.17 - $46.90
⚠️ Major sell-off potential. Longs only above Double Top high after 2 consecutive closes.
#Silver #XAGUSD #DoubleTop #TechnicalAnalysis #BearishReversal #ChartPatterns #CandlestickPatterns #PriceAction
📌 #Disclaimer: This analysis is shared for educational purposes only. It is not a buy/sell recommendation. Please do your own research before making any trading decisions.

Gold’s Double Trouble: Will the Bounce Hold or Break Below?#Gold hit a double top after a parabolic rally, topping at 4380.99 and 4381.44 , forming a classic M-pattern . Breakdown below 4185.91 confirmed the bearish structure, and price nearly completed the pattern target by testing the long-term ascending trendline , leading to a technical bounce.
👀 Now, all eyes are on the key zones:
🔸 Critical Resistance: 4185.91 – 4205.12
🔸 Critical Support: 3944.435 (green line)
📉 Break below the support (4HCB) could trigger further bearish continuation .
📈 Break above the resistance zone (4HCB) could open doors to retest All-Time Highs (ATH) .
🧭 These are your trend-deciding levels – stay sharp!
#XAUUSD | #Gold | # TVC:GOLD | #GoldAnalysis | #DoubleTop | #Mpattern | #ChartPatterns | #PriceAction | #TrendDeciderLevels | #KeyLevels | #BullVsBear
📌 Disclaimer: This analysis is shared for educational purposes only. It is not a buy/sell recommendation. Please do your own research before making any trading decisions.

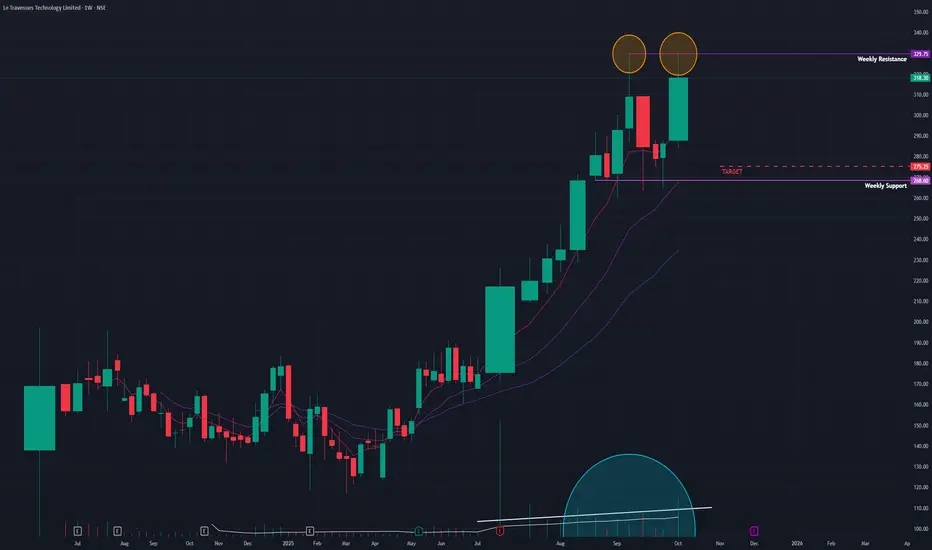
Ixigo (W) - At a Crossroad: Bullish Trend vs. Bearish PatternAfter a spectacular run-up, Ixigo (Le Travenues Technology Ltd) has entered a sideways consolidation phase. The current price action presents conflicting technical signals, placing the stock at a critical inflection point where it could either be pausing before another surge or forming a major top.
The Powerful Backdrop
Since April 2025, Ixigo has been in a powerful bull market, delivering an extraordinary gain of approximately 166% in just a few months. Following this rapid ascent, the stock's strong momentum has paused since August 2025, with the price now trading within a well-defined horizontal range.
The Current Dilemma: Two Competing Scenarios
The technical picture offers two distinct and competing interpretations:
1. The Bullish Case (A Healthy Consolidation):
This perspective views the current phase as a normal and healthy pause, where the stock is building energy for its next advance. This argument is supported by:
- Strong Underlying Momentum: Key indicators like the short-term Exponential Moving Averages (EMAs) remain in a bullish positive crossover state, and the Relative Strength Index (RSI) is still rising, suggesting the primary uptrend remains intact.
2. The Bearish Warning (A Potential Reversal):
Conversely, there are clear warning signs that the rally could be losing steam:
- Potential Double-Top: A Double-Top pattern , a classic bearish reversal signal, appears to be forming at the upper boundary of the trading range.
- Elevated Volume: Typically in a bullish consolidation, volume tends to decrease. However, volume has remained relatively high during this phase, which at a potential peak, can be a sign of distribution (selling) rather than accumulation.
Conclusion and Key Triggers to Watch
Ixigo is currently in a state of equilibrium, and a breakout from the current range is required for confirmation of the next directional move.
- Bullish Trigger: A decisive close above the range's resistance would invalidate the Double-Top pattern and signal a continuation of the uptrend. This would open a path towards the ₹380 level.
- Bearish Trigger: A decisive close below the range's support would confirm the Double-Top pattern, suggesting the bullish momentum has faded and a correction towards the ₹275 level could be imminent.
Until either of these levels is breached, patience is warranted. The direction of the break from this consolidation will be the key to identifying the stock's next major trend.
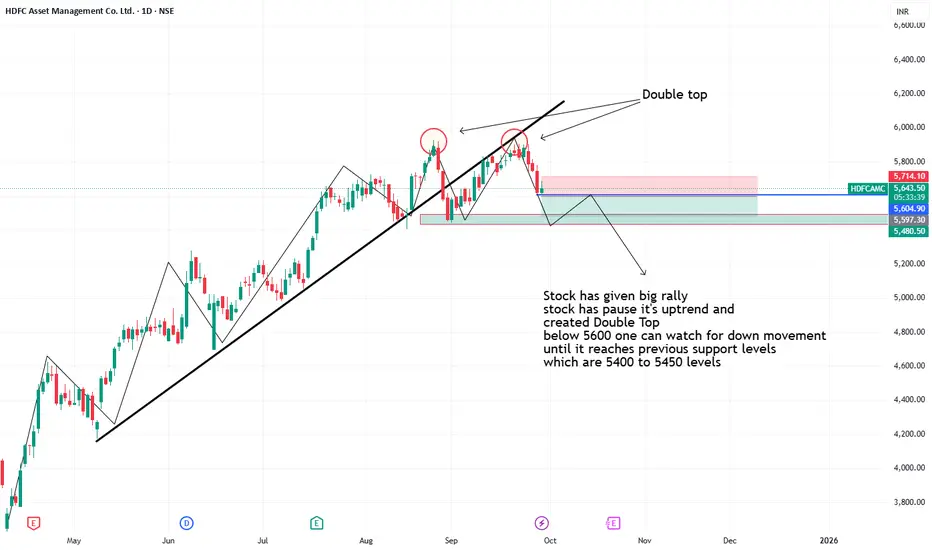
Hdfc created Double Top Formation- Stock has given big rally
- stock has pause it's uptrend and
created Double Top
- below 5600 one can watch for down movement
until it reaches previous support levels
which are 5400 to 5450 levels
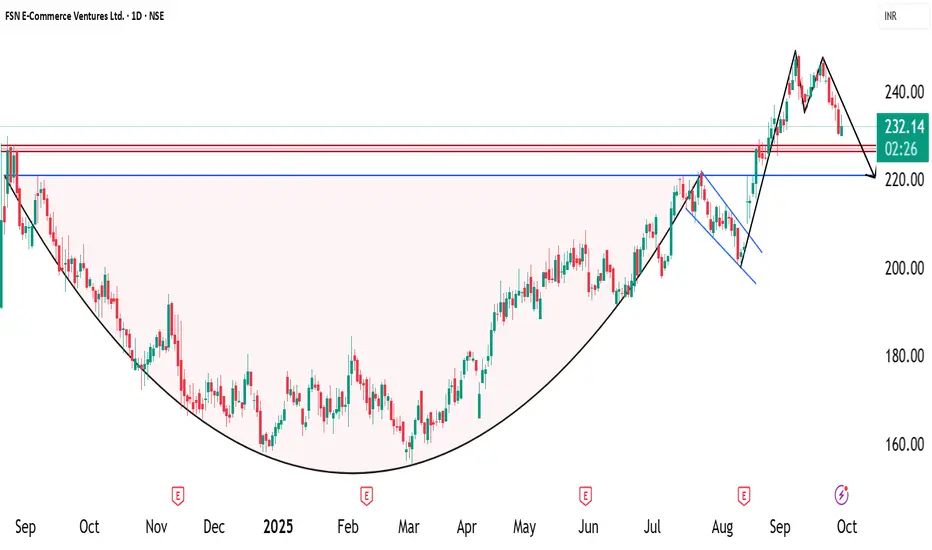
NYKAA - Cup with handle pattern📈 Pattern Analysis: Nykaa recently completed a "Cup-with-Handle Breakout" , which is a strong bullish continuation pattern. However, the breakout targets have not yet been achieved. In the past few sessions, the stock has witnessed selling pressure, forming a double-top bearish pattern on the chart.
📊 Key Levels & Structure: The price is currently in a corrective phase and may move lower to retest the breakout zone of the cup-with-handle pattern. This zone is expected to act as a strong support level and could provide a fresh opportunity for accumulation if the structure holds.
🔎 Momentum Indicators:
RSI has cooled off from overbought levels, creating room for the next leg of upside.
Volumes during the recent dip are lower compared to the breakout volumes, suggesting the decline is corrective rather than a trend reversal.
🎯 Projection & Outlook:
A successful retest of the breakout zone could resume the uptrend with upside targets around ₹ .... levels in the medium term. Failure to hold the support could, however, lead to extended consolidation.
⚠️ Disclaimer:
This is a technical projection, not an investment recommendation. Traders should manage risk carefully and align strategies with their financial objectives.
Double Top in SilverEntry- 143000-143200
Target- 142000, 141500, 141200
SL- Day high
Pattern - Double Top has been made in MCX silver and Comex silver in 1 hr and 15 min time frame.
Disclaimer- This is just for educational purpose.
Jai Shree Ram.

How to read market TOPS like a pro : Double & Triple TopsIn this video I will breakdown about the concepts of Double and triple tops, they aren’t just reversal signals — they’re blueprints of future price action. Here’s how to read market tops like a pro and anticipate what comes next.

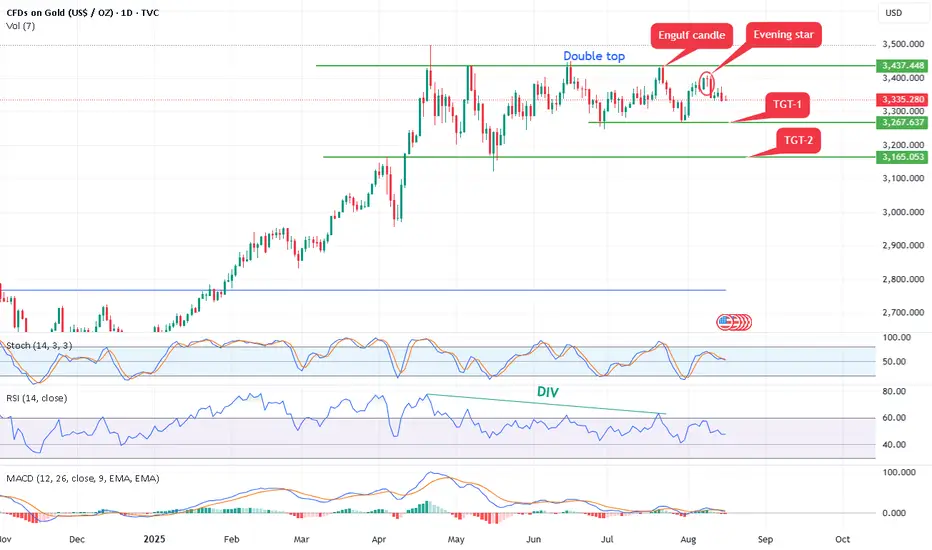
Gold form double top bearish pattern,Bearish Patterns Annotated:
Double Top: A classic bearish reversal pattern resembling an "M" shape. It occurs when price hits resistance twice at similar levels (here, approximately $3,437 and $3,448 in July and August) and fails to break higher. This signals potential exhaustion of buyers and a shift to sellers.
Evening Star: A three-candle bearish reversal pattern marked near the recent high. It typically consists of a large green candle (up day), followed by a small-bodied candle (indecision), and then a large red candle closing below the midpoint of the first candle. This suggests bulls are losing control.
Engulf Candle (Bearish Engulfing): A red candle that completely "engulfs" the body of the prior green candle, indicating strong selling pressure overriding previous buying. It's marked near the top, reinforcing the reversal theme.
Opportunity: - As per chart it can short 3380-3350 with stop loss 3400 above for the targets of double bottom pattern 3260 and 3160.
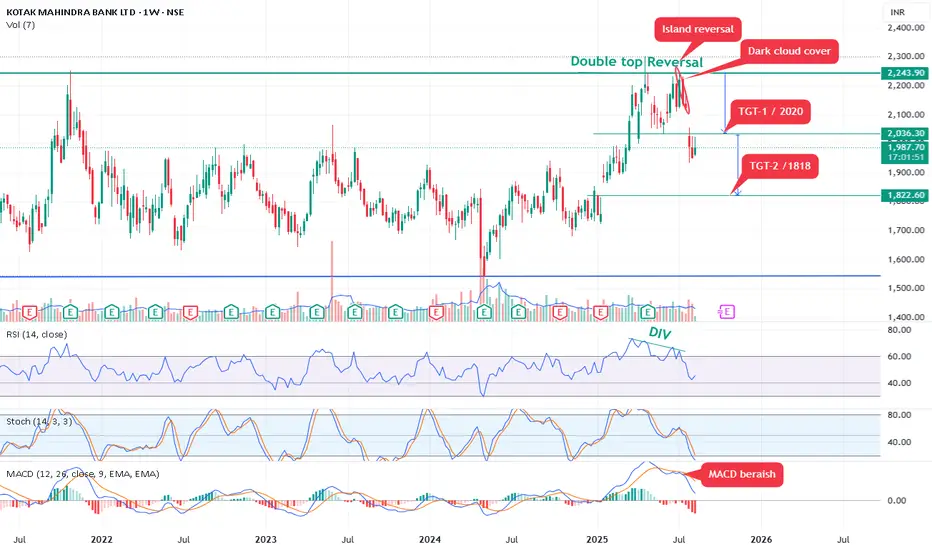
Kotak Mahindra bank form double top Reversal pattern.Kotak Mahindra bank form double top Reversal pattern.
Bearish View (Short Opportunity): The pattern suggests shorting on any rally back up to ₹2,020 (potential resistance or retest of the neckline/breakout level).
As per pattern is may test 1818 soon target -2.
Risk-reward ratio: Approximately 1:2-3, assuming disciplined stops.
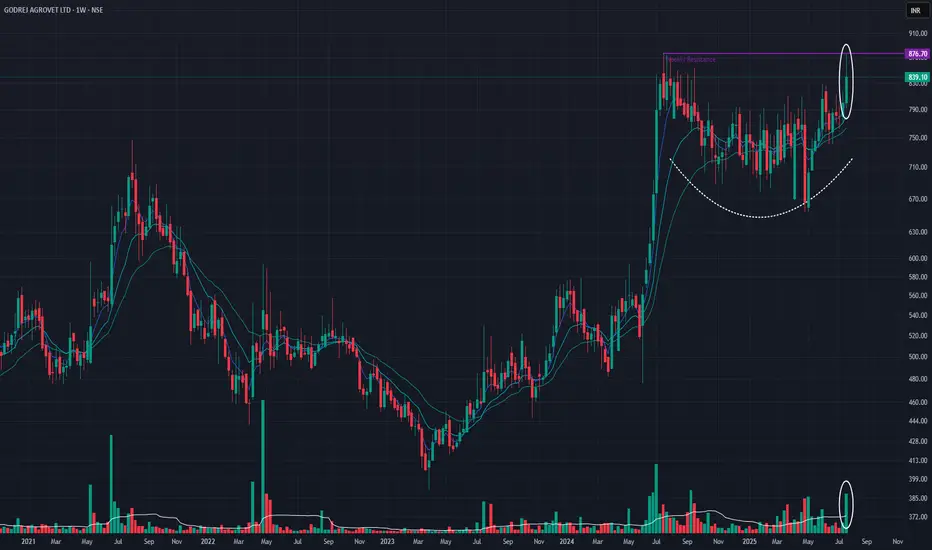
Godrej Agrovet Ltd (Weekly Timeframe) - Potential BreakoutSince the All Time High on Jul 15, 2024, the stock is in a Accumulation phase , and last week it tried to breach the ATH with Huge Volume . The stock may BreakOut of the Resistance Zone if Good Volume is available. If it is able to breach the resistance zone, then it may go to 1070 levels.
It is also possible that there could be some profit booking which means the stock could come down as well.
Keep monitoring.
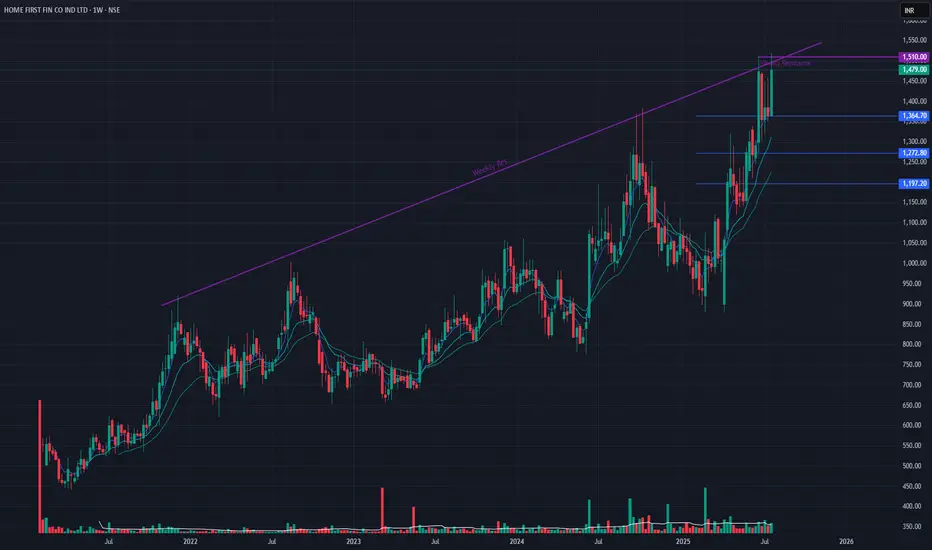
Home First Fin Co Ind Ltd (Weekly Timeframe) - Bearish SignsThe stock has been in an uptrend since Feb 2025 and since last few weeks, it has gone sideways showing some exhaustion. This week, it made an All Time High, breaking a Long-term resistance and Short-term resistance . There may be some profit booking in the coming weeks and may see the stock going down to the levels indicated, if it cannot maintain the upside momentum.
MRF - BEARISH SETUP (DAILY TIMEFRAME) DOUBLE TOPA double top pattern is a bearish reversal pattern that can be observed on a stock's price chart after an uptrend. It signals that the upward trend may be losing momentum and that a downtrend could be imminent.
Please sell if your setup agrees too - I will sell if 1,45,000 Levels is broken Your Boost and like will remind me to sell so please keep supporting so that this post reminds me to sell MRF at 1.45K levels

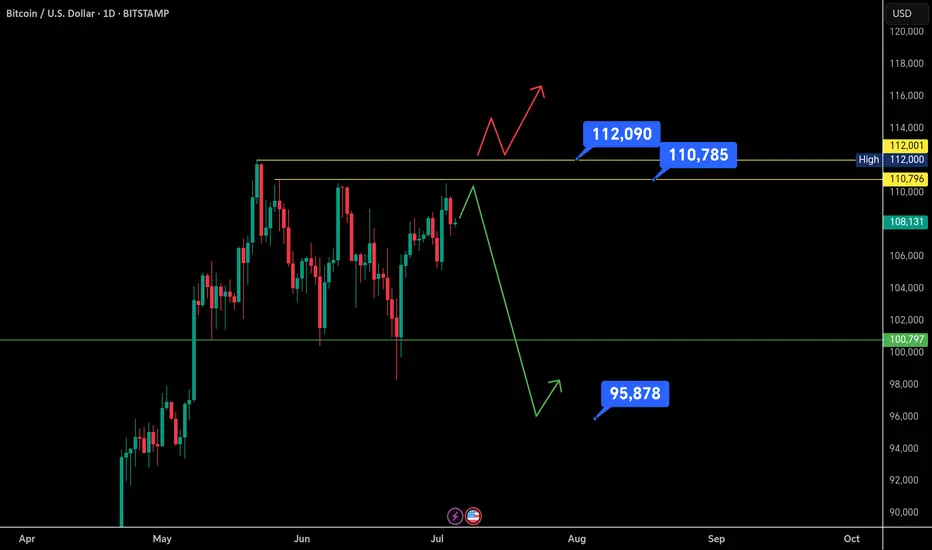
$Btc Summer Scenarios: Breakout or Breakdown?Bitcoin is currently forming higher lows, indicating bullish intent — but strong resistance around $110.6K continues to hold.
There are 3 key scenarios developing:
1. Double Top Formation: If BTC faces rejection again near $110.5K, a double top may form, leading to a potential drop.
2. Bullish Breakout: A successful breakout above both resistance levels could push BTC toward $116K–$120K.
3. Bearish Breakdown: If rejection happens earlier without retesting, BTC might crash directly to a lower low around $95K–$96K.
RSI indicates underlying strength, but until a decisive breakout or rejection confirms, traders should remain cautious and patient.
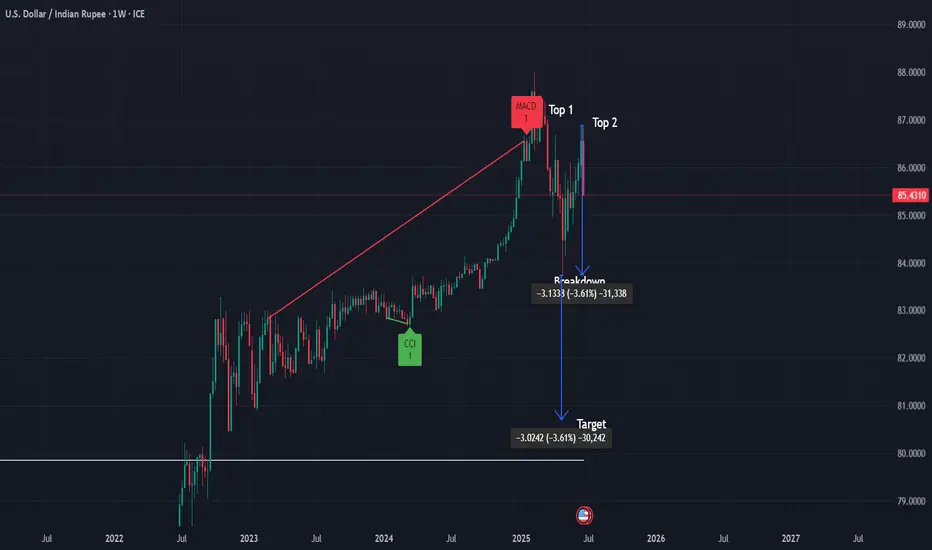
USD/INR Weekly Chart Analysis 📌 USD/INR Weekly Chart – Double Top Analysis
After a sustained uptrend, USD/INR is showing potential signs of a reversal with a well-defined Double Top pattern on the weekly timeframe.
✅ Pattern: Double Top (Weekly)
✅ Key Resistance: ~87.00 (tops)
✅ Breakdown Level: 83.76 (watch for confirmed weekly close below)
✅ Target Projection: ~80.76 (based on measured move)
✅ Stop-loss: ~84.70 (ATR-based level)
📉 Bias: Bearish on confirmed weekly close below 83.76 with increased selling volume.
🔎 Volume Note: Look for higher volume on breakdown to confirm selling pressure and pattern validity.
✅ Commentary:
This classic double top setup suggests potential trend exhaustion after an extended move up. A weekly close below the 83.76 neckline with strong volume would strengthen the bearish signal, targeting ~80.76 in the medium term. ATR-based stop-loss placement provides tactical risk management above recent support
End of the Drop? Tata Motors Sets Stage for Wave 3Tata Motors has completed a clear five-wave advance from the April low of 535.75 to a high near 742, which is being marked as wave 1. After that peak, the stock entered a corrective phase and has now dropped into what appears to be an a-b-c structure (expanding flat), likely forming wave 2. The recent decline has reached the 1.618 extension of wave a, with wave c possibly ending near 672.
This 1.618 level is often where deeper corrections tend to exhaust, and price has also moved below the lower edge of the Bollinger Band, which can signal short-term pressure easing. These two conditions together suggest that the current downmove may be ending. If this count is correct, the next move should be a fresh upward rally in the form of wave 3.
For this idea to stay valid, wave 2 must not fall below the April low at 535.75, which serves as the key invalidation level. Until then, the setup remains constructive, with early signs pointing to a possible bounce from here.
Disclaimer: This analysis is for educational purposes only and does not constitute investment advice. Please do your own research (DYOR) before making any trading decisions.
