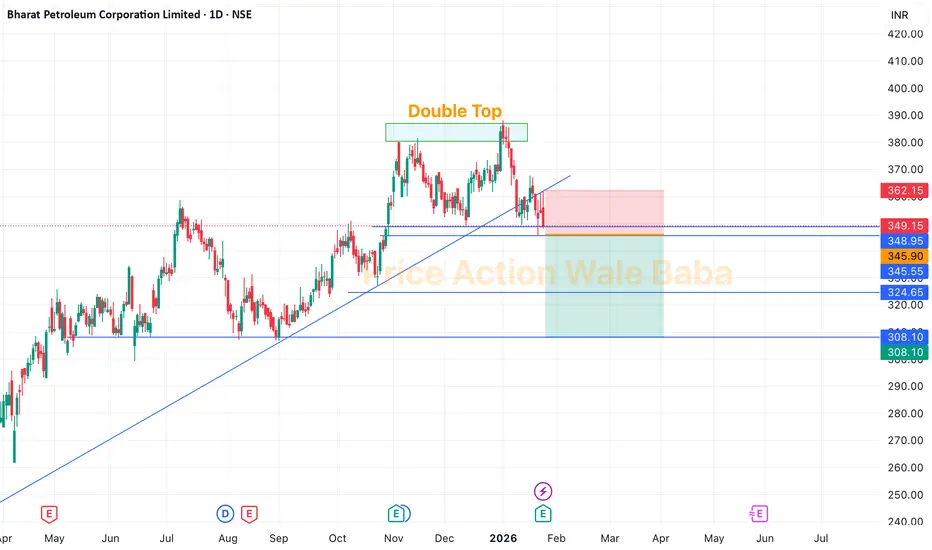
BPCL - Double TopBPCL is forming a Double Top which is has neckline of 345.
Delivery Based Selling Strategy:
Sell below 345,
Keep SL on high of 23rd Jan candle, which is 361.
Targets are 320-300.
Option Buying Strategy
So, for the option trading in this stock, you can choose any PUT option on BPCL, mark high of 21st Jan candle in option, once it breaks it just buy and keep SL below same day's low.
Doubletoppattern
Major Crash Ahead?The Diametric Pattern completed.
2-stage confirmation achieved.
The Major impulsive downtrend has begun - Unless there is a sharp reversal upside by next week.

KAYNES TECH: DOUBLE TOP ACTIVATEDKAYNES TECH 5900, double top pattern breakdown happening. top made at 7600 levels
PE RATIO at 100 which is expensive. Can see 4100 to 4200 in near term

Buy Mankind Pharma for 15% short term Mankind Pharma
Take entry Near 2600Rs
Target will be 3055( almost 16% upside)
Invest more at 2477
Mankind look likes very bullish
Double bottom pattern perform on up trendline.

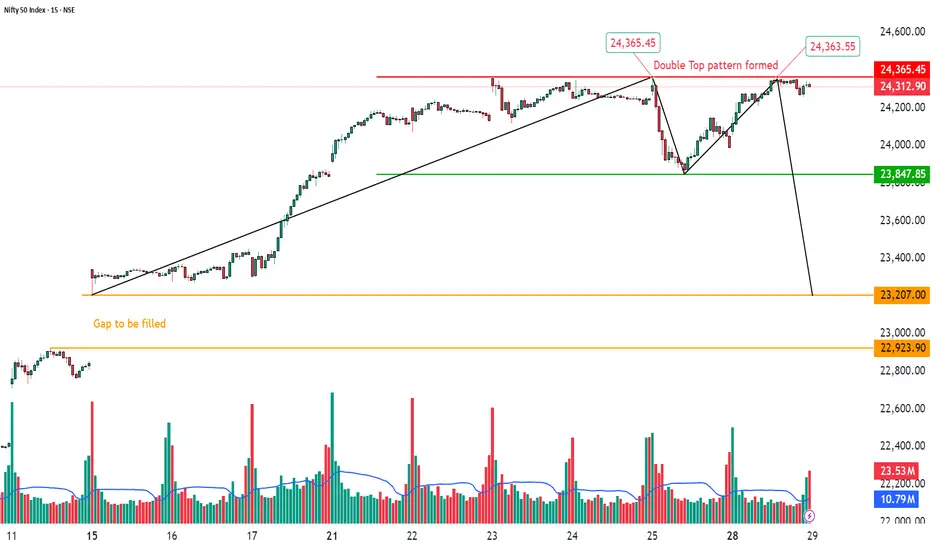
Double Top Pattern Formation with Gap Below | 15-Min Chart🏦 NIFTY 50 INDEX – Double Top Pattern Formation with Gap Below | 15-Min Chart
📅 Date: April 28, 2025
📈 Timeframe: 15-Minute
🔍 Index: Nifty 50 (NSE)
📌 Technical Overview:
Nifty 50 has formed a Double Top pattern on the 15-minute chart around the 24,365 zone, a classic bearish reversal structure.
The price faced rejection at the previous high, signaling caution. Immediate support lies at 23,847, and a breakdown below this level could open downside momentum toward the gap area visible on the chart.
🧩 Chart Pattern:
Double Top identified at 24,365 levels (marked in red).
Neckline support positioned at 23,847 (green line).
A black trendline breakdown already visible, strengthening bearish bias.
Below 23,847, focus shifts to the gap fill zone between 23,207 and 22,923 (orange highlighted).
🔍 Key Price Levels:
Resistance: 24,365
Immediate Support: 23,847
Gap Zone Support: 23,207–22,923
CMP: 24,312.90
A clear breakdown below 23,847 could accelerate the fall toward the gap area.
📊 Volume Analysis:
Increasing selling volume observed near the second top.
The breakout attempt was met with significant volume resistance, hinting at supply dominance.
🧠 Observational Bias:
As long as Nifty stays below 24,365 and breaches 23,847 decisively, bears may remain in control. Traders should watch for either a gap fill attempt or a possible bounce if price retests 23,847 from below.
Mastering the Double Top Pattern: A Guide to Profitable Trades!Hello everyone! I hope you're all doing great in life and in your trading journey. Today, I bring an educational post on Double Top Pattern —a crucial chart pattern that every trader must understand. Whether the market is rising or falling, recognizing key patterns like the Double Top can make all the difference in your trading success. Let’s break down how to spot it, trade it, and the opportunities it provides!
What is the Double Top Pattern?
Double Top is a bearish reversal pattern that typically forms after an uptrend. It consists of two distinct peaks at roughly the same price level, followed by a decline as the price fails to break through resistance. This is your cue that the market could be ready for a downtrend.
Identifying the Double Top Pattern
Peak 1 & Peak 2:
The first and second peaks should be nearly identical in price, signaling that the market is struggling to break through a certain resistance level.
Neckline:
The line connecting the lowest point between the two peaks. This is crucial because once the price breaks this level, the Double Top pattern is confirmed.
Volume Analysis:
Watch for decreasing volume during the formation of the second top and an increase in volume when the price breaks the neckline. This volume confirmation is key to spotting a reliable breakout.
How to Trade the Double Top?
Entry Point:
Once the price breaks below the neckline (support), this signals the start of the downtrend, making it the ideal point to enter a short position.
Stop Loss:
Protect yourself by placing a stop loss just above the second peak. This will shield you from potential false breakouts and unexpected reversals.
Target 1 (First Target):
Measure the distance between the peaks and the neckline. The same distance can be projected downward from the breakout point to estimate the first price target.
Target 2 (Second Target):
A secondary target can be calculated by extending the projection of the first target or using additional tools like Fibonacci retracements to set more precise exit points.
Key Takeaways for Success:
Volume Matters: A valid Double Top pattern is confirmed when the price breaks the neckline with strong volume.
Don’t Ignore Confirmation: Use indicators like RSI or MACD to back up the pattern. A confirmed downtrend ensures higher chances of success.
Trend Context is Crucial: Double Tops are most effective after a strong uptrend. The market's general trend should support a bearish reversal for the pattern to be reliable.
Example: A Double Top in Action
In the chart above, we can see a textbook example of the Double Top pattern. The price hits resistance twice and then breaks the neckline, signaling a potential bearish move. Keep an eye on the volume spikes and adjust your entry/exit strategy accordingly.
Ready to Trade the Double Top?
Make sure to look for the right conditions, and practice your strategy with a demo account before trading live. The Double Top can be a highly profitable setup when traded with patience and discipline!
If you found this post helpful, don’t forget to hit the like button!
Feel free to drop a comment with your thoughts or experiences regarding the Double Top pattern. Have you traded it before? How did it work for you? Let’s discuss and share insights!

Coal India. Buy the Dip?Stock: Coal India (COALINDIA)
Current Price: ₹385.05
Technical Analysis:
1⃣ Descending Channel: The stock is trading within a descending channel, forming a base with a potential double-bottom pattern.
2⃣Structure: Lower Lows (LL) and Lower Highs (LH). The overall market structure remains weak.
3⃣200-DMA: Stock is trading below its 200-day moving average, indicating caution for bullish momentum.
Trading Plan:
Entry: Above ₹400.30 on a breakout candle backed by 3x-5x volume.
Stop Loss (SL): ₹352.55 (closing basis).
Target Levels:
T1: ₹428.30 (7.00%, R:R 0.8:1)
T2: ₹458.50 (14.55%, R:R 1.6:1)
Positional T1: ₹517.20 (29.20%, R:R 3.7:1)
Positional T2 (ATH): ₹544.30 (36.00%, R:R 4.7:1)
Key Observations:
Dividend Payout: Suitable for long-term investors accumulating during dips.
Weakness Trigger: A weekly close below ₹360 could indicate further downside. Risky traders may short below this level.
RSI: Needs improvement to signal bullish strength.
Momentum Play: Not recommended for short-term traders. Wait for structural change above ₹400.
What to Watch During Breakout?
Volume Surge: Wide-range breakout candle backed by 3x-5x average volumes.
Sustainability: Ensure a close above ₹400 to confirm a breakout.
Disclaimer:
This analysis is for educational purposes only. Always conduct your own analysis and consult a financial advisor before trading. Trade responsibly and manage risks.

BITCOIN HEADED TO 50K ? - CRASH SOON ?Symbol - BTCUSD
CMP 60700
Bitcoin is testing the previous major liquidity area which is around 59300 - 61000. Earlier it was consolidating around 65K levels & was trading in a range. Now it is witnessing a huge profit booking and declining sharply towards the liquidity area. A retracement towards 62000 - 62500 is likely.
In any case, If it is breaking 59000 level and sustaining below it then it may directly head to 50-51K which is next major support.
A double top pattern is visible on larger time frame. Breakdown of this pattern will lead to trend change/reversal. Hence breakdown of the neckline & sustaining below it will activate this double top pattern & then it will definitely test 51K level & then may touch 45K levels too.
P.S. : I'm actively tracking BTCUSD to make long positions around this liquidity zone to play a retracement & then I'll be looking to short around 62K levels with small SL & will add more position on breakdown of liquidity zone/neckline.

BPCL, Technical OutlookThe price is strongly rejected by the LTMA band.
Also the formation of an Inverted Hammer Candle in the negative zone indicates a down move.
The price could test the levels of 565 and if broken then 535.
Disclaimer : This is my pre market analysis and my trading journal. Not a suggestion to buy or sell.

Nifty making Double Top PatternNitty making double top pattern on daily & weekly charts. Below 21700 this pattern get valid for target of 21300, 21011, 20888, 20555, 20222 December levels on 3 states election results & also fill the gaps between these levels. If Nifty close above 22222 levels then pattern become invalid & then we can see 22800 & above levels with election results prediction's. Thank you Trade with proper risk management.

Just A View - Double Top - DCMSHRIRAM📊 Script: DCMSHRIRAM
📊 Sector: Diversified
📊 Industry: Diversified - Mega
Key highlights: 💡⚡
📈 Script is trading near neck line that is support of Double Top pattern as seen into the chart .
📈 Script may take support at 862 level and bounce back from there.
📈 One can go for swing trade for medium to long term.
⏱️ C.M.P 📑💰- 872
⚠️ Important: Always maintain your Risk & Reward Ratio.
✅Like and follow to never miss a new idea!✅
Disclaimer: I am not SEBI Registered Advisor. My posts are purely for training and educational purposes.
Eat🍜 Sleep😴 TradingView📈 Repeat 🔁
Happy learning with trading. Cheers!🥂

AU Small Finance Bank Analysis! NSE:AUBANK Weekly Analysis!
Double Top Pattern Formation is AUBANK!
Double Top Pattern breakout in AUBANK!
RSI Divergence!
AUBANK crossed 50,100 and 200 EMA, will is leads towards further downtrend?
Analysis:( Only for Pattern Analysis )
NSE:AUBANK formed Double Top Pattern on a Weekly time frame. We can clearly see on the chart that previous trend was uptrend and Double Bottom ideally formed after an uptrend so it's a valid scenario to be move ahead with the Double Bottom or M Pattern. I have done complete analysis on the chart so please have a look on it.
Trade Psychology and Setup:
Entry = Current levels are not good for short(570-580)
Target = 495.70
Stop Loss = 674.95
Disclaimer = All my analysis is for Educational Purposes only.
Before entering into any trade -
1) Educate Yourself
2) Do your research and analysis
3) Define your Risk to Reward ratio
4) Don't trade with full capital

HDFC Life - Long ForecastThis Private Sector Insurer Company Looks good for short to medium term. Although this could test the patience of the investor as it could take time to achieve the target. Only the patient investor could indulge into this stock at CMP @ 581 with a SL @ 520 and TGT @ 700

Falling Trendline Breakout & Double Bottom Pattern in VoltasHello Traders, i have brought another analysis on a pattern breakout which called (Falling Trendline Breakout & Double Bottom Pattern Breakout). Well i have marked and written most of the things on chart, but still i am gonna to teach you here guy's about this pattern so if you see this next time, at least you guy's will be able to trade. So Let's start:-
Q:- What is Double Bottom?
Rahul:- It is a Bullish reversal pattern that appears after a defined downtrend and signifies a meaningful reversal on completion of the pattern. This Pattern is easy to spot on chart. It resembles with English letter "W". This pattern shows that sellers have lost the battle and the price is likely to go up from here on.
Now, a long entry could be taken once the price breaks the neckline o the upside, but guy's here we have not seen proper neckline breakout, But still momentum is bullish from here, so in the anticipation of neckline break, we have taken our best entry in the range of 880-850, and we have kept our stop loss at 778.
Guy's so this was the Double bottom pattern setup. So if you see this type of pattern in any stock you can trade now accordingly.
So now let's focus about company background.
Voltas is engaged in the business of air conditioning, refrigeration, electro - mechanical projects as an EPC contractor both in domestic and international geographies (Middle East and Singapore) and engineering product services for mining, water management and treatment, construction equipments and textile industry.
Market Cap
₹ 28,789 Cr.
Current Price
₹ 870
High / Low
₹ 994 / 737
Stock P/E
87.1
Book Value
₹ 165
Dividend Yield
0.49 %
ROCE
9.74 %
ROE
4.42 %
Face Value
₹ 1.00
Debt
₹ 651 Cr.
EPS
₹ 4.70
PEG Ratio
-5.52
Promoter holding
30.3 %
Intrinsic Value
₹ 126
Pledged percentage
0.00 %
EVEBITDA
42.8
Important levels for Voltas Ltd.
Buy in between 880-850.
Targets we can see 1047/1332/1460+
Keep Stop loss at 778
Price is above 200 EMA( Even we got Breakout of 200 EMA on friday session).
We have seen Proper Breakout of Falling Trendline Pattern and Double bottom also.
Price is sustaining above breakout trendline.
MACD and RSI has given bullish crossover (I have not placed RSI here as i want chart neat and clean but i have analysed already)
Disclaimer:- Please always do your own analysis or consult with your financial advisor before taking any kind of trades.
Dear traders, If you like my work then do not forget to hit like and follow me, and guy's let me know what do you think about this idea in comment box, i would be love to reply all of you guy's.
Thankyou.

NAUKRI LOOKS WEAK | SELL AROUND 4800Naukri (Infoedge) has formed a double top on daily chart which is a bearish pattern and expected to come towards 4520 and below levels until 5100 is intact on the upside.
To motivate us, Please like the idea If you agree with the analysis.
Happy Trading!
InvestPro India Team

Double Top - Hathway Double Top is formed in 4 Hours chart, if price break neckline, target would be 18 Rs.

Polyplex double bottom playerPolyplex double bottom player with bullish rsi divergence
can look for 1370-1380 in coming days with stop of
1090 on daily closing basis
dc : only for educational purpose

Micro cap company potential to double current price Stock chart show current price will be double stock price keeping 27-30 as Stop loss.
Company last 3 quater giving positive results
Positive of the company is giving UPI service by this company. Pramoter itself telling this company global 30% online money transfer using this company
No cash generating company
Operating cash flow is negetive

Varroc BreakoutVarroc now trade in double bottom breakout level. Once break and hold above next target mention in Chart.

COFORGE W pattern is about to breakCOFORGE W pattern is about to break can look for tp of 4691
with 1:1 risk reward ratio only for long term

HUL Analysis! W and Flag and Pole!HINDUSTAN UNILEVER ANALYSIS!
HUL Daily Analysis!
HUL Analysis with combination of Patterns and RSI!
Double Bottom Pattern Formation and Breakout in HUL!
Flag and Pole Pattern Formation and Breakout in HUL!
HUL has made Double Bottom pattern on daily timeframe it has given a breakout to the neck level and retested it's support level on the Neckline only. The interesting fact is, during it's retesting treading sessoins it has made Flag and Pole Pattern and also given a strong breakout. So we have combination of Patterns now with proper Breakouts and Retests. We can expect further upmove in HUL. Nifty also trending upwards.
Entry = Aggressive Investors can buy at current levels, Conservative investors can wait for small retest.
Stop Loss = Below 2577.65
Targets= 1) 2689.80 2) 2740.20 3) 2790.25 or 2827.35
Disclaimer = All my analysis are for Educational Purpose only. Before entering into any trade - 1) Educate Yourself 2) Do your own research and analysis 3) Define your Risk to Reward ratio 4) Don't trade with full capital

SBIN double top pattern opportunityAfter long bullish trend chart has tried to break 2 times resistance but it was failed as 600 / 590 / 580 / 575 has strong OI call writers. Event it was fall because of result came. so it looks like break down with M pattern then will back bullish trend back.

GujgasLTD Bearish OpportunityOn 2 hours timeframe it shows double top and max OI call righters. It can be good chance to take entry once it complete full solid red candle today.
