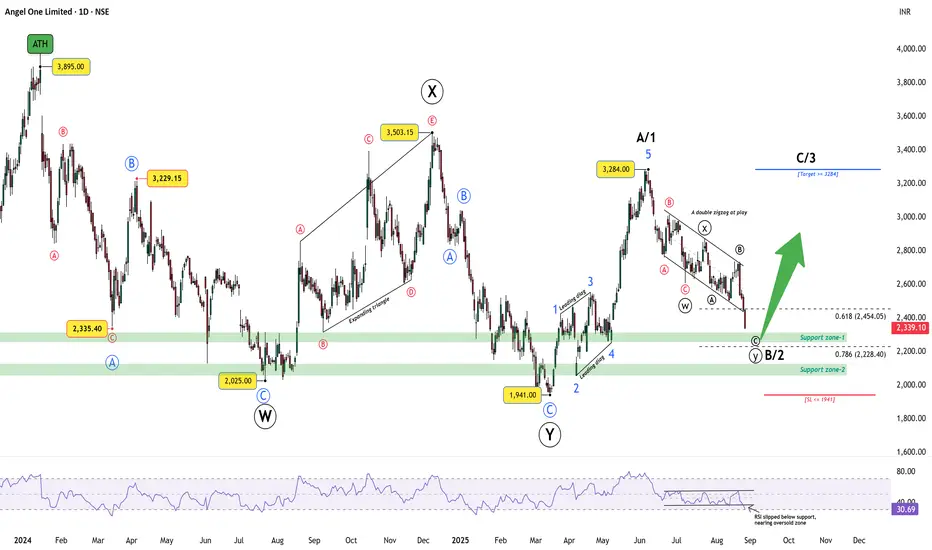
Angel One: Corrective pattern aligning for bounceAngel One topped at an all-time high of 3895 before entering a corrective phase. The decline into 2025 marked Wave W, followed by a rally into 3503 as Wave X, and then a fall to 1941 completing Wave Y. From there, the stock advanced to 3284, counted as Wave A/1 with a leading diagonal.
The decline since 3284 has unfolded as a double zigzag (W–X–Y) within a parallel bearish channel. Wave Y is testing key supports at 2454 (0.618 Fib) and 2228 (0.786 Fib). RSI is near the oversold band around 30, setting up the possibility of bullish divergence if price makes a marginal new low. The bullish view remains valid above 1941; a close below this level invalidates the count.
Trade Plan:
Bias: Expecting Wave B/2 to complete around 2228
Trigger: Watch for bullish divergence or reversal candles near support
Target: A break above 3284 would confirm Wave C/3
Risk: Stop loss at 1941
Disclaimer: This analysis is for educational purposes only and does not constitute investment advice. Please do your own research (DYOR) before making any trading decisions.
Doublezigzag
Crude Oil making Ending Diagonal in wave C of WXYCrude in WXY double zig zag correction. Currently wave C of Y in progress.
All internal waves of C wave are overlapping one another that leaves only one pattern to be considered as "Ending Diagonal" or falling wedge
Break of this pattern on upside would reverse price (at least temporarily as there is chance of Triple zig zag too)
Looking at wave 5 of C we can say it could make one more low below 86.82 but if goes too deep 77.5 then CHART Invalid.
Would wait for confirmation Above 95 to head towards 114 which is starting point of Ending Diagonal in wave C
DISCLAIMER:
There is no guarantee of profits or no exceptions from losses.
The stock and its levels discussed are solely the personal views of my research.
You are advised to rely on your judgement while investing/Trading decisions.
Seek help of your financial advisor before investing/trading.
Investment Warnings:
We would like to draw your attention to the following important investment warnings.
-Investment is subject to market risks.
-The value of shares and investments and the income derived from them can go down as well as up.
-Investors may not get back the amount they invested - losing one's shirt is a real risk.
-Past performance is not a guide to future performance.
-I may or may not trade this analysis
--------------------------(((((LIKE)))))-------------------------------

EWT: Will nifty hit 18000 before September end?Extending wave (5) should easily travel above 18000 and is likely to continue toward 18480.
Target 1: 18000
Target 2: 18142
Target 3: 18350
Target 4: 18480
Stay tuned for the next update.


Nifty Double zig zag correction Mar 2021Nifty made low 14350(Wave 2) this is nearly 0.618 fibonacci level(14297) of previous rally after budget from 13597 to 15432(Wave 1)
Since correction is deep this is double zig zag correction.
Upper channel line target comes around 15200.
Nifty made Piercing Line candle Stick on daily chart on Friday 19th Mar 2021.
Swing high 15337 break is confirmation of correction completion for 3rd wave least target 16185.
If channel and 15337 is not broken then there is possibility of Tripple Zig zag correction.
DISCLAIMER:There is no guarantee of profits or no exceptions from losses. The study provided is solely the personal views of my research. You are advised to rely on your judgment while investing/Trading decisions. Past performance is not an indicator of future returns. Investment is subject to market risks. Seek help of your financial advisors before investing/trading.
I may or may not trade this analysis
--------------------------(((((LIKE)))))-------------------------------
