Update on the previous EURUSD bullish setup idea.The price and market is following through almost as we expected , although the price made its new gap and support zone at : "1.18554" and is willing to go to our structural previous daily high at :1.19206.
So far it's still supporting our idea let's see if anything gets different or more precise.
DXY

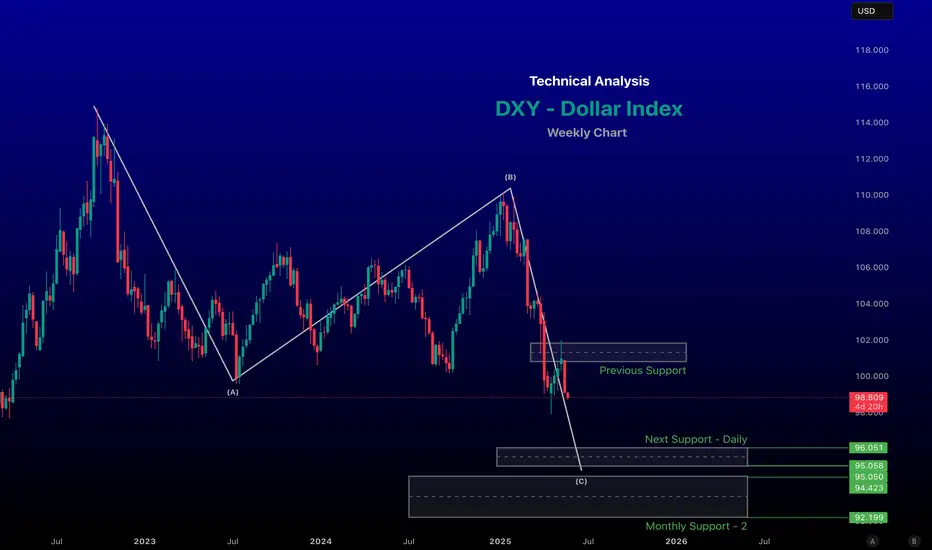
DXY Breakdown After Major Top – Wave v in ProgressThe DXY chart shows that the U.S. Dollar has completed a larger corrective structure and is now moving inside a new impulsive bearish phase. After forming a major top near the 110 area, the index started a clear five-wave decline, indicating strong downside momentum. The recent sideways movement looks like a corrective pause (wave iv / Y) rather than a trend reversal. As long as the price stays below the key resistance zone around 100–101, the overall structure remains bearish. This suggests the dollar is preparing for the final wave lower (wave v / 3), which could push the index toward deeper support levels. Overall, the Elliott Wave structure favours continued weakness in the U.S. Dollar in the coming months.
Stay tuned!
@Money_Dictators
Thank you :)

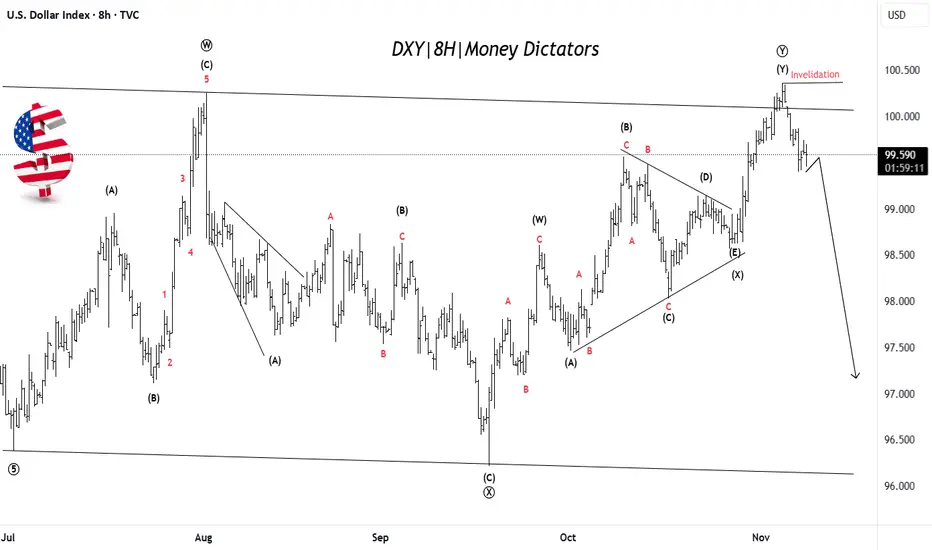
US Dollar Weakness Likely After Final Push UpDXY has completed a complex corrective W–X–Y pattern, with the final leg (Y) recently topping near the 100.50 zone. Price has failed to break above the invalidation level, suggesting the uptrend is losing strength. This signals that the dollar may have finished its corrective phase and could now start a fresh bearish wave targeting lower zones near 97–98. The overall structure indicates that momentum is shifting from bullish to bearish. In simple terms: rally is likely over → downside move toward new lows expected next.
Stay tuned!
@Money_Dictators
Thank you :)
Now the Buyer's trap on XAUUSD/Gold 16/10/25Last video, it was quite evident about the seller trap, and it gave a good 60USD run.
Now comes the example of a buyer's trap.
Technically, DXY is also set for a bullish run, hence prices are expected to pull back in GOLD/XAUUSD now.
The strategy for both sides of the trading plan is shared in the video.

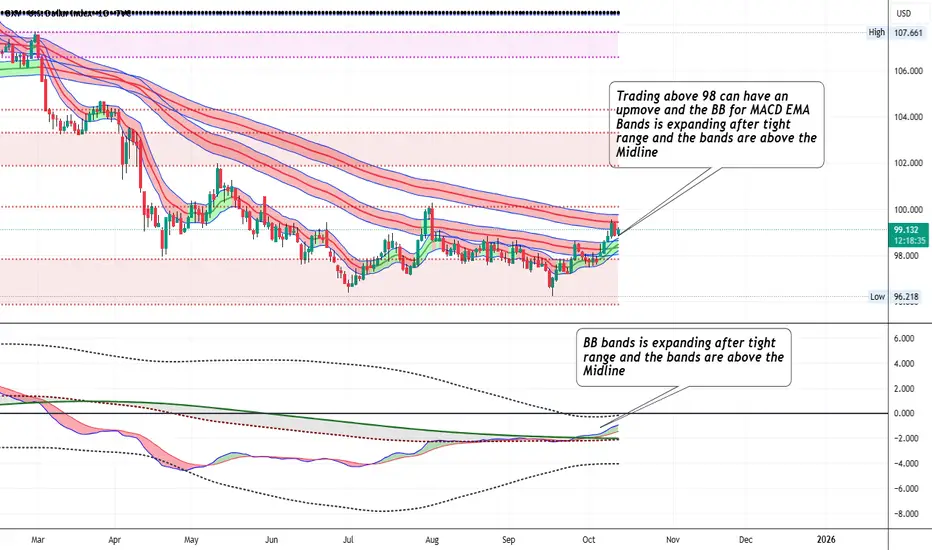
DXY - Trading above 98 can have an upmoveTrading above 98 can have an upmove and the BB for MACD EMA Bands is expanding after tight range and the bands are above the Midline
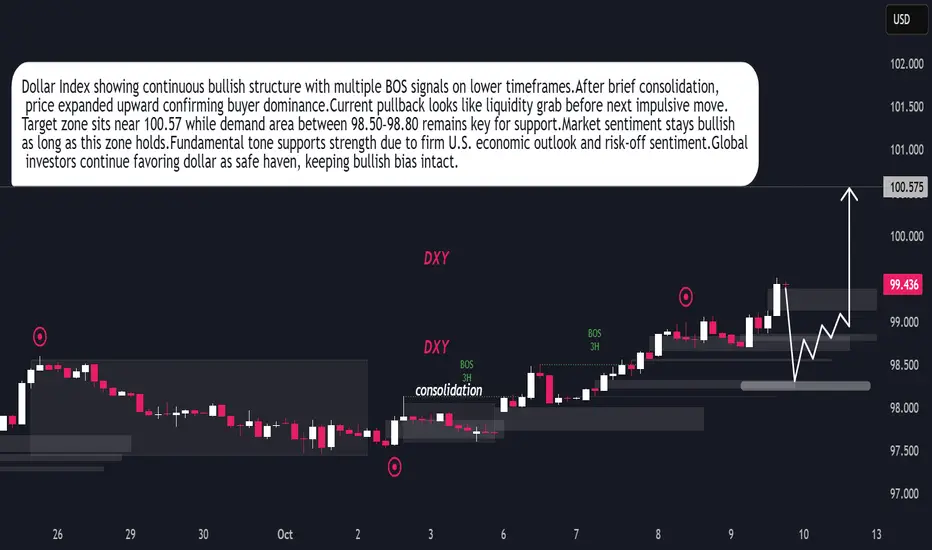
DXY Ready for Next Bullish Leg After Liquidity SweepDollar Index maintaining bullish structure after recent BOS on 3H timeframe.Market formed consolidation phase early October before expansion.Buyers showing control pushing price towards 100.57 objective.Current retracement indicates liquidity grab before next bullish impulse.Demand zone 98.50–98.80 remains key area for continuation.Technical sentiment stays positive as long as price holds above 98.50.Fundamentally, dollar supported by strong U.S. data and cautious global tone favoring safe-haven demand.Momentum outlook remains bullish with potential continuation toward 100.50+ zone.
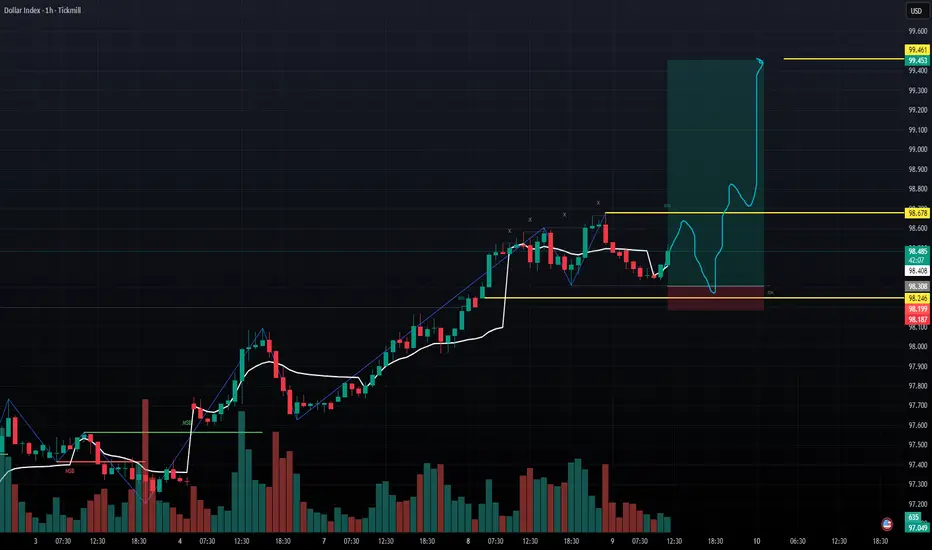
dollar index is showing strengthif go with dollar as seen in chart it is taking support from its bullish order block of the structure and liquidity sweep is pending if it takes liquidity and sweep the early buyers it has potential to hit the target with in 24 hours .
The Dollar’s Journey💵 The Dollar’s Journey – From Blastoff to Pause, and Maybe… Another Run?
Back in May 2021 , the Dollar Index (DXY) quietly started climbing. At first, nobody gave it much thought. But then 🚀 it took off—running from 89 to 114 in just over a year. That’s what traders call a parabolic move —fast, powerful, and impossible to ignore.
Then came September 2022 . The rally cooled off. The dollar stopped sprinting and instead moved sideways. For the next three years , it was all about patience. The index slipped as low as 95.5 , testing everyone’s nerves. Was the bull run dead, or just taking a breather? ⏸️
Here’s the twist: that low wasn’t random. It actually landed right on a major long-term trendline —a line that connects the tops of 2001, 2016, and 2020 . In other words, the dollar was pulling back to recharge at home base . 📉➡️📈
Now the picture gets exciting again. The correction looks done. The index is knocking on the door of 100 —and this number isn’t just psychological, it’s technical too. If DXY sustains above 100 ✅ , it could light the fuse for the next bull run 🐂💵 .
And remember, when the dollar moves, the world feels it:
* 📉 Global equities, especially emerging markets, often struggle.
* 🛢️ Commodities like gold and oil usually come under pressure.
* 💱 Other currencies—the euro, yen, pound—tend to weaken.
So here we are, three years after the peak. The dollar looks ready to decide its next chapter. Will it stay stuck in consolidation… or break out into a brand-new bull cycle? Traders, investors, and even governments are watching closely. 👀
The story of the dollar isn’t over—it might just be about to get interesting again. 📊✨

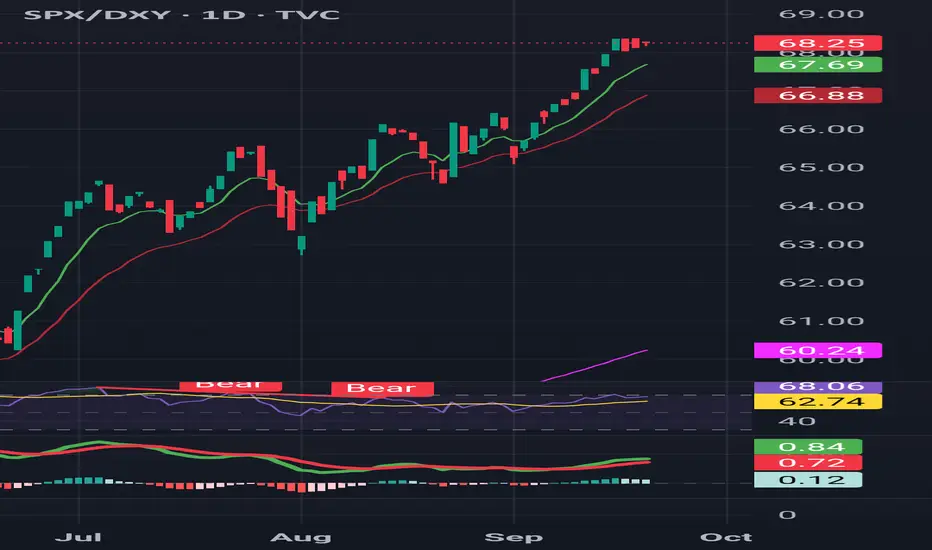
DXY/GOLD RATIO ANALYSIS The DXY/Gold ratio has been in a persistent downtrend, now testing deep lows. Momentum shows early signs of stabilizing, with RSI near oversold and MACD flattening.
⚖️ A rebound here could mean relative strength shifting back toward the Dollar over Gold. Keep an eye on follow-through.

SPY/DXY RATIOSPX/DXY remains at elevated highs, supported by bullish EMA alignment. But RSI has started rolling over, and MACD momentum is flattening.
⚠️ This suggests equities’ relative outperformance over the Dollar may be losing steam. Risk of a near-term pause or pullback is rising.
USD/JPY WEEKLY ANALYSIS: AIM BUY TO SWEEP FVG IN D1Market Structure Analysis
Trend: The overall market structure of USD/JPY is in an uptrend. This is confirmed by the higher highs and higher lows that have been established previously. However, the price has recently been trading sideways and consolidating within a wide range.
Order Blocks and Liquidity:
Sell Zone: The price has repeatedly failed to break above the recent high, creating a strong resistance zone from ~149.000 to ~149.200, which contains large sell-side Order Blocks. Above this zone is a large FVG (Fair Value Gap) and a key liquidity zone, making it an attractive target for buyers.
Buy Zone: Below the current low, there are two crucial support zones:
Imbalance & OB Buy: The price range from ~146.500 to ~146.900 contains an Imbalance (liquidity void) and a potential Order Block. This is a high-probability area that will attract the price to retrace and potentially trigger a bounce.
Lower OB Buy: Below the Imbalance, there is an even stronger buy-side Order Block (OB) at ~146.000, identified as a final strong support zone before the bullish structure is invalidated.
Breakout Points: A strong resistance line, referred to as "Break Davas Points," has been established at ~149.200. A definitive break and candle close above this level would be an extremely strong signal confirming the continuation of the uptrend.
Detailed Trading Plan
Based on the analysis above, there are two main trading scenarios:
Scenario 1 (Wait for Buy - Primary Plan)
Strategy: Wait for the price to correct lower to find a potential buy entry.
Entry:
Option 1 (Moderate Risk): Place a pending buy order in the Imbalance & OB Buy zone (~146.500 - 146.900).
Option 2 (Lower Risk): Place a pending buy order in the lower OB Buy zone (~146.000). This is the most ideal entry point.
Reasoning: These are strong support zones where "Smart Money" is highly likely to enter buy orders to push the price up.
Take Profit:
TP1: The FVG resistance zone at the top (~149.500).
TP2: The higher high (~150.500).
Stop Loss:
For Option 1: Place it below the Imbalance zone (~146.400).
For Option 2: Place it below the OB Buy zone (~145.800).
Scenario 2 (Breakout - Secondary Plan)
Strategy: Trade on the momentum of an upward breakout.
Entry: Wait for the price to break and close above the "Break Davas Points" (~149.200). You can wait for a retest of this zone before entering to increase safety.
Reasoning: A break of this resistance line confirms that buyers have fully regained control and are ready to push the price to higher levels.
Take Profit: Similar to Scenario 1, targeting the FVG zone and higher highs.
Stop Loss: Place it below the breakout point (below 149.200).
Note: The primary plan of waiting to buy at a strong support zone is safer and offers a better R:R (Risk-to-Reward) ratio. It's crucial to combine this plan with other confirmation signals (such as a reversal candlestick pattern) before entering a trade to maximize your probability of success.

EUR/USD WEEKLY ANALYSIS: Where Liquidity Zone Price Target On ? OANDA:EURUSD
The Previous Uptrend (around September 16-17):
The candles show positive Delta values (+5.64K, -2.97K, +174). Although the candle on the 17th had a negative Delta, the overall trend leading up to it was driven by buying pressure. The high volume numbers on the buy side (left) during this period confirm that buyers were in control, pushing the price up.
The Current Corrective Move (around September 18-19):
This is where the Footprint data becomes most interesting and confirms the pullback.
September 18th candle: This candle shows a significant negative Delta (-288). This is a strong signal that sellers have entered the market aggressively. While the total volume is high (77.84K), the imbalance is clearly in favor of the sellers. The large red numbers on the right side of the candle, especially at higher prices, show that sellers were dominating and pushing the price down.
September 19th candle: The price continues to drop, and the Delta remains negative, reinforcing the selling pressure. The high sell volumes at the top of the candle confirm that this is a sustained downtrend within the larger corrective move.
Confirmation for the Trading Plan:
The Footprint data perfectly complements the SMC plan. It shows that the current downward move is not random; it's a deliberate shift in order flow driven by aggressive selling. This validates our expectation that the price will likely continue its correction.
To execute the long trade from the BUY ZONE, we would need to see a reversal in this Footprint data. Look for a future candle that shows a positive Delta, or a significant increase in buy volume at the lower price levels, especially within the BUY ZONE of 1.1670-1.1690. This would indicate that "Smart Money" is stepping back in to buy, confirming our entry.
In short, the Footprint data confirms the bearish pressure driving the current correction. It tells us not to rush into a buy and to wait for a clear shift in order flow to validate an entry.
Market Structure Analysis
Change of Character (ChoCH): The price shifted from a downtrend to an uptrend by breaking the previous high, which is marked as "ChoCH". This is the first signal indicating a change in the trend.
Break of Structure (BOS): After the ChoCH, the price continued to form higher highs and higher lows. A strong upward move broke the most recent high, creating a new "BOS". This confirms that the uptrend is continuing.
Current Trend: The current market structure is bullish. The price has created a new high (HH) and is now in a corrective phase, pulling back to find a strong support zone.
Analysis of Key Zones
Based on the market structure, there are key zones to watch:
BUY ZONE:
Location: The price range is from ~1.1670 to ~1.1690.
Significance: This zone is a crucial Order Block (OB). It was formed by the last candle before the price started its strong upward move, breaking the structure (BOS). According to SMC logic, this is where "Smart Money" placed large buy orders to push the price up, and the price is highly likely to retrace to "fill" the remaining orders. This is the most potential entry point for a long position.
SELL ZONE:
Location: The price range is from ~1.1820 to ~1.1840.
Significance: This zone is an Order Block and may also contain an Imbalance (liquidity gap). The price has already pulled back and had a minor reaction to this area. This is a temporary resistance zone. If the price continues to correct lower towards the "BUY ZONE", it will break through this area.
Liquidity and Stop Loss Zones:
Stop Loss (HH): The stop loss for a potential short trade would be placed above the highest peak (~1.1900).
Stop Loss (LL): The stop loss for a potential long trade would be placed below the lowest low (below the "BUY ZONE", ~1.1640). This area holds liquidity for buy orders placed here. If the price breaks this zone, the bullish structure could be invalidated, and the trading plan needs to be reconsidered.
Trading Plan
Based on the analysis, there are two main scenarios for trading EUR/USD:
Primary Scenario (Long Trade):
Strategy: Wait for the price to continue its corrective pullback.
Entry: Place a pending buy order in the BUY ZONE (~1.1670 - 1.1690).
Reasoning: This is the strongest Order Block zone, where the price is highly likely to reverse to continue the uptrend.
Take Profit:
TP1: The nearest high, above the SELL ZONE (~1.1840).
TP2: The current highest peak (~1.1880).
TP3: The liquidity zone above the high (HH) (~1.1920).
Stop Loss: Place it below the lowest low (LL), which is below the BUY ZONE (~1.1640).
Alternative Scenario (Short-Term Short Trade):
Strategy: Based on the current correction.
Entry: Consider a short-term sell trade when the price hits the SELL ZONE (~1.1820 - 1.1840).
Reasoning: This is a temporary resistance zone that could push the price down to fill the BUY ZONE below.
Take Profit: The BUY ZONE (~1.1670).
Stop Loss: Place it above the nearest peak within the corrective phase (~1.1860).
Important Note: The long trade scenario (primary plan) is more reliable because it aligns with the main market trend. The short trade scenario should be considered a short-term, higher-risk trade. Always follow proper risk management principles and only enter a trade with clear confirmation signals (e.g., a reversal candlestick pattern or a clear reaction to the key zones).

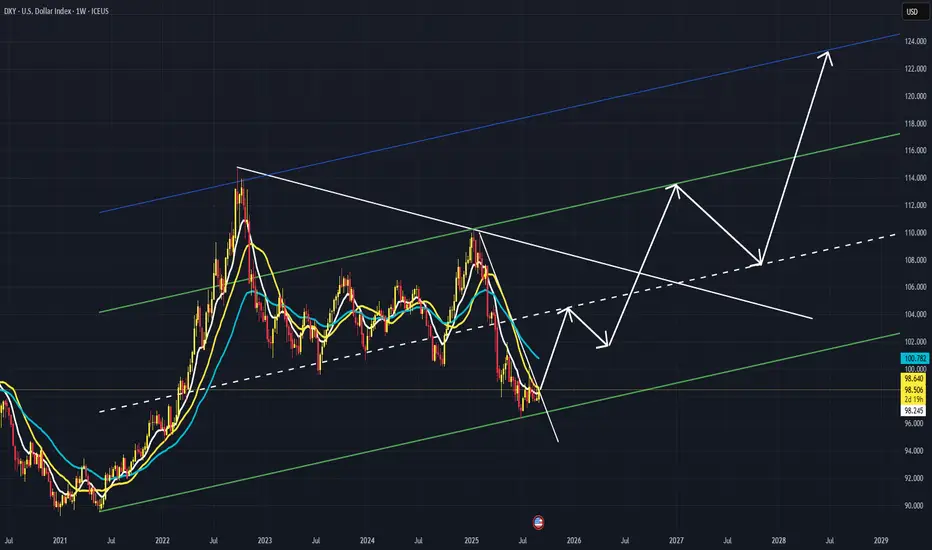
Can DXY make it to 125?Interesting thought as geopolitical forces gather and discuss the fate of USA ... Can DXY make it to 125 in a 5 wave rise in next 3 years or so?
GOLD 29/08: Monthly Candle Closing. DON’T BUY FOMOGold is sitting at a crucial level. As the monthly candle closes, traders must avoid emotional entries. With Smart Money Concepts (SMC) and Elliott Wave Theory, here are the clear trading zones to watch.
🔎 Market Structure (SMC + Elliott)
Elliott Wave: Waves III – IV – V completed. Wave V hit the D1 trendline, showing signs of exhaustion.
SMC Insights:
Multiple BMS (Break of Market Structure) → institutional liquidity play.
EQH (Equal Highs) & EQL (Equal Lows) → liquidity pools ready to be taken.
Demand Zones:
3398 – 3396 (EQH + BMS support)
3372 – 3370 (EQL / deep liquidity sweep)
Resistance: D1 trendline remains the key dynamic cap.
📌 Trading Plan
Scenario 1 – Short-term Sell (Counter-trend):
Entry: 3319 – 3321
SL: 3327
Target: 3398 – 3396
Scenario 2 – Buy at Demand Zone 1 (Main Setup):
Entry: 3398 – 3396
SL: 3390
Target: 3410 – 3415
Scenario 3 – Buy at Demand Zone 2 (Deeper Sweep):
Entry: 3372 – 3370
SL: 3365
Target: 3400 – 3410
✅ Best Risk–Reward setup with liquidity sweep + Elliott retracement.
✅ Conclusion
Bias: Still bullish in the bigger picture.
Risk: Expect liquidity sweeps before continuation.
Advice: Don’t chase price. Wait for demand zone confirmations.
Focus: Safer buys from 3398–3396 or 3372–3370 instead of impulsive FOMO buys near highs.

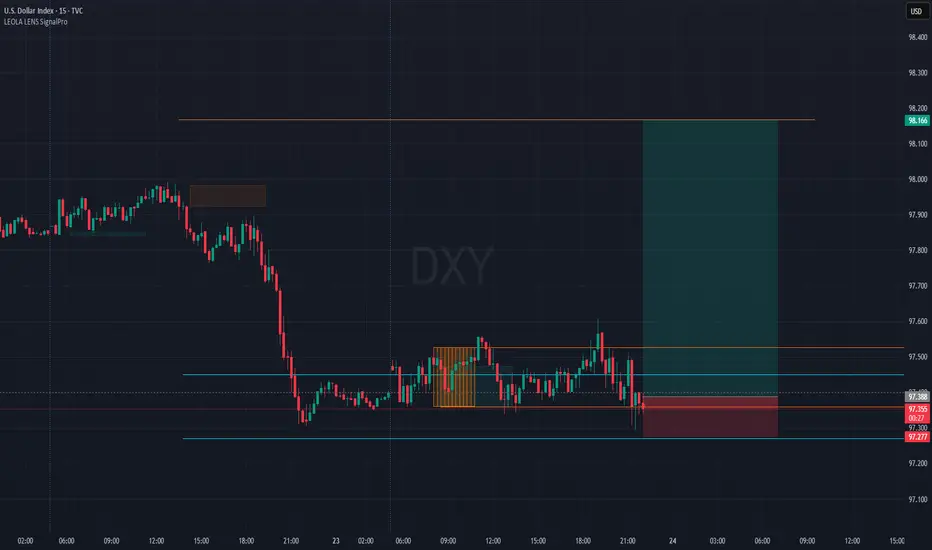
DXY Range Break Attempt- Can the Dollar Regain Control?DXY showing signs of life after an extended sideways compression near key structure lows.
Price reacting from SignalPro’s Liquidity Control Zone, hinting at possible bullish shift.
📈 Long setup framed with:
Retest of lower zone holding above 97.28
Targeting upper imbalance toward 98.166
🟧 Previous caution label reflected indecision phase – now resolving with fresh push attempt.
Key Technical View:
🔹 Tight range breakdown rejected, forming potential bear trap
🔹 SignalPro highlights entry zone clarity and risk-defined setup
🔹 Bullish continuation scenario valid above demand zone hold
🧠 Chart for learning purposes only.
📊 Tool: Leola Lens SignalPro | ⏱ Timeframe: 15m
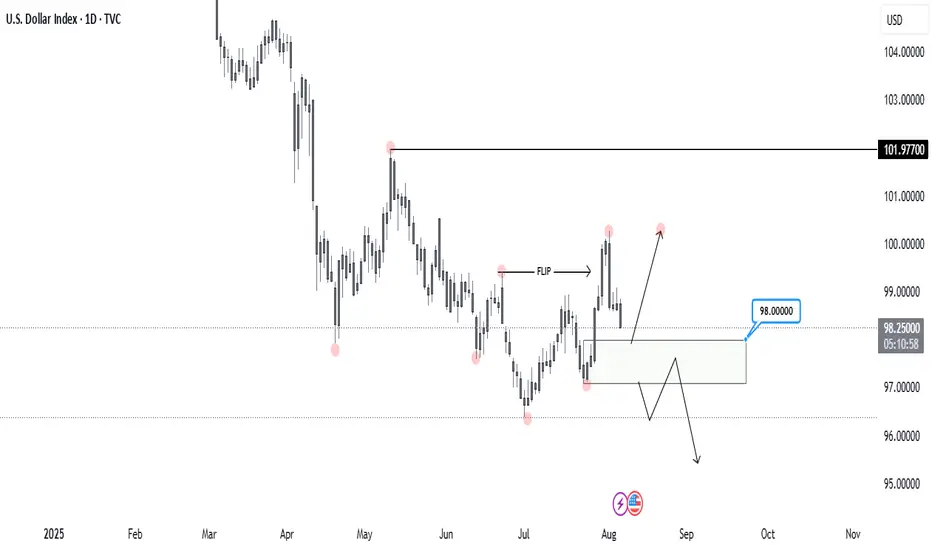
DXY, DAILYLet’s take a look at DXY on the Daily timeframe.
Price recently broke the previous Higher Low, flipping the structure to the downside. This marks a significant shift in momentum.
Now, I'm watching the 98.000 level, which I’ve identified as a Daily Demand Zone. It’s the origin of the move that broke the previous bearish structure, making it a key area of interest.
I’ll be waiting for a reaction from this zone to see if buyers step in again ( most likely ) or if the bearish momentum continues.
That would be my confirmation for xxx/usd shorts.
DXYAs you can see, this is the US Dollar Index (DXY) on the 15-minute chart. Coming down from the higher timeframes, the macro bias on DXY remains bearish. While fundamentals will, of course, play a key role, technically speaking, after a strong move to the upside, it's natural for price to retrace lower—whether as a correction before continuing higher or potentially beginning a deeper move down.
📉 What I'm Watching:
If price reacts from the current zone and starts dropping, this could serve as extra confirmation for potential XXX/USD buys.
If that setup doesn't play out here, I'm still expecting a similar scenario—just slightly higher, possibly from within the daily supply zone.
Either way, I'm remaining patient and letting price show its hand.
Have a great week ahead!
Blessings! 🙏

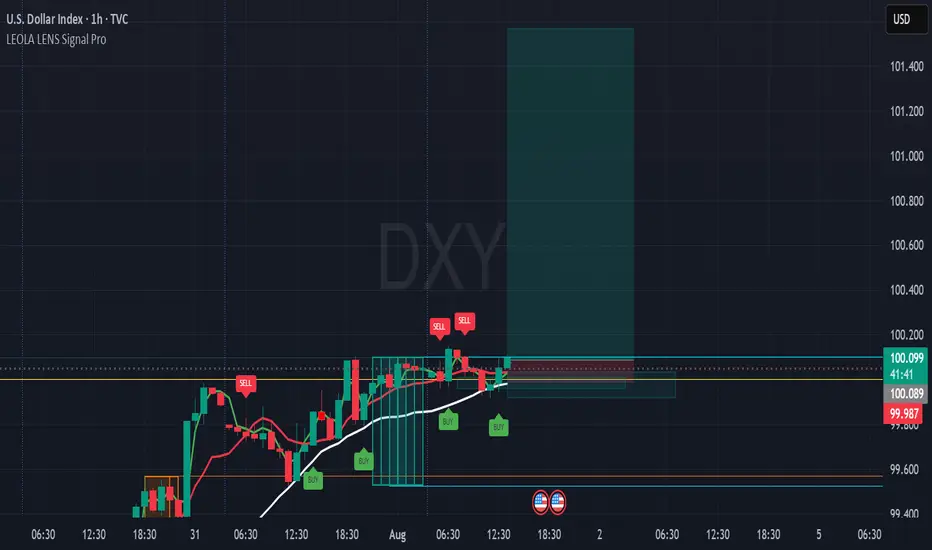
DXY Long Setup Forming After Structure Reclaim-101.567This intraday chart on DXY (U.S. Dollar Index) showcases a structure-aware long setup using Leola Lens SignalPro on the 1H timeframe.
⚙️ Key Technical Highlights:
🟢 Multiple BUY signals appeared near 99.98–100.00 zone after reclaiming short-term structure.
⚪ Price holds above the white adaptive base trendline — suggesting support strength.
🟥 Liquidity Control Box defines a clear invalidation zone under 99.98.
🔁 Prior SELL signals failed to follow through, indicating weakening bearish momentum.
📊 Target projection: 101.567 (based on structural extension and signal alignment).
📌 What to Monitor:
🔎 A decisive candle close above 100.10–100.15 can confirm bullish intent.
🎯 Reward-to-risk favored on clean setups post-breakout, aligning with momentum model.
📉 Invalid if structure re-breaks below base zone with volume.
⚠️ Educational use only. Not financial advice. Structure zones visualize behavior — not prediction.
🔐 Invite-only tool — access details in author bio.
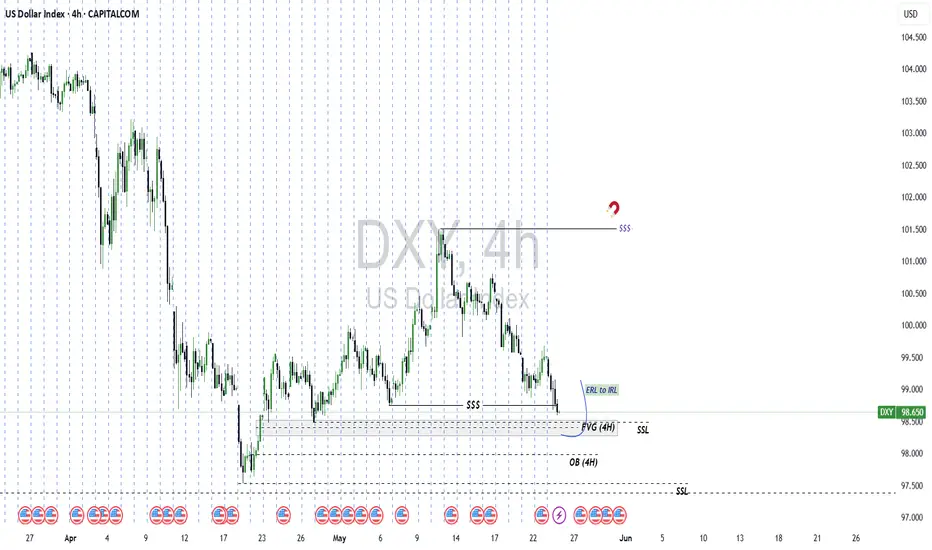
Technical Analysis of DXY (US Dollar Index) for the Week of May # Current Price Action and Market Context
Recent Price Movement: As of May 23, 2025, the DXY closed at approximately 99.11, down 0.85% from the previous session's close of 99.96. The index has been trending downward, testing two-week lows near 99.14 after failing to reclaim the 100.50 level.
Bearish Momentum: The break below 97.50 on the monthly chart signals a bearish structure with lower highs and lower lows, suggesting continued selling pressure. The next major downside target is around 96.00, with a potential longer-term target near 92.00.
Key Fundamental Drivers: Recent weakness in the DXY is attributed to President Trump’s proposed 50% tariffs on European imports, which have undermined bullish momentum in the dollar. Additionally, anticipation of Federal Reserve interest rate decisions, upcoming US inflation data, and employment reports (e.g., Non-Farm Payrolls) will play a significant role in the DXY’s direction.
-- Chart for your reference --
-- Disclaimer --
This analysis is based on recent technical data and market sentiment from web sources and X posts. It is for informational purposes only and not financial advice. Trading involves high risks, and past performance does not guarantee future results. Always conduct your own research or consult a SEBI-registered advisor before trading.
US Dollar to bounce? DXY Longs and EU shorts on the table.1. Based on the technical analysis, it seems that the US Dollar will have bounce after all. A quick liquidity purge near the SSL levels might be on the checklist. Nonethless, I'll be looking forward to EU shorts this week.
2. There is also a divergence between EU and GU on HTF. GU has shown liquidity purge on BSL which EU hasn't.
DXY Bearish Setup: Sell from Supply Zone to 99.100 TargetTrend: 📉 Bearish Bias
Key Zones & Strategy:
🔶 Supply Zone (Sell Area)
📍 100.584 – 100.906
⚠️ Price may face selling pressure here
🔵 Entry Point:
🎯 100.584 (bottom of supply zone)
🔴 Stop Loss:
❌ 100.906 (just above resistance)
🟢 Target Point:
✅ 99.100
📉 Aligned with lower support line
Technical Indicators:
📏 Descending Channel
🔽 Price moving within parallel downward trend lines
📊 EMA (70) – Orange Line
🔁 Acting as dynamic resistance
Trade Setup Summary:
📌 Sell in the Supply Zone
🛑 Stop Loss: 100.906
🎯 Target: 99.100
⚖️ Good Risk-Reward Ratio
Warnings & Tips:
⚡ Watch for Breakouts:
If price breaks above 100.906 ➡️ 📈 Bearish idea invalid
📰 Check News Events:
FOMC, CPI, or other USD events may cause volatility

PLAN BUY ETH NEW WEEK✅ Scenario 1 – Buy at 1830 (Current Price):
Reason to Buy:
Price is close to the EMA 20 and EMA 33 levels – acting as dynamic support.
The 1830–1845 area has been tested multiple times without a clear breakdown.
The upward trendline from the 1720 low is still being respected.
The market may be forming a tight consolidation, preparing for a breakout.
Trading Plan:
Buy Entry: 1,830 USDT
Stop Loss (SL): below 1,800 (around 1,790–1,795)
Take Profit (TP): 1,980 – 2,150 (previous highs and major resistance zone)
Risk/Reward Ratio: Approximately 1:2.5 to 1:4 (excellent if breakout confirms)
⚠️ Scenario 2 – Buy at 1,740 (If Current Trendline Fails):
Reason to Buy:
The 1,740–1,760 zone is a strong support from the longer-term ascending trendline (black line).
Coincides with the EMA 200 on the 4H timeframe – a typical retracement zone during pullbacks.
Potential for a double-bottom pattern if price reacts positively here → forming a higher low.
Trading Plan:
Buy Entry: 1,740 USDT
Stop Loss (SL): below 1,700 (around 1,695)
Take Profit (TP): 1,920 – 2,000 – 2,150
Risk/Reward Ratio: Greater than 1:3 if ETH maintains its higher-low structure
🧠 Strategy Notes:
In both scenarios, ETH must break through the psychological resistance of 1,850–1,880 to confirm bullish momentum.
Volume during the current accumulation phase is relatively low, signaling a potential breakout waiting to happen – watch for large-volume candles on H4/H1.
The long red candle near 1,800 might have been a “bear trap” if the price doesn’t break below recent lows.

USD INRHello & welcome to this analysis
USDINR topped out on 10th Feb @ 88 to see a sharp reversal all the way till 4th April when it formed a bullish Harmonic Deep Crab pattern @ 85 that too lead to a more sharper bounce back till 9th April when it formed a bearish Harmonic Reciprocal ABCD pattern near the top end of the slanting channel.
From there we have witnessed yet another steep downward move which is currently resting at the lower end of the slanting channel. Failure to hold 84.45 - 84.35 could lead to a further downward move till 83.70 where it would attempt to form a bullish Harmonic ABCD pattern that could coincide with DXY bullish harmonic pattern near 95.
So if you have exposure to currency for any reasons whatsoever - overseas trips, college fees, business, commodities trading, etc - this might be of help to you.
Disclaimer - Not a trading advise, kindly do your study carefully before taking a decision
