U.S Doller Index ( DXY ) - EW Analysis Doller Index weekly analysis forming leading diagonal pattern completed now in correction phase and C wave (impulse) target possible at $ 87.5
Dxyindex

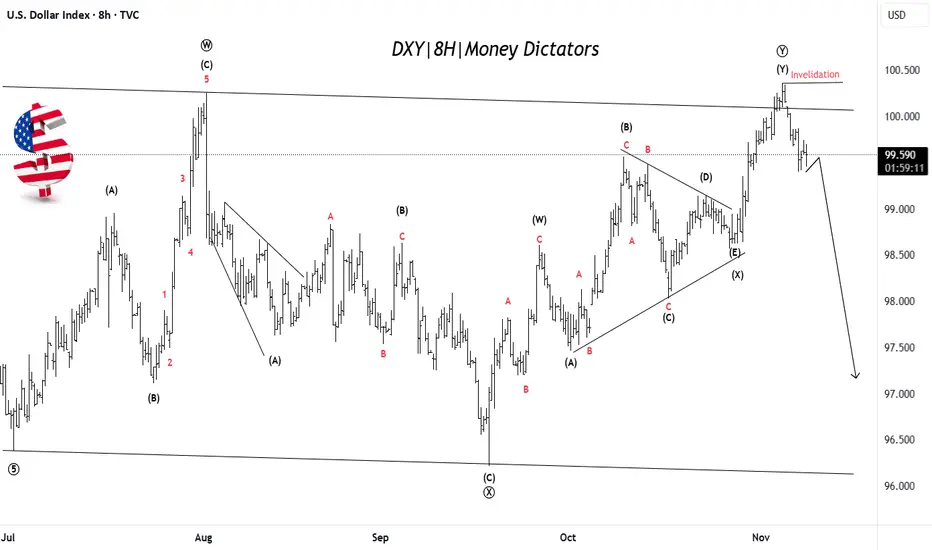
US Dollar Weakness Likely After Final Push UpDXY has completed a complex corrective W–X–Y pattern, with the final leg (Y) recently topping near the 100.50 zone. Price has failed to break above the invalidation level, suggesting the uptrend is losing strength. This signals that the dollar may have finished its corrective phase and could now start a fresh bearish wave targeting lower zones near 97–98. The overall structure indicates that momentum is shifting from bullish to bearish. In simple terms: rally is likely over → downside move toward new lows expected next.
Stay tuned!
@Money_Dictators
Thank you :)
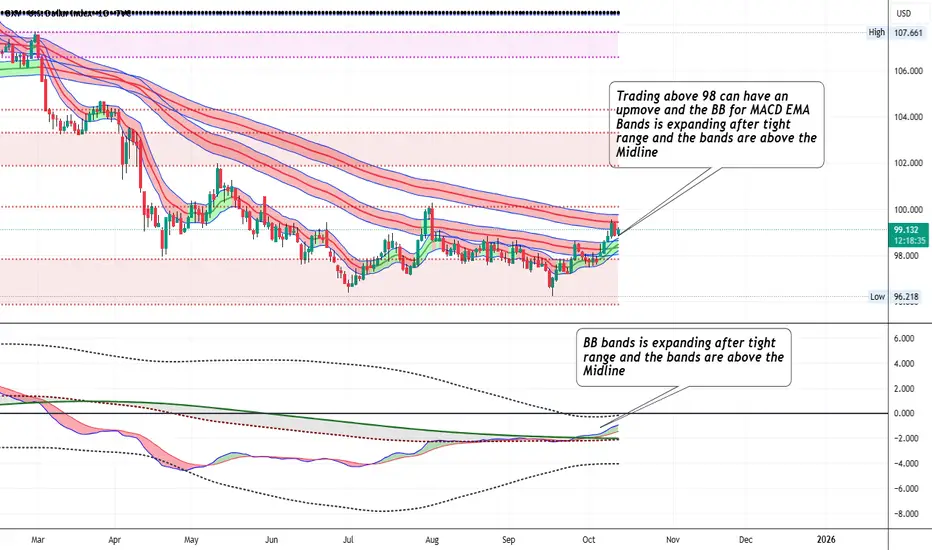
DXY - Trading above 98 can have an upmoveTrading above 98 can have an upmove and the BB for MACD EMA Bands is expanding after tight range and the bands are above the Midline
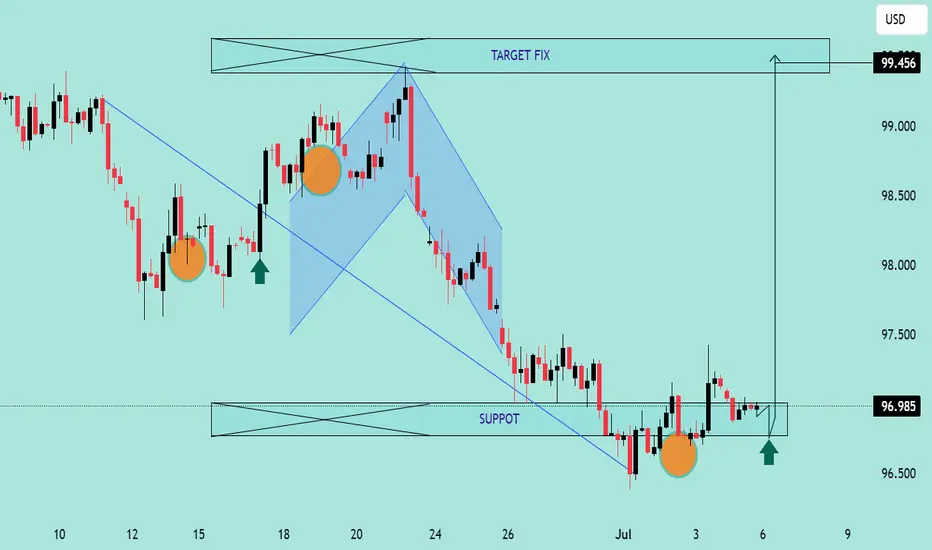
DXY Potential Bullish Reversal – Target 99.456DXY Potential Bullish Reversal – Target 99.456 🎯
Technical Analysis Overview:
🔹 Trend Structure:
The chart illustrates a recent downtrend, which has been broken as price moved above the descending trendline, signaling a potential trend reversal.
🔹 Pattern Insight:
A bullish harmonic pattern is visible (possibly a bullish Bat or Gartley), with the price reacting from the PRZ (Potential Reversal Zone), aligning with key support near 96.500. The market has respected this zone multiple times, evident from the orange highlighted circles showing price rejections.
🔹 Support & Resistance:
Support Zone: ~96.500
Breakout Zone: ~96.985 (current consolidation near this resistance)
Target Zone: Marked at 99.456, which aligns with previous structure and fib projection.
🔹 Market Sentiment:
Price is consolidating after breaking the downtrend, forming a bullish rectangle (accumulation). The green arrows indicate bullish intent from buyers defending support levels.
🔹 Price Action Signal:
Formation of higher lows.
Break of structure and close above previous highs.
Possible breakout pending above consolidation box.
📊 Conclusion:
DXY shows bullish potential as it builds a base around strong support. A confirmed breakout above the rectangle could fuel a rally toward 99.456. Keep an eye on volume and confirmation candles for entry. ✅
DXY Bullish Reversal & Cup FormationThe DXY (US Dollar Index) is exhibiting a strong bullish reversal pattern, with multiple technical signals suggesting upward momentum:
🔍 Technical Analysis Summary:
✅ Support Holding Strong:
Price has respected the horizontal support zone around 98.00–98.50 on multiple occasions (highlighted by orange circles and green arrows), forming a solid base.
✅ Breakout from Downtrend:
A clear breakout above two descending trendlines (black and blue) indicates a shift from bearish to bullish sentiment.
✅ Cup Pattern Formation ☕:
A textbook Cup pattern is visible, where price formed a rounded bottom — a bullish continuation formation. The handle is minor and price has broken above the neckline (around 99.00), signaling a potential continuation toward the target.
✅ Bullish Target 🎯:
Based on the cup pattern and prior resistance, the projected target is around 101.846, aligning with previous major resistance.
📌 Key Levels to Watch:
Support Zone: 98.00 – 98.50
Immediate Resistance: 99.50 – 100.00
Major Resistance/Target: 101.846
🧭 Outlook:
As long as the price remains above the 98.50 zone, the bullish scenario remains intact. The cup breakout indicates strong buying pressure, and momentum could push DXY toward the 101.846 target in the coming sessions.

U.S. Dollar Index (DXY) Bearish Setup – Supply Zone Rejection & 🔹 Trend Overview
📊 Overall Trend: Bearish (Downtrend)
📉 Price is forming lower highs and lower lows within a descending channel.
🔻 Recently bounced off a support zone, now heading toward a potential pullback.
🔵 Supply Zone (Resistance Area)
📍 Zone Range: 100.049 – 100.601
🧱 Acts as a resistance block where sellers might step in.
📏 Confluent with EMA 70 at 100.178, strengthening its validity.
🔸 Trade Setup – Short Position
🟠 ENTRY POINT: 100.088
❌ STOP LOSS: 100.587 – 100.595 (Just above supply zone)
🎯 TARGET: 98.000 (With intermediate support levels)
📌 Support Levels
🔹 98.112 – First minor support
🔹 98.106 – Close-range confirmation
🔹 97.885 – Additional support zone
🟦 Main Target: 98.000
⚖️ Risk/Reward Ratio
🟧 Small risk above supply zone
🟩 Large reward to downside = Favorable R:R
📌 Summary
📈 Expecting a pullback into supply zone.
🧨 Look for bearish confirmation around 100.088.
🎯 Target the downside at 98.000 for profit.

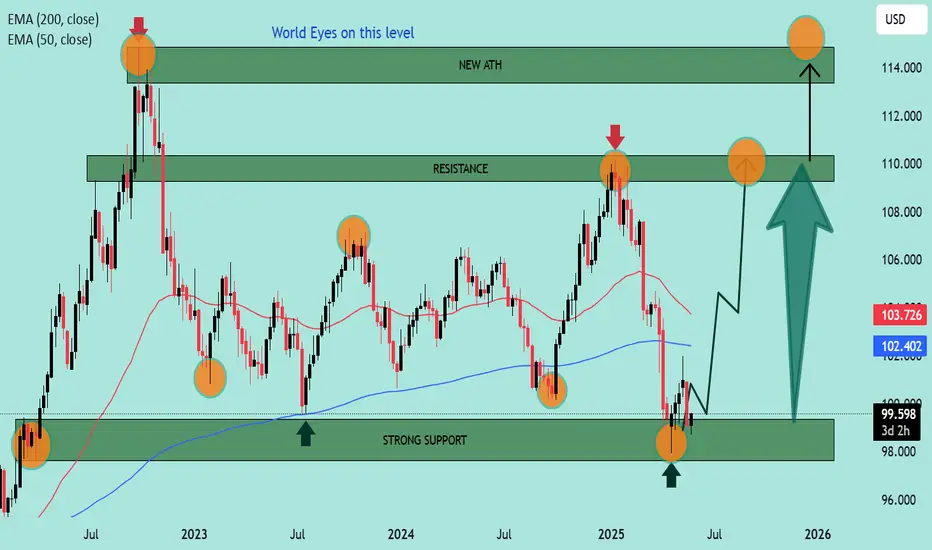
DXY Technical Outlook – Strong Support Test and Bullish Reversa Chart Summary
The DXY (U.S. Dollar Index) chart illustrates a significant technical structure between strong historical support and resistance zones, with potential for a bullish reversal after a key level retest.
🟢 Key Support Zone: 99.000 – 98.000
📍 Labeled as "STRONG SUPPORT", this zone has held multiple times:
Previous bounce: Early 2023 ✅
Mid-2024 rebound ✅
Current price action once again shows a reaction from this level with a bullish candle forming 🔥
📌 EMA Confluence:
The 200 EMA (blue) sits at 102.401
The 50 EMA (red) at 103.725
Price is currently below both EMAs but near the 200 EMA, suggesting potential for a mean reversion bounce 📈
🔴 Resistance Zones to Watch:
Resistance Zone: 109.000 – 110.000
⛔ Historically rejected in late 2023 and again in early 2025
🧱 Acting as a supply zone — watch for rejection or breakout
ATH Supply Zone: 113.000 – 114.000
🚨 This is a major psychological and technical barrier
🫡 Marked as “NEW ATH” – would need strong momentum and fundamentals for a breakout above this level
📈 Price Action Expectations:
With strong support respected again, a bullish reversal toward 109.000 – 110.000 appears likely (as illustrated by the arrow).
If momentum continues, a retest of ATH zone is on the cards 🔭
However, a failure to hold support could lead to breakdown below 98.000 – watch closely 🔍
🧭 Strategic Insight
Bullish Bias while above support (98.000 zone)
Reversal Confirmation needed above 102.401 (200 EMA) and 103.725 (50 EMA)
Watch for rejection near 110.000 resistance before ATH test
📌 Final Note:
🧊 World Eyes on this Level – As highlighted on the chart, the current support area is under global observation, reinforcing its importance.
🕵️♂️ Stay alert for breakout volume and fundamental catalysts (e.g., Fed decisions, CPI, jobs data).
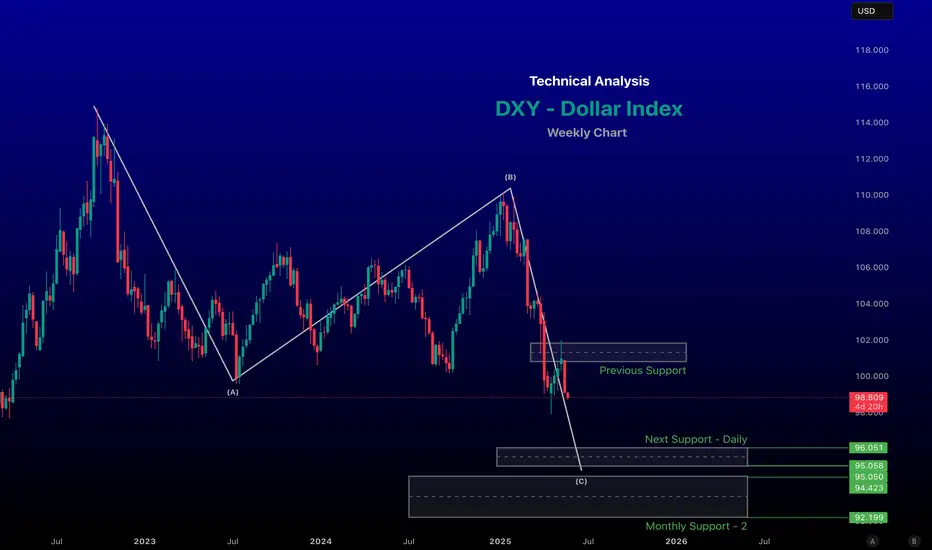
Technical Analysis of DXY (US Dollar Index) for the Week of May # Current Price Action and Market Context
Recent Price Movement: As of May 23, 2025, the DXY closed at approximately 99.11, down 0.85% from the previous session's close of 99.96. The index has been trending downward, testing two-week lows near 99.14 after failing to reclaim the 100.50 level.
Bearish Momentum: The break below 97.50 on the monthly chart signals a bearish structure with lower highs and lower lows, suggesting continued selling pressure. The next major downside target is around 96.00, with a potential longer-term target near 92.00.
Key Fundamental Drivers: Recent weakness in the DXY is attributed to President Trump’s proposed 50% tariffs on European imports, which have undermined bullish momentum in the dollar. Additionally, anticipation of Federal Reserve interest rate decisions, upcoming US inflation data, and employment reports (e.g., Non-Farm Payrolls) will play a significant role in the DXY’s direction.
-- Chart for your reference --
-- Disclaimer --
This analysis is based on recent technical data and market sentiment from web sources and X posts. It is for informational purposes only and not financial advice. Trading involves high risks, and past performance does not guarantee future results. Always conduct your own research or consult a SEBI-registered advisor before trading.
DXY finds the support at $99.DXY will be finding the support at the current levels at around $99.
From here prices can go up till $100-$101
If the price breaks down this support of 99 it will continue the fall till $97.5sh to $97zone.

XAUUSD Next Move 2800 ? 🪙 FUNDAMENTALS:
✅China on Friday struck back at the U.S tariffs imposed by Trump with a slew of counter-measures including extra levies of 34% on all U.S. goods and export curbs on some rare-earths, deepening the trade war between the world's two biggest economies.
✅ More than 50 nations have reached out to the White House to begin trade talks since Trump rolled out sweeping new tariffs, top officials said on Sunday as they defended levies that wiped out nearly $6 trillion in value from U.S. stocks last week.
✅ Federal Reserve Chairman Jerome Powell said tariffs increased the risk of higher inflation and slower growth, highlighting the difficult path ahead for policymakers at the U.S. central bank
________________________________________
🔍 4H Hour Timeframe Analysis
📊 Trend & Price Action :
• Previous Trend: Clear uptrend inside a rising channel (marked by red lines).
• Recent Price Movement: Price broke down below the ascending channel, signaling trend weakness or possible reversal.
• Strong bearish candles show increased selling pressure recently.
📉 Key Technical Levels:
• Support Zone: Around $2,979–$2,957 (green and grey lines) — price bounced here, showing buyer interest.
• Resistance Zone: Around $3,057–$3,077 — a previous support zone now acting as resistance after the breakdown.
• Moving Averages:
o Red Line (likely 50 EMA): Recently broken down, now acting as dynamic resistance.
o Blue Line (likely 200 EMA): Around $2,990, price tested and bounced — this is often a key support in a trend.
🧠 Interpretation:
• Price broke structure (channel and EMAs), signaling a shift from bullish to bearish bias.
• The bounce from the 200 EMA and support zone suggests a potential short-term retracement or consolidation.
• If price fails to reclaim $3,057–$3,077, sellers may re-enter.
________________________________________
🔍 15-Minute Timeframe Analysis
📊 Trend & Price Action:
• Sharp intraday recovery from the low of around $2,957 to the current $3,033.
• But price is now facing resistance from a supply zone (highlighted in red).
• You’ve marked an Order Block (OB) around $3,125–$3,140 — a zone where institutional selling might have started.
📉 Key Levels:
• Resistance Zones:
o $3,076 (blue line) – likely 200 EMA, strong resistance.
o $3,057–$3,076 – supply area and previous breakdown zone.
o Order Block (OB) near $3,125–$3,140 – strong institutional resistance zone.
• Support Zones:
o $3,000, $2,978, and $2,957 – these are lower supports where price previously bounced.
🧠 Interpretation:
• Short-term, the price is retracing from a heavy drop.
• Watch how price behaves at $3,057–$3,076:
o Rejection = possible short setup.
o Break & close above = retracement could continue toward OB ($3,125).
• The OB is a potential reversal zone, where price could get heavily rejected if tested.
________________________________________
📌 Beginner Takeaways:
Trend is weakening – the uptrend broke, and the market is forming lower highs and lower lows.
Price is trying to recover from key support zones but facing resistance overhead.
Volume is increasing near support — shows interest from buyers but not a confirmed trend reversal yet.
The Order Block is a great place to watch for reversal trades (supply zone = potential sell).
________________________________________
✅ Suggested Actions for Practice:
Mark key support/resistance zones on your own chart to develop your structure-reading skills.
Scenario 1: Short if price rejects at $3,057–$3,076 zone.
Scenario 2: Long only if price closes above $3,077 and holds support.
Observe how price behaves near moving averages and OB zones
.
________________________________________
👉 Always follow TP/SL to protect your capital and maximize profits!
Disclaimer: This is for educational purposes only.
Always trade responsibly and manage your risk effectively

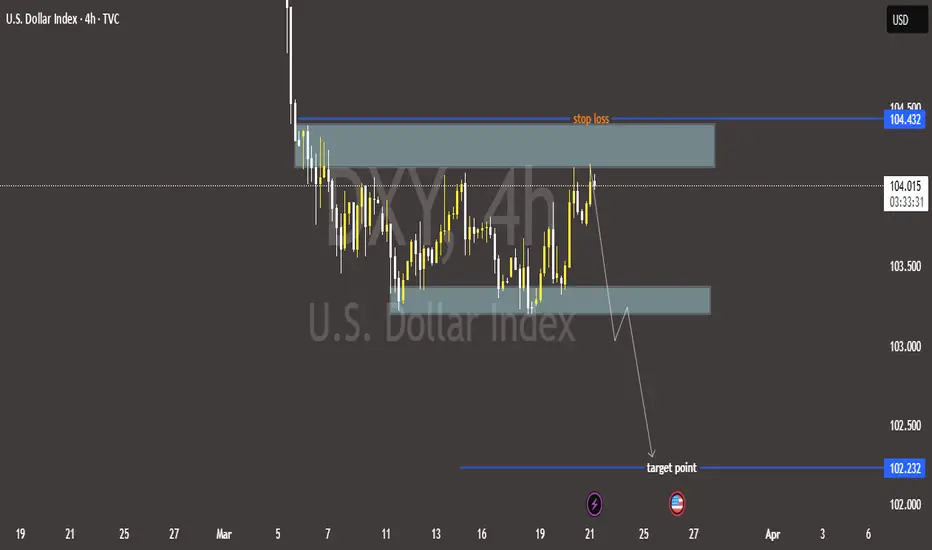
U.S. Dollar Index (DXY) – Bearish Outlook with Key Levels📉 Bearish Bias on U.S. Dollar Index (DXY) – 4H Chart
🔹 Resistance Zone & Stop Loss 🚫
📍 Resistance: 104.200 - 104.432
🛑 Stop Loss: 104.432 (Above resistance zone)
🔸 Support Zone 🛠️
📍 Intermediate Support: 103.300 (Possible bounce)
🔻 Target Point 🎯
📍 Target Price: 102.232 (Expected downside)
📊 Price Action Outlook:
✅ Bearish Scenario:
Price rejected from resistance 🔽
Lower highs forming ⚡
Breakdown expected toward 102.232 🎯
❌ Invalidation:
If price breaks above 104.432, bearish setup fails 🚫
🔥 Conclusion:
⬇️ Sell Bias below 104.200 targeting 102.232
❌ Cut losses if price closes above 104.432
DXY (U.S. Dollar Index) Bearish Trade Setup – Potential DowntrenThis chart is a technical analysis of the U.S. Dollar Index (DXY) on a 1-hour timeframe. Here's a breakdown of the analysis:
🔹 Chart Overview:
DXY Price: 103.773
Trend: The price has been in an uptrend, but there's a potential for reversal.
Entry Point: 103.816
Stop Loss: 104.096 (Marked in red)
Take Profit (TP) Levels:
TP1: 103.608
TP2: 103.400
Next Target: 103.133
🔹 Analysis:
Trendline Break: The price had been following an ascending trendline, which appears to be broken. This suggests a potential downtrend continuation.
Bearish Setup: The trade setup suggests a short (sell) position.
Risk-Reward Ratio:
The stop loss (104.096) is placed above the recent resistance.
The take profit levels are set at key support zones.
Market Sentiment: If the price stays below 103.816, it may continue dropping toward TP1, TP2, and the Next Target.
🔹 Conclusion:
Bearish Bias 📉: The market could see further downside if the price stays below the entry point.
Trade Idea: Short below 103.816, with a stop at 104.096, and targets at 103.608, 103.400, and 103.133.

DOLLAR INDEX - WILL IT BREAK DOWN OR CLIMB HIGHER?Symbol - DXY
The U.S. Dollar Index (DXY) is currently trading within a key support zone, which has historically acted as a pivotal level for price action. A clear double top pattern has emerged on the larger time frame, signaling a potential bearish reversal. A breakdown below this support area would likely signify a shift in the short-term trend of the U.S. Dollar, with the potential for a move lower.
Despite this, there remains an underlying expectation in the global markets that the U.S. Dollar will stay elevated in the medium term due to factors such as President Trump’s policies, tariffs, and rising geopolitical fragmentation. However, much of this has already been priced into the currency, and the current price action is showing signs of weakness, suggesting that the Dollar may be poised for a pullback.
From a technical perspective, a decisive breakdown below the support zone would imply a trend change, with further downside potential. Traders and investors may need to reassess their outlook for the U.S. Dollar if this level is breached.
Key support levels: 107.60, 107.40
Key resistance levels: 108.35, 108.50
On the other hand, if the price holds above the support area and key upcoming data, such as the Non-Farm Payrolls (NFP) and Consumer Price Index (CPI), continue to support the Dollar’s strength, there is potential for the index to continue its upward trajectory. In this alternate scenario, the previous bullish trend for the U.S. Dollar could resume, especially if these data points align with expectations and signal ongoing economic strength. Therefore, the outlook for the U.S. Dollar remains contingent on the price action at the current support level and upcoming economic data releases.

Bearish Divergence on DXY , What’s Next?The DXY appears primed for a significant drop. On the daily timeframe, a clear bearish divergence has formed, suggesting potential downside movement. Key support levels should be monitored, particularly in relation to the RSI. If the RSI holds around the 50 level, we could see a potential bounce; however, a continued drop into the oversold zone is also possible. The DXY's movement may also be influenced by the FOMC minutes release on January 9th, adding another layer of significance to these levels.

Bearish Divergence on DXY , What’s Next?The DXY appears primed for a significant drop. On the daily timeframe, a clear bearish divergence has formed, suggesting potential downside movement. Key support levels should be monitored, particularly in relation to the RSI. If the RSI holds around the 50 level, we could see a potential bounce; however, a continued drop into the oversold zone is also possible. The DXY's movement may also be influenced by the FOMC minutes release on January 9th, adding another layer of significance to these levels.

DXY Bearish Setup Update - DXY is currently trading at 105.7 and it exactly got rejected from my POI
- DXY looks all set to mitigate 103.8, bringing more upside to all pairs denominated by USD, risky assets like Crypto, and Stocks.
- Watch out for 103.8 and 101.9 to expect another leg up from
- We have a market structure shift from 103.3 if we flip below that on a weekly TF, we might soon see DXY turning bearish.
- DXY can soon show impulsive moves on Monday post bullish commentaries

DXY Ready to Soar?📈 DXY Analysis & Forecast (US Dollar Index) 🚀
Current Structure:
The DXY appears to be in the middle of an impulsive wave sequence based on Elliott Wave theory, currently moving within the 4th wave correction phase. The overall structure shows a clear upward trend, supported by a rising trendline that has consistently held as support. We can observe a potential breakout setup, with a contracting triangle pattern indicating a breakout to the upside.
Key Technical Points:
Wave Count Analysis:
🌀 Wave (1) initiated a strong bullish move after breaking out of the downward channel.
🔄 Wave (2) saw a retracement, respecting the previous resistance level that turned into support.
🚀 Wave (3) was an impulsive rally, taking the DXY to new highs and confirming bullish momentum.
📉 Wave (4) is forming a consolidation, resembling a bullish pennant pattern, indicating a continuation of the uptrend.
Key Support & Resistance Levels:
Support: The price is currently holding above the key support zone at 106.20, which aligns with the trendline.
Resistance: The next target for the bulls would be the previous swing high at 107.40, which is the completion zone for Wave (5).
Indicators & Patterns:
📊 The ascending trendline continues to support the bullish bias.
🔼 A breakout above the 106.80 - 107.00 range could trigger a push towards the 107.40 level.
⚡ Watch for potential fake-outs; a break below 106.20 may invalidate the bullish scenario.
📅 Forecast:
The DXY is poised for an upward move as long as the 106.20 support holds. If the breakout above 106.80 is confirmed, we could see the DXY reaching the 107.40 mark, completing the 5th wave of the current bullish cycle. A decisive close above 107.40 might lead to further gains, potentially aiming for the 108.00 level.
📊 What are your thoughts on this setup? Are you bullish on the DXY? Drop yourcomment below! 👇
🔗 Follow for more Forex updates and daily trading insights!
#DXYAnalysis #ForexSignals #ElliottWave #DollarIndex #ForexTrading #TechnicalAnalysis #USD #ForexCommunity #TradingForecast #MarketUpdate

US DOLLAR INDEX - TRADE IDEA ON SHORT SIDESymbol - DXY
DXY is currently trading at 105.57
My reversal setup has formed in DXY & I'm seeing a trading opportunity on sell side.
Shorting DXY at CMP 105.57
I will add more position if 106.00 comes & will hold with SL 106.30
Targets I'm expecting are 104.75 - 104.30 - 103.73 & below.
Disclaimer - Do not consider this as a buy/sell recommendation. I'm sharing my analysis & my trading position. You can track it for educational purposes. Thanks!

DXY - TRADE OPPORTUNITY ON SHORT SIDESymbol - DXY
DXY is currently trading at 104.72
My reversal setup has formed in DXY & I'm seeing a trading opportunity on sell side.
Shorting DXY at CMP 104.72
I will add more position if 104.45 comes & will hold with SL 104.75
Targets I'm expecting are 103.25 - 102.75 - 102.15
Disclaimer - Do not consider this as a buy/sell recommendation. I'm sharing my analysis & my trading position. You can track it for educational purposes. Thanks!

DXY Analysis: Bearish Trend Signals Potential Drop📊 DXY Analysis (2H Chart) 🧐
The U.S. Dollar Index is currently in a consolidation phase around the 104.50 level after a sharp drop from the recent highs. Let’s break down what the technicals are signaling:
1. Bearish Structure 📉:
• The index has been trading within a descending channel, which indicates a prevailing bearish trend.
• A significant Cross Doji candle at the top hints at a potential reversal, followed by strong bearish momentum.
2. Key Levels to Watch 🔍:
• Resistance Zone: The DXY is consolidating below the 104.60 level, which is acting as a key resistance. Multiple rejections around this area could signify strong selling pressure.
• Support Zone: The next major support lies around the 103.60 level, aligning with the lower boundary of the channel.
3. EMA Dynamic Resistance 💡:
• The 50-period EMA (green line) is currently acting as a dynamic resistance. A sustained move below this EMA can add further downside pressure.
4. Potential Scenario 🔮:
• If the DXY fails to break above the 104.60 resistance, we could see a drop towards the 104.00 level initially.
• A break below the 104.00 support might accelerate the move toward the 103.60 zone, completing the bearish leg.
📉 Bearish Outlook: Unless we see a breakout above the consolidation zone and a close above the descending channel, the bias remains bearish for the DXY in the short term.
🔗 Follow for more daily updates on forex market analysis!
#DXY #DollarIndex #ForexAnalysis #TechnicalAnalysis #USD #TradingSignals #ForexTrading #ForexTrader #PriceAction #TradingStrategy #ForexMarket #USDIndex #CurrencyTrading #MarketAnalysis #TradingView #ForexLife #FinancialMarkets #DayTrading #SwingTrading #ForexCommunity #TraderLife #ChartAnalysis #TradingPsychology #Investing #ForexTips #TradingSetups

DXY gearing up for a big fallDate: 30 Oct’24
Symbol: DXY
Timeframe: Weekly
US Dollar Currency Index currently seems to be in final stages of Wave (e) of B. One more leg up and DXY will be ready to head lower sharply and in a big way. It is likely to head towards 90 and lower. This also means with DXY treading lower, Nifty is likely to witness an up move.
This is not a trade recommendation. Please do your own analysis.
US Dollar Currency Index vartamaan mein Wave B (e) ke antim charan mein lagta hai. Ek aur pair upar aur DXY teji se aur bade paimaane par neeche jaane ke lie taiyaar hoga. Iske 90 aur usase kam kee or badhane kee sambhaavana hai. Iska matalab yah bhee hai ki DXY ke nichale star par chalane se Nifty mein teji dekhne ko mil sakti hai.
Yah koi trade karne ki salah nahin hai. Kripya apana vishleshan khud karen.


DXY Dollar Index Trade Setup - The Dollar Index is currently trading at 100.691
- The Dollar Index looks all set to break below the important liquidity area
- We can see an either side's Liquidity grab cause of the FOMC
- Watch out for the FOMC closely as market likely shows a direction before that
