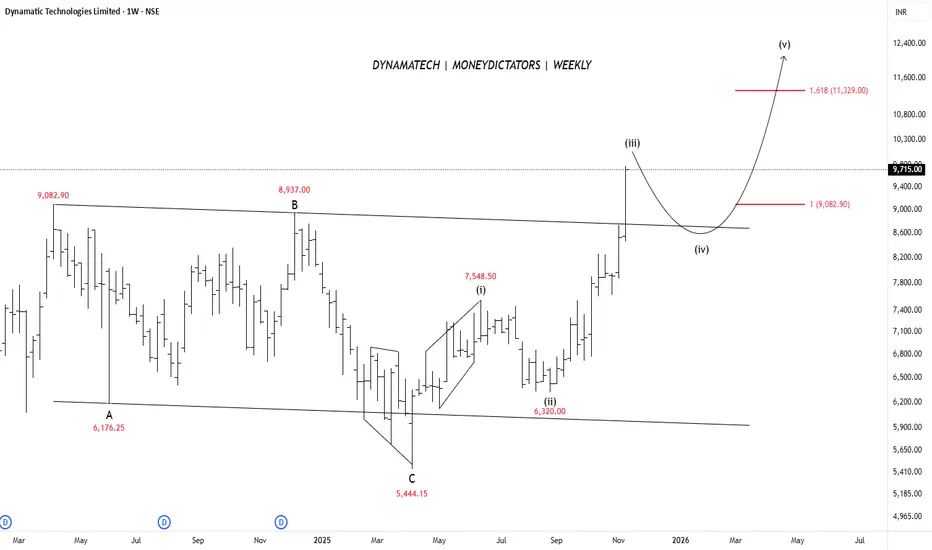
Dynamatech Has Given a Clean Wave Map to the ₹11,300 ZoneDynamatic Technologies has already completed its big A-B-C correction, meaning the downtrend is over. After this, the stock started a fresh upward Elliott Wave cycle, and waves (i), (ii), and (iii) are already complete. This confirms that the stock has entered a new bullish phase.
Right now, the price is moving inside wave (iv), which is a normal and healthy pullback. This corrective move is shallow and smooth, showing that buyers are still in control. The important support for this pullback sits near 9,082 , where the chart also shows a Fibonacci level. Once wave (iv) ends, the chart suggests a strong rise toward wave (v).
Wave (v) usually extends upward, and based on Fibonacci projections, the next major target is around 11,300 . This level is marked by the 1.618 extension, a common ending point for final impulse waves.
Overall, the stock structure looks bullish and clean. The trendline breakout and wave count both suggest the next move is upward. If the price holds above 9,082, the chances of reaching the 11,300 wave (v) target remain strong.
Stay Tuned! :)
@Money_Dictators
DYNAMATECH
BUY TODAY SELL TOMORROW for 5%ON’T HAVE TIME TO MANAGE YOUR TRADES?
- Take BTST trades at 3:25 pm every day
- Try to exit by taking 4-7% profit of each trade
- SL can also be maintained as closing below the low of the breakout candle
Now, why do I prefer BTST over swing trades? The primary reason is that I have observed that 90% of the stocks give most of the movement in just 1-2 days and the rest of the time they either consolidate or fall
Trendline Breakout in DYNAMATECH
BUY TODAY SELL TOMORROW for 5%

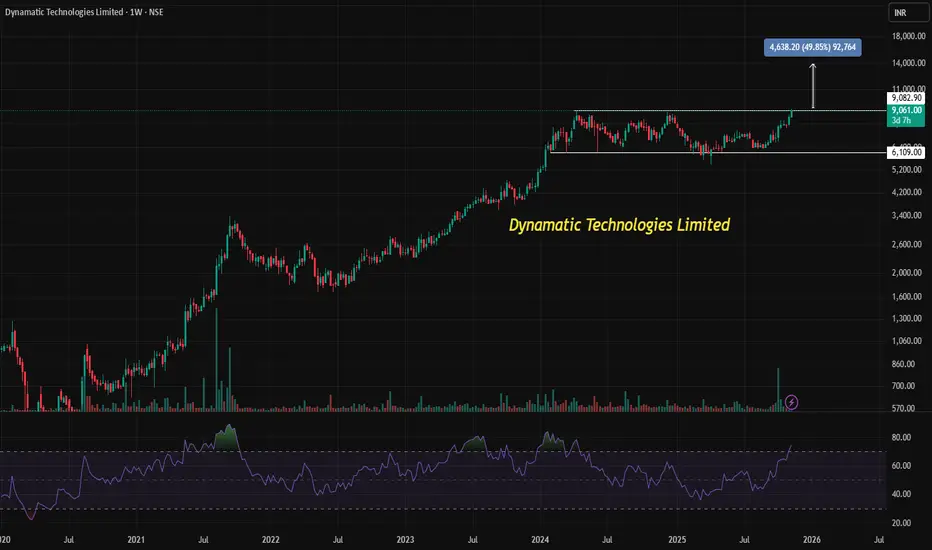
DYNAMATECH is showing signs of a bullish breakout on WeeklyChartDynamatic Technologies is showing signs of a bullish breakout from a long consolidation phase, with a potential upside target of ₹13,900–₹14,000 based on the rectangle chart pattern.
📈 Understanding the Rectangle Breakout in Simple Terms
In the world of stock charts, a rectangle pattern is like a pause in a conversation. The price moves sideways within a defined range — bouncing between a top (resistance) and bottom (support) — without making any big moves up or down. This phase is called consolidation, and it often reflects indecision among buyers and sellers.
Rectangle pattern forms when a stock trades between two horizontal lines for a period of time.
Breakout happens when the price finally moves above the resistance line, signaling renewed buying interest.
Breakdown is the opposite — when price falls below support, indicating selling pressure.
This pattern is useful because it helps traders spot potential turning points. Once the breakout occurs, it often leads to a strong price move in the direction of the breakout.
🔍 Dynamatic Technologies: What’s Happening Now?
Dynamatic Technologies Ltd. has been trading in a tight range since April 2024, forming a textbook rectangle pattern on its weekly chart. As of early November 2025, the stock is attempting a positive breakout, currently trading around ₹9,060.
Here’s what makes this breakout noteworthy:
Long consolidation: The stock has been range-bound for over 1.6 years, which builds up potential energy for a strong move.
RSI strength: The Relative Strength Index (RSI), a momentum indicator, has climbed above 70 — a sign that buying momentum is picking up.
Volume and price action: A breakout accompanied by rising volume and strong price movement often confirms the trend.
🎯 How Is the Target Calculated?
The beauty of the rectangle pattern is its simplicity in estimating price targets. The expected move after a breakout is often equal to the height of the rectangle — the distance between the support and resistance levels.
Suppose the rectangle ranged between ₹6,000 and ₹9,000.
The height is ₹3,000,
Add this to the breakout level (₹9,000), and you get a target of ₹12,000.
In Dynamatic’s case, the projected move is even more ambitious — aiming for ₹13,900 to ₹14,000, which suggests a larger rectangle height or a more aggressive breakout.
🧠 Why It Matters for Investors
Rectangle breakouts are popular among traders because they offer:
Clear entry and exit points: Buy on breakout, set stop-loss below support.
Defined risk-reward: The height of the rectangle helps estimate potential gains.
Momentum confirmation: Indicators like RSI help validate the breakout strength.
For long-term investors, such patterns can signal a shift in trend — from sideways to upward — especially when backed by strong fundamentals or news, like Dynamatic’s recent aerospace partnership
✅ Final Thoughts
Dynamatic Technologies is showing technical strength with a rectangle breakout, supported by rising RSI and bullish price action. If the breakout sustains, the stock could potentially reach ₹13,900–₹14,000, offering a compelling opportunity for momentum-driven investors.
Dynamatic Technologies Limited - Long Setup, Move is ON...#DYNAMATECH trading above Resistance of 3655
Next Resistance is at 4233
Support is at 2719
Here is previous chart:
Chart is self explanatory. Entry, Resistances and Support are mentioned on the chart.
Disclaimer: This is for demonstration and educational purpose only. This is not buying or selling recommendations. I am not SEBI registered. Please consult your financial advisor before taking any trade.

Breakout in Dynamatic Technologies Ltd...Chart is self explanatory. Levels of breakout, possible up-moves (where stock may find resistances) and support (close below which, setup will be invalidated) are clearly defined.
Disclaimer: This is for demonstration and educational purpose only. This is not buying or selling recommendations. I am not SEBI registered. Please consult your financial advisor before taking any trade.

Dynamatech Stage analysis.Stage 1
entry : 2814-2830
SL : swing low/ 7-12% / 2311
Targets : 3125, 3300, 3629,++, ride the trend.
3-9 months
Note: only for learning, trade at your own risk.

Dynamatic Technologies LimitedDYNAMATECH:- stock can give breakout anytime keep your eye
Hello traders,
As always, simple and neat charts so everyone can understand and not make it too complicated.
rest details mentioned in the chart.
will be posting more such ideas like this. Until that, like share and follow :)
check my other ideas to get to know about all the successful trades based on price action.
Thanks,
Ajay.
keep learning and keep earning.

Dynamatech to take long entryLong above 2500 for the next target level of 3100. But be alert @ 2600 so bear can step in. Once this zone crosses trail the SL for the much higher rewards. All important levels have been marked on the charts. This is for your educational purpose.
Protip---
1-RSI taking support above 60 bullish signal.
2- Stock is forming higher highs & lower lows again the bullish signal.

YR 2022 Idea #125: Long on DYNAMATECH This is a public swing trade idea and is only for Learning and observational purpose. Please understand your risk and take full responsibility of your actions. I might trail my stoploss after I get an entry but even if my original Stoploss hits, i exit the trade with pre-planned loss (risk). At target, I book usually 75% positions and trail stoploss for rest. Our objective to help anyone who wants to learn technical analysis using charts by demonstrating my real trade entries. You can post your queries in comment section here and we will try to answer them asap.

