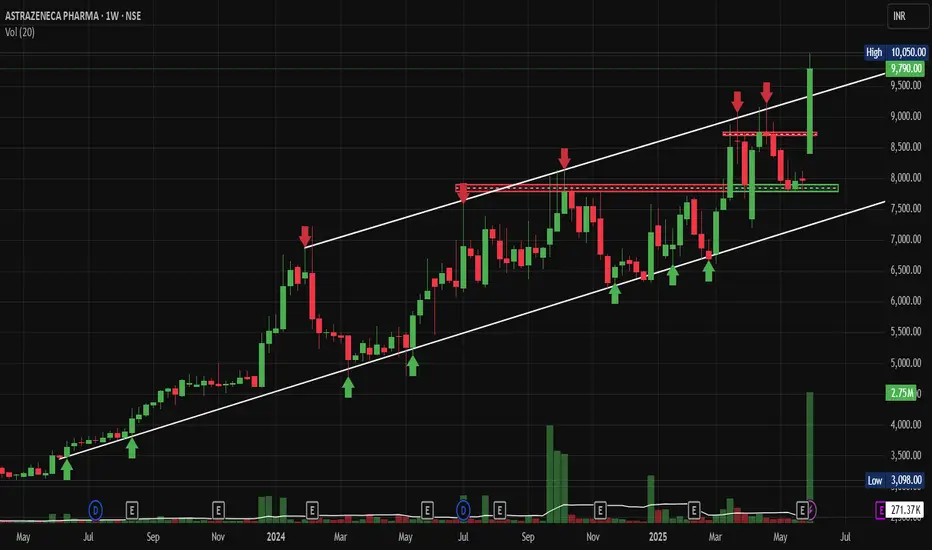
AstraZeneca Breakout Above 10000 Could Signal Next Leg, Post Q4NSE:ASTRAZEN Breakout Above 10000 Could Signal Next Leg, Post Spectacular Q4 and FY25 Numbers. Breaking out of Rising Channel, hence selected for this Week's "Chart of the WEEK"
Price Action Analysis:
• Stock has been in a strong uptrend since May 2024, rising from around 3000 levels to current levels near 9800
• Recent price action shows consolidation between the 7500-8500 levels with multiple tests of resistance
• Current price at 9409 represents a +22.80% gain, showing strong momentum
• Volume spike visible in recent sessions at 2.75M shares vs average, indicating institutional interest
• Price structure shows a higher highs and higher lows pattern intact.
Key Support and Resistance Levels:
• Primary Support: 8000-8200 zone (previous resistance turned support)
• Secondary Support: 7500-7600 (multiple bounce zone)
• Key Resistance: 8500-8600 (red horizontal line showing multiple rejections)
• Breakout Resistance: 9000 psychological level
• Current High: 10,950 acting as immediate resistance
Base Formation and Patterns:
• Rectangle consolidation pattern formed between 7500-8500 from September 2024 to March 2025
• Bullish flag pattern visible after the breakout above 8500
• Ascending triangle formation with higher lows and flat resistance around 8500
• Volume expansion during breakout confirms pattern validity
Technical Indicators:
• Strong upward-trending channel maintained since mid-2024
• Price trading above all major moving averages
• Momentum appears to be building after the recent consolidation phase
• Volume profile shows accumulation during base formation
Trade Setup:
Entry Strategy:
• Primary Entry: On pullback to 8800-9000 support zone
• Aggressive Entry: Current market price around 9400 for momentum play
• Conservative Entry: Wait for retest of 8500 breakout level
Exit Levels:
• Target 1: 10,500 (psychological resistance)
• Target 2: 11,200 (measured move from rectangle pattern)
• Target 3: 12,000 (extension target based on trend channel)
Risk Management:
• Stop Loss: 8200 for entries around 9000 (tight stop)
• Stop Loss: 7800 for swing positions (wider stop)
• Position Size: Risk 1-2% of portfolio per trade
• Risk-Reward Ratio: Minimum 1:2 for all entries
Position Sizing Guidelines:
• For 1% risk: Calculate position size based on distance to stop loss
• Maximum exposure: 3-5% of portfolio in a single stock
• Scale in approach: 50% on initial entry, 30% on pullback, 20% on confirmation
Sectoral and Fundamental Backdrop:
Pharmaceutical Sector Overview:
• Indian pharma sector benefiting from global generic drug demand
• Regulatory approvals and US FDA compliance driving growth
• Export-oriented companies are seeing currency tailwinds
• Increased healthcare spending post-pandemic, supporting sector growth
AstraZeneca Pharma Fundamentals:
• Strong presence in oncology and respiratory segments
• Robust pipeline of innovative drugs and biosimilars
• Strategic partnerships with global pharmaceutical companies
• Consistent revenue growth and expanding market share in India
• Strong balance sheet with healthy cash flows
Market Dynamics:
• Institutional buying is visible through increased volumes
• FII interest in pharmaceutical stocks remains positive
• Sector rotation favouring defensive healthcare plays
• Government initiatives supporting pharmaceutical manufacturing
Risk Factors:
Technical Risks:
• High volatility near resistance levels
• Potential for false breakouts given extended rally
• Volume confirmation required for sustained moves
• Overbought conditions in the short term
Fundamental Risks:
• Regulatory changes in pharmaceutical pricing
• Currency fluctuation impact on export revenues
• Competition from generic drug manufacturers
• Global economic slowdown affecting healthcare spending
Market Risks:
• Overall market correction could impact individual stocks
• Sector rotation away from pharmaceuticals
• Profit booking by institutional investors
• Global pharmaceutical industry headwinds
My Take:
NSE:ASTRAZEN presents a compelling technical setup with a clear breakout above long-term resistance. The stock's strong fundamentals post Q4 and FY25, combined with favourable sector dynamics, make it an attractive investment opportunity. However, risk management remains crucial given the extended nature of the current rally. Traders should consider scaling into positions on pullbacks while maintaining strict stop-loss discipline.
Keep in the Watchlist.
NO RECO. For Buy/Sell.
📌Thank you for exploring my idea! I hope you found it valuable.
🙏FOLLOW for more
👍BOOST if you found it useful.
✍️COMMENT below with your views.
Meanwhile, check out my other stock ideas on the right side until this trade is activated. I would love your feedback.
Disclaimer: "I am not a SEBI REGISTERED RESEARCH ANALYST AND INVESTMENT ADVISER."
This analysis is intended solely for informational and educational purposes and should not be interpreted as financial advice. It is advisable to consult a qualified financial advisor or conduct thorough research before making investment decisions.
Earningsplay
CCL - Beautiful Chart Structure Post Q4NSE:CCL made a Beautiful Chart Structure today after Q4 Results.
Keep in the Watchlist.
NO RECO. For Buy/Sell.
Disclaimer: "I am not a SEBI REGISTERED RESEARCH ANALYST AND INVESTMENT ADVISER."
This analysis is intended solely for informational and educational purposes and should not be interpreted as financial advice. It is advisable to consult a qualified financial advisor or conduct thorough research before making investment decisions.

OPTION DATABASE TRADING An option chain is a comprehensive list that shows you all available option contracts for a given stock. These are sorted by their expiration date, which is the last day you can trade or use the option, and strike price, which is the price at which you can buy (call) or sell (put) the stock.
Nifty option chain is considered to be the best advance warning system of sharp moves or break outs in the index.

Lumax Auto Tech posted solid results and in long baseLumax Auto Technology, a market leader in Gear Shifters posted solid Q4Fy24 results.
TA:
-Auto Ancillaries are showing strength
-Long Base, testing 5th time
-Making HLs (Higher lows)
-Price Contracting
Needed good vol for breakout (BO).
Check how it reacting when reaching Hundred's (like 300, 400)

HOMEFIRST near ALL TIME HIGHHomefirst Finance seems good for the upcoming month which has earnings in December, it is also near its ALL TIME HIGH with WEEKLY action looks like the price is CONTRACTING or SUPPLY ABSORBTION, alse fundamental rise in QTR profits with GOVT Housing PUSH.
200 EMA is just a bit of concern as it is lacking.

Intellect Design is in strong momentumEarnings impact has made NSE:INTELLECT a very clean chart with great upside. I have simplified the chart for everyone by removing the noise. Keep a target of 850 with a stop loss at 610. Go Long.

Strategy on TVSMOTOR before earnings - EarningsplayWhat I see :
I see good trendline supportive
Earning about to come and price has fallen quite a lot about 12% from top
This can be a good risk to reward trade if taken with proper system
Rest is expalined well in the video
Happy trading :)

UPL earnings release playUPL is showing slow upward momentum and nearing Q1 earnings release, so a small long play is suggested

DFM Foods 4.5yr H&S / 3.5yr C&H / 6mth DTL Breakout post resultsThe stock is forming multiple patterns on weekly as well as daily charts, with good volume inflow. In January it staged a failed breakout, and went down forming a down trending channel of 6 months (also the Handle of the log term C&H Pattern). After yesterday's earnings result, it broke out of the channel, and followed up with great price action and even higher volume than yesterday. Looks very good in the near term.
Moving along with sector.
SL: Depending on your risk appetite: Below Weekly BO Candle / Below Daily BO Candle / 50% of Weekly BO candle / Below 20DMA
TGT: After a 10-15%+ vertical move, breakdown of 20MA on Hourly chart (on a daily close basis)
BUY GUIDANCE:
Never ever buy before 3PM. I have been burnt many many times.Try to buy between 3:15 - 3:30PM, later the better.
SELL GUIDANCE:
Selling in Profit:
Sell earlier in the session when the prices are higher, around 11AM.
Selling at SL:
Give your stock a chance to recover by end of session. If it doesn't recover, sell anywhere between 3:00 - 3:30PM.
Note: I reserve the right to be wrong.
DISCLAIMER:
I am not a SEBI registered analyst. Please consult your financial advisor before investing.

Nath Bio Genes 2yr Breakout retest / 10mth Rounding on heavy volThe stock is showing some very interesting price action despite the sector being quiet in the last few days. A Gap up opening one day before earnings. Notice the massive volume clusters during the rounding bottom formation. It broke out of long time resistance on very high volume and followed through with absorption volume. Came back on low vol to test the breakout area, formed a bullish pin bar and shot up on a 11% gap up with disproportionately high volume. Wonder if there's a goldmine hidden in the earnings result. Keep a close watch.
SL: Depending on your risk appetite: Below Weekly BO Candle / Below Daily BO Candle / 50% of Weekly BO candle / Below 20DMA
TGT: After a 10-15%+ vertical move, breakdown of 20MA on Hourly chart (on a daily close basis)
BUY GUIDANCE:
Never ever buy before 3PM. I have been burnt many many times.Try to buy between 3:15 - 3:30PM, later the better.
SELL GUIDANCE:
Selling in Profit:
Sell earlier in the session when the prices are higher, around 11AM.
Selling at SL:
Give your stock a chance to recover by end of session. If it doesn't recover, sell anywhere between 3:00 - 3:30PM.
Note: I reserve the right to be wrong.
DISCLAIMER:
I am not a SEBI registered analyst. Please consult your financial advisor before investing.

Excel Ind - Retest of 2yr breakout zone on good earningsGreat find by @monkmaxims
The stock made a 2yr Inverted Head and Shoulder Pattern on weekly chart. It gave a 9 month channel breakout on 4th May with very high vol. After 15 odd sessions, price has come back to retest its long term breakout level on very low volumes. Also co-inciding with result date, showing a good set of earnings (60% rise in YoY EPS.)
Sector on the move due to good monsoon.
SL: Depending on your risk appetite: Below Weekly BO Candle / Below Daily BO Candle / 50% of Weekly BO candle / Below 20DMA
TGT: After a 10-15%+ vertical move, breakdown of 20MA on Hourly chart (on a daily close basis)
BUY GUIDANCE:
Never ever buy before 3PM. I have been burnt many many times.Try to buy between 3:15 - 3:30PM, later the better.
SELL GUIDANCE:
Selling in Profit:
Sell earlier in the session when the prices are higher, around 11AM.
Selling at SL:
Give your stock a chance to recover by end of session. If it doesn't recover, sell anywhere between 3:00 - 3:30PM.
Note: I reserve the right to be wrong.
DISCLAIMER:
I am not a SEBI registered analyst. Please consult your financial advisor before investing.

Redington 4yr Rounding bottom / 2.5mth VCPGood results, may breakout anytime soon.
Moving along with sector.
SL: Depending on your risk appetite: Below Weekly BO Candle / Below Daily BO Candle / 50% of Weekly BO candle / Below 20DMA
TGT: After a 10-15%+ vertical move, breakdown of 20MA on Hourly chart (on a daily close basis)
BUY GUIDANCE:
Never ever buy before 3PM. I have been burnt many many times.Try to buy between 3:15 - 3:30PM, later the better.
SELL GUIDANCE:
Selling in Profit:
Sell earlier in the session when the prices are higher, around 11AM.
Selling at SL:
Give your stock a chance to recover by end of session. If it doesn't recover, sell anywhere between 3:00 - 3:30PM.
Note: I reserve the right to be wrong.
For educational purposes only.

GNA Axles 3yr C&H BreakoutMoving along with sector.
SL: Depending on your risk appetite: Below Weekly BO Candle / Below Daily BO Candle / 50% of Weekly BO candle / Below 20DMA
TGT: After a 10-15%+ vertical move, breakdown of 20MA on Hourly chart (on a daily close basis)
BUY GUIDANCE:
Never ever buy before 3PM. I have been burnt many many times.Try to buy between 3:15 - 3:30PM, later the better.
SELL GUIDANCE:
Selling in Profit:
Sell earlier in the session when the prices are higher, around 11AM.
Selling at SL:
Give your stock a chance to recover by end of session. If it doesn't recover, sell anywhere between 3:00 - 3:30PM.
Note: I reserve the right to be wrong.
For educational purposes only.

Lovable Lingerie - 2.5yr H&S PatternMoving along with sector.
SL: Depending on your risk appetite: Below Weekly BO Candle / Below Daily BO Candle / 50% of Weekly BO candle / Below 20DMA
TGT: After a 10-15%+ vertical move, breakdown of 20MA on Hourly chart (on a daily close basis)
BUY GUIDANCE:
Never ever buy before 3PM. I have been burnt many many times.Try to buy between 3:15 - 3:30PM, later the better.
SELL GUIDANCE:
Selling in Profit:
Sell earlier in the session when the prices are higher, around 11AM.
Selling at SL:
Give your stock a chance to recover by end of session. If it doesn't recover, sell anywhere between 3:00 - 3:30PM.
Note: I reserve the right to be wrong.
For educational purposes only.

Jagran Prakashan 1.5yr Cup and Handle Media sector is doing well for the last 3-4 days, we have seen some good breakouts in the sector. Could this be next big breakout?
Moving along with sector.
SL: Depending on your risk appetite: Below Weekly BO Candle / Below Daily BO Candle / 50% of Weekly BO candle / Below 20DMA
TGT: After a 10-15%+ vertical move, breakdown of 20MA on Hourly chart (on a daily close basis)
BUY GUIDANCE:
Never ever buy before 3PM. I have been burnt many many times.Try to buy between 3:15 - 3:30PM, later the better.
SELL GUIDANCE:
Selling in Profit:
Sell earlier in the session when the prices are higher, around 11AM.
Selling at SL:
Give your stock a chance to recover by end of session. If it doesn't recover, sell anywhere between 3:00 - 3:30PM.
Note: I reserve the right to be wrong.
For educational purposes only.

ACE 3.5yr Head and Shoulders BreakoutHeading for a Breakout on earnings.
SL: Depending on your risk appetite: Below Weekly BO Candle / Below Daily BO Candle / 50% of Weekly BO candle / Below 20DMA
TGT: After a 10-15%+ vertical move, breakdown of 20MA on Hourly chart (on a daily close basis)
BUY GUIDANCE:
Never ever buy before 3PM. I have been burnt many many times.Try to buy between 3:15 - 3:30PM, later the better.
SELL GUIDANCE:
Selling in Profit:
Sell earlier in the session when the prices are higher, around 11AM.
Selling at SL:
Give your stock a chance to recover by end of session. If it doesn't recover, sell anywhere between 3:00 - 3:30PM.
Note: I reserve the right to be wrong.
For educational purposes only.

Earnings Gap : high probabilityIt gave earnings gap up on 16 nov. Its also BGU (buyable gap up) setup by Gil morales.
Volume is 700% above avg which is just too much.
On friday, held the BO line giving a pullback buy.
So, high probability setup.

ITC Earning season 25 May / Short trade @ 200 ITC in a breakout positon
Earning is on 25th may
1. 7%+ rally before earning season
2. divergence on money flow
3. resistance on 190-193 level (Technical analysis)
4. Resisitance as per option chain data is at 200.
Option chain data
Resistance strike 200 call - 33.5 lakh OI
Support at strike 180 put - 14.8 lakh oI
Bear looks more powerfull here.
Trade plan
Short
if stock price reaches 200 short SL 205 TGT1 190 TGT2 180
if stock price crosses 190 short SL 195 TGT1 180
Long
if stock price crosses 200 long SL 195 TGT
