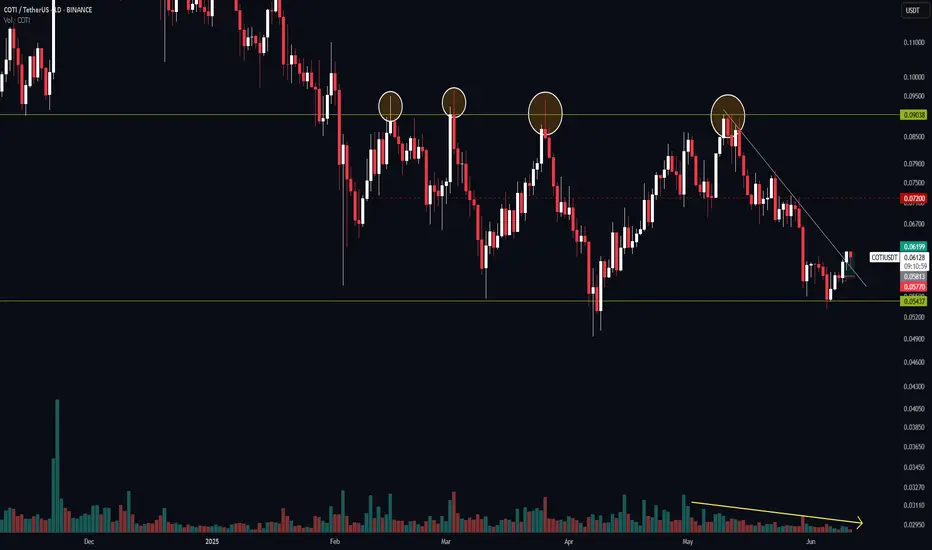
COTI/USDT Daily Timeframe Analysis Cycle Overview:
HWC: Ranging 🔁
MWC: Bearish 🔽
LWC: Bullish 🔼
🧠 Market Structure & Setup:
COTI has broken above its key daily trendline and is currently retesting that zone — a typical pullback setup. This break, combined with a bullish LWC and strong support on the COTI/BTD pair, offers a long-term opportunity, though the setup carries significant risk.
The COTI/BTD pair is still trending downward, but it's sitting right on a strong historical support, which could provide a good entry before a possible breakout of the daily resistance — a level that has seen four strong rejections in the past.
That gives us a clean invalidation and a solid risk-to-reward setup if the breakout follows through.
Another bullish signal: Volume has been decreasing during the recent pullback from the top, indicating a potential exhaustion of sellers — which strengthens the breakout scenario.
🔑 Key Levels:
🔸 Major Resistance: 0.07200 – a strong barrier; if price breaks and holds above this, momentum could accelerate.
🟢 I’m not closing the position yet — waiting to see if price reaches the daily high and breaks out.
🚫 No short position in play.
⚠️ This is a long-term and high-risk setup — not suitable for short-term traders.
⏳ Be aware: holding this trade may take time — patience is required.
💡 Strategy:
No trades while price is inside the current range. I'm waiting for price to reach the trendline.
If the reaction is weak, I’ll keep the position open, expecting a potential breakout due to multiple prior touches.
Traders seeking confirmation can wait for a clean breakout above 0.07200 or the daily high level.
✅ Summary:
Long-term setup with risk
Clear invalidation and logical entry
Volume behavior supports the idea
May require holding the position for an extended period — manage expectations
Not financial advice — for educational purposes only
📌 Got a specific coin in mind? Drop it in the comments and I’ll chart it for you.
⚠️ Without proper risk management, you're just a ticking time bomb.
Economic Cycles
Positional trade for GoldHuge selling pressure from 3500 and 3400 level. If we calculate weekly swing low to swing high its in premium zone and needs retest till equil zone or discount zone.

Eigen LongCOINBASE:EIGENUSD An interesting DeFi platform to monitor too
EIGEN is a DeFi platform that supports various DeFi transaction activities in it including stacking to building in its ecosystem.

BTC Breaks Downtrend – Eyes on 105911📊 Cycle Status:
🔼 HWC: Bullish
🔽 MWC: Bearish
🔼 LWC: Bullish
Because of this cycle configuration, I’m not looking for short positions. The larger structure still favors bullish momentum.
📈 Structure & Channel Breakout:
BTC broke out from a descending channel with 6 confirmed touches. On the 7th touch, we saw a breakout.
You might ask: "Parsa, what’s the use of a broken channel now?"
Well, here’s why it still matters:
The channel hasn't had a proper pullback yet.
Price might reject from the 10,5911 resistance, which is a strong level.
If rejected, price could revisit the channel’s upper boundary as a retest.
That retest could create a strong R setup on the 15m chart — if we get a clear structure and confirmation.
🧠 Important Notes:
If BTC breaks and holds above 10,5911, this could flip our MWC to bullish, which would be a strong continuation signal.
Until then, I’m waiting and watching for either:
Retest of the broken channel
Clean break and hold above 10,5911
🎯 Targets:
If price holds above current levels, next resistances are:
✅ 108890
✅ 110490
As long as BTC stays above 103880, I won’t be talking about short setups.
📌 Got a coin in mind? Drop it in the comments and I’ll analyze it for you.
⚠️ Without proper risk management, you're just a ticking time bomb.

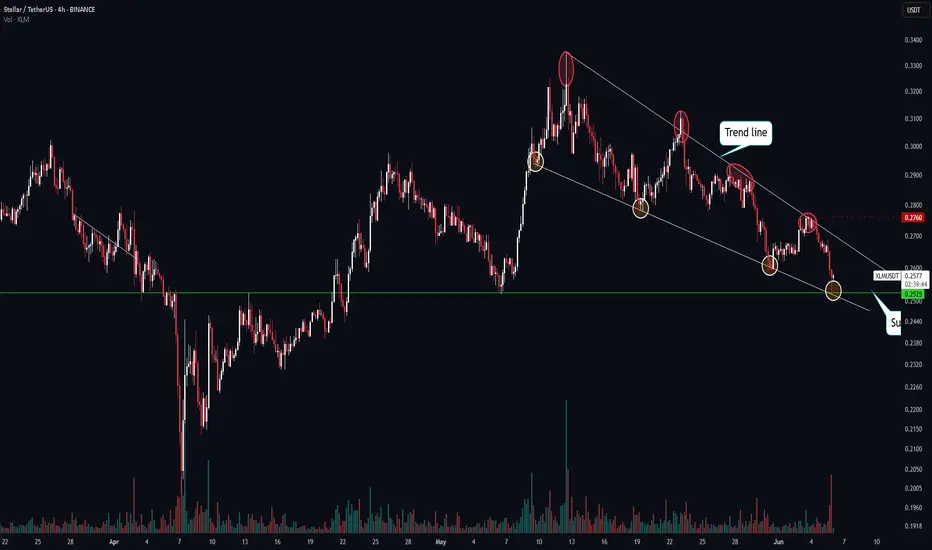
XLM 4H – Compression Breakout Setup in PlayCycle Analysis:
HWC: 🔼 Bullish
MWC: 🔽 Bearish
LWC: 🔽 Bearish
The mismatch between higher and lower cycles shows we're in a transitional phase — a potential pivot zone where the market is deciding whether to reverse or continue its correction.
Market Structure & Pattern:
XLM is forming a clear compression pattern (either a triangle or falling wedge) with the following traits:
Upper trendline has been tested multiple times
Buyers show more pressure than sellers
Breakout to the upside looks more probable, aligning with the HWC direction
Entry Strategy:
If you're looking to enter, wait for a confirmed breakout above the pattern, ideally with:
A full-bodied 4H candle closing above the upper trendline
Volume spike supporting the breakout
Retest and successful bounce on the 15-min timeframe
📍 Stop-loss: Below the last local low
🎯 Target 1: Top of the MWC structure
🎯 Target 2: Full cycle alignment with HWC, if momentum continues
⚠️ Final Note:
Since MWC and LWC are still bearish, any long entry should be managed with tight risk control. A failed breakout could lead to a sweep of the lower range, though less likely based on current price action.
📌 Got a coin you'd like analyzed? Drop it in the comments.
⚠️ Without proper risk management, you're just a ticking time bomb.
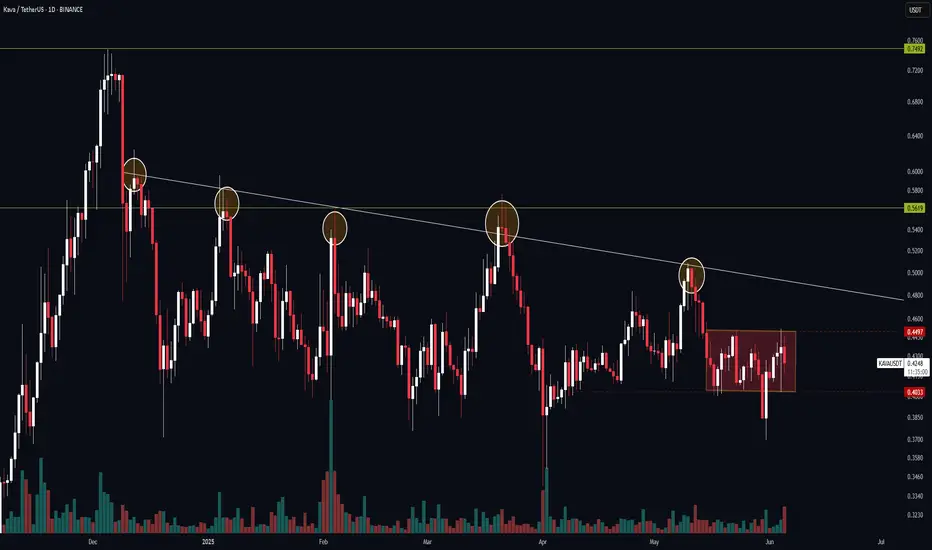
KAVA Ready for Breakout? Watch 0.45 Key Level
📊 Cycle Analysis
🔁 HWC: Ranging
🔁 MWC: Ranging
🔁 LWC: Ranging
The price is currently moving inside a 4H range box. Personally, I avoid trading inside ranges like this due to the high probability of fakeouts and choppy movement.
🧭 My Strategy:
✅ A break above 0.45 (range resistance) could be a solid long trigger, signaling a potential breakout from this consolidation zone.
📈 After entering, I’ll let the price move toward the upper descending trendline, which has seen multiple touches. This increases the odds of a breakout, or at least a strong reaction.
⚠️ If the reaction to the trendline is weak (e.g., no strong rejection candle, low volume), I’ll keep my position open, as the market may break out and offer better R multiples.
🚫 About Short Positions:
Technically, you could short a breakdown from the range, but I won’t be taking any short setups here. I’m focused purely on the long side for now.
📝 Summary:
❌ No trades inside the range box
✅ Long entry on 0.45 resistance break
🎯 Targeting the upper trendline
🧠 If the trendline gives a weak rejection → keep the trade open
🚫 Ignoring short opportunities
📌 Got a coin in mind? Drop it in the comments and I’ll analyze it for you.
⚠️ Without proper risk management, you're just a ticking time bomb.
BTC Eyes 108800 After Triangle Validation📊 Cycle Structure:
HWC (Higher Wave Cycle): Bullish 🔼
MWC (Middle Wave Cycle): Ranging 🔁
LWC (Lower Wave Cycle): Weak Bearish 🔽
⛔ Note: This analysis is only for traders looking for long positions. If you're aiming for shorts, skip this one — I personally won’t short in this setup.
📐 Market Structure:
Bitcoin is currently forming an Expanding Triangle pattern on the 15-minute chart.
The third touch confirmed the validity of the triangle and triggered a strong bullish reaction, which is a good sign of structure strength.
🎯 Long Triggers & Strategy:
🔹 Trigger #1 (Riskier): Breakout above the descending trendline
⚠️ Not my favorite setup due to its shape, but it's still valid. If you use this trigger, manage your risk tightly.
🔹 Trigger #2 (Preferred): Breakout of 106467 resistance
✅ This level aligns with triangle breakout and offers a cleaner entry with better structure.
📌 Target:
In case of a successful breakout, price could push toward 108800, which is a strong resistance zone and a solid place for partial profit-taking.
📌 If there's a coin or pair you'd like me to analyze, drop it in the comments.
⚠️ Without proper risk management, you're just a ticking time bomb.
— PXA

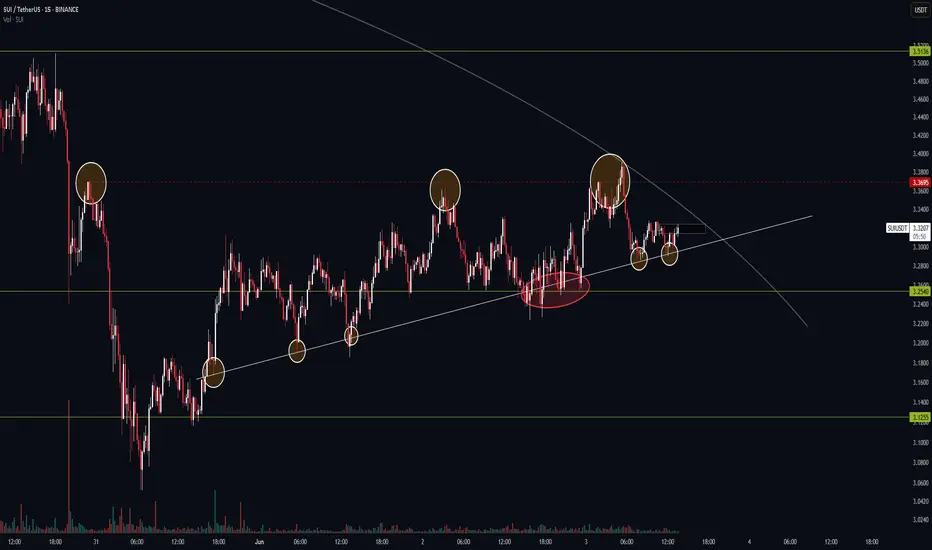
Trendline vs. Resistance — SUI’s Battle on the 15-Minute ChartBINANCE:SUIUSDT
📊 Cycle Structure:
HWC (Higher Wave Cycle): Bullish 🔼
MWC (Middle Wave Cycle): Bearish 🔽
LWC (Lower Wave Cycle): Bullish 🔼
📌 This mixed structure creates a conflicting environment — higher timeframe trend is bullish, but MWC acts as a drag, preventing smooth upward momentum.
📉 Market Structure:
Currently, price is consolidating with a slight bullish tilt. BTC itself is in a very uncertain state, but its cycles are still bullish — meaning SUI might act unpredictably.
We’re looking at two main setups here:
Long Entry: On clean breakout of key resistance.
Short Entry: On breakdown of the descending trendline.
🔸 The 15M descending trendline has already seen 6 touches.
✅ A breakdown could trigger a short setup — but since it's on a low timeframe, don’t expect a massive dump.
🎯 First TP zone for shorts: the 32540 support — a solid zone for partial profit-taking.
🟢 My Personal Preference — Long Bias:
I'm leaning toward the long side for a few reasons:
HWC and LWC are both bullish.
BTC.D just rejected hard from its channel top — signaling altcoins like SUI may perform better.
🔹 32695 has seen 3 touches already, with the third one being a fakeout.
✅ If we see weak selling pressure and strong volume on the next touch, it can be a valid long trigger.
🎯 Potential upside target: the 35135 resistance zone — where a decent reaction is expected.
📌 Want a specific coin or pair analyzed? Drop it in the comments — I’ll pick a few and break them down.
⚠️ Without proper risk management, you're just a ticking time bomb.
— PXA | Structure-Based Precision Trading
Cycle Conflict in BTC — Long Bias Despite Bearish Price Action📊 Cycle Structure:
⬆️ HWC (Higher Wave Cycle): Bullish
⬆️ MWC (Middle Wave Cycle): Bullish
🔁 LWC (Lower Wave Cycle): Ranging (Neutral, no clear direction)
📌 Always keep cycles in mind — they are key tools to understand both long-term and short-term trends and help us manage risk better.
📉 Price Action Inside the Channel:
Price is moving inside a defined channel.
We’ve seen about 6 touches to the channel bottom, but the 5th and 6th touches were weak and didn’t even reach the mid-channel line. This shows buyer weakness at the support zone.
Candles and volume also indicate bearish pressure.
🔄 Conflicting Signals:
Cycles suggest avoiding shorts and keeping a long bias.
But the channel and bearish pressure indicate a possible breakdown.
⚠️ Risk Management:
This is where risk management saves the day!
Enter long with low risk.
Place a tight stop loss so if price moves against us, we exit fast.
If the market moves in favor of longs, we can quickly take the position.
Also, quick profit-taking is advised since this move contradicts the cycle signals.
📍 Key Level:
105,250 — This level can trigger strong reactions but it’s not a confirmation for long entries. It’s mainly a good zone for taking profits and managing positions.
📌 If you want me to analyze a specific coin or pair, just drop a comment.
⚠️ Without proper risk management, you’re just a ticking time bomb.
— PXA

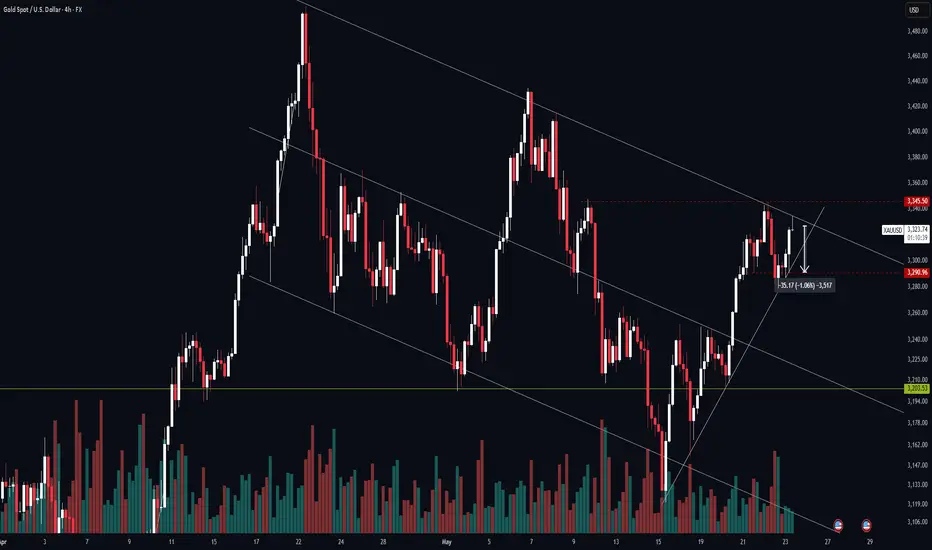
XAUUSD in a Daily Channel — Bears Eyeing a Break at Trendline Re📊 Cycle Structure:
HWC (Higher Wave Cycle): Bearish with a mild slope 🔽
MWC (Middle Wave Cycle): Bullish 🔼
LWC (Lower Wave Cycle): Bullish 🔼
While both the mid and short-term cycles are pushing upward, the dominant bearish trend in the higher timeframe still weighs heavier, tilting the bias toward short setups.
📐 Market Structure:
Price is moving within a descending daily channel.
There's a 1H ascending trendline that has been tested four times already — currently heading into a fifth test.
The previous (fourth) reaction was weak, which statistically increases the chance of a breakout on the fifth touch.
The 3290 zone remains a strong resistance and a good target for short-term profit-taking on short positions.
📈 Alternate Long Scenario:
If buying pressure intensifies and price breaks above the 3345 key resistance, it could trigger a shift toward a bullish bias and challenge the integrity of the descending channel. This would invite breakout traders to join the move. However, this remains a secondary scenario, not the primary focus right now.
📌 Main focus remains on identifying short opportunities near resistance with proper risk management in place.
📌 If you'd like a specific pair or coin analyzed, drop it in the comments — I’ll choose from there.
⚠️ Without proper risk management, you're just a ticking time bomb.
— PXA
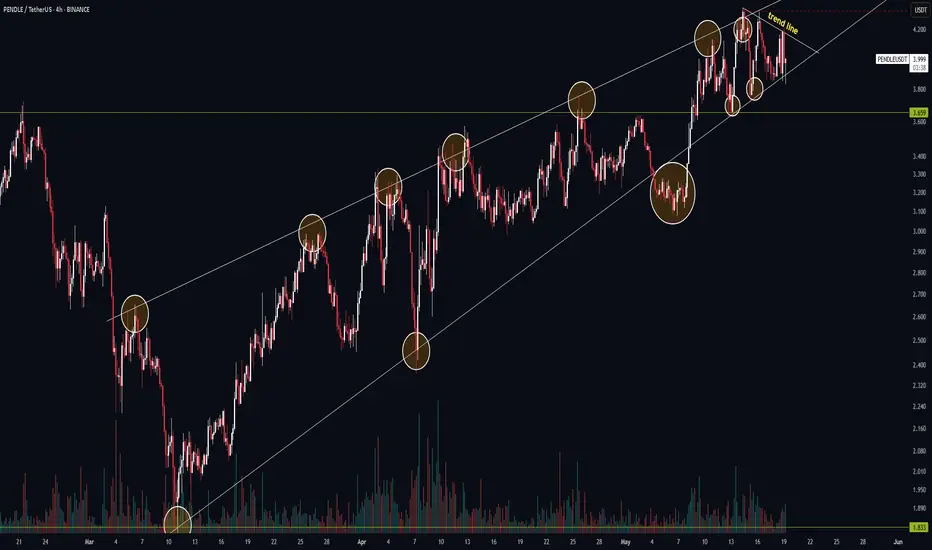
PENDLE 4H Analysis — Market Coiling for a Potential BreakoutBINANCE:PENDLEUSDT
🔹 Cycle Structure:
HWC (High Wave Cycle / Long-Term): Bullish 🔼
MWC (Medium Wave Cycle / Mid-Term): Bullish 🔼
LWC (Low Wave Cycle / Short-Term): Ranging 🔁
With both HWC and MWC showing bullish direction, the overall market sentiment is bullish for now.
🔍 Price Structure Insights:
The market is currently in a compressed range, and price action looks like a spring being coiled — meaning once it breaks out, we might see a sharp move.
Now, let’s remember:
We never deal in certainties — this game is all about probabilities.
Here’s what we're seeing:
More touches to the top of the range → indicates bullish pressure
Decreasing volume during dips → another bullish signal
So, with these confirmations, my bias leans toward the long side.
That said, if a valid short trigger comes up, I’ll mention it — but personally, I won’t take a short on this one.
📈 Long Entry Options (from riskier to safer):
Early Entry: Break of trendline (1H timeframe) — higher risk, earlier entry
Medium-Safe Entry: Break of horizontal resistance at 4.33
Safer Entry: Break of the main trendline (trend-confirmation)
⚠️ No matter how "safe" a setup looks, there’s always a chance of hitting stop-loss.
The safer the setup, the lower the probability of getting stopped out — but it’s never zero.
📉 Short Setup:
A short could be considered below 3.66 (support break)
However, as mentioned — I personally won’t take this short given the bullish context.
📌 If you want a specific coin analyzed, let me know in the comments.
I’ll pick a few requests for the next breakdown.
Without proper risk management, you're just a ticking time bomb. ⚠️
— PXA 📊
4H Bitcoin Analysis — All Eyes on the Midline4H BINANCE:BTCUSDT Analysis
🔹 Cycle Structure Overview:
HWC (High Wave Cycle / Long-Term Cycle): Bullish 🔼
MWC (Medium Wave Cycle / Mid-Term Cycle): Bullish 🔼
LWC (Low Wave Cycle / Short-Term Cycle): Bearish 🔽
The market seems to be offering us a better entry opportunity, and since the higher-timeframe cycles (HWC & MWC) are both bullish, they carry more weight. That’s where our focus is. 📈
🔍 Channel Analysis:
We’ve drawn a clear ascending channel, and here are the key takeaways:
4 valid touches on the top of the channel, indicating buyer strength and a bullish bias.
3 confirmed touches on the bottom of the channel, supporting the structure.
What’s more important:
Price increases volume on the way up,
And volume fades during pullbacks — classic signs of bullish momentum. ✅
⏳ Current Situation:
Right now, price is stuck at the midline of the channel — which is a critical decision zone.
⚠️ If we bounce here, there’s a high probability we’ll head toward the channel top, possibly breaking out.
Also, pay close attention to volume behavior during the latest pullbacks — it’s been dropping, suggesting the correction is losing steam and buyers might be stepping back in soon.
🚫 About Short Positions:
While some may consider shorting if the midline breaks, remember:
That’s against the higher-timeframe bullish cycles.
If you still go for it, you need a tight stop-loss and aggressive partial exits.
Personally, I avoid fighting the bigger trend — not worth the trouble.
🎯 Long Setup Idea:
The key resistance at 102951 is our breakout level.
If price closes a 1H or at least a 15-minute candle above it, that’s your signal.
💬 Want a different coin analyzed next?
Drop it in the comments — if I see strong interest, I’ll cover it in the next update. ⚡
Without proper risk management, you're just a ticking time bomb. ⚠️
— PXA 📊

Range Ending? MWC Correction Might Be Running Out of SteamBINANCE:AVAXUSDT 4H Timeframe Analysis 🔍
🧠 Cycle Breakdown:
• HWC (High Wave Cycle / Higher Timeframe Cycle): Ranging 🔁
• MWC (Medium Wave Cycle / Mid-Timeframe Cycle): Bullish 🔼
• LWC (Low Wave Cycle / Lower Timeframe Cycle): Bearish 🔽
Right now, the HWC has little to no influence, so we focus on the current correction phase of the MWC. That puts us in favor of long positions, as we expect this correction to eventually resolve to the upside.
🔎 Price Structure & Strategy:
Look closely — candles have formed a 15-minute range box. That means a breakout from this box won’t give us a massive move immediately, but it can still offer a decent entry depending on direction.
Since I use a breakout-based strategy, I’ve marked out my key support and resistance levels:
20.20 is a good level to look for long setups.
19.31 is where I’d consider a short, but keep in mind: going short here is against the MWC, so you’ll need tighter risk control.
🎯 Take-Profit (TP) & Reaction Zones:
If price breaks upward:
21.40 is a solid level to partial TP or manage risk.
23.00 is a stronger resistance and has a higher chance of reaction.
⚠️ Important: If price breaks out of the 15-min range box, it’ll count as a valid breakout — but again, expect smaller initial momentum.
Personally, I’ll take partial profits at 21.40, or even fully close the trade, because price might reverse before hitting 23. If not closing, I’ll at least move to breakeven.
📊 Volume Observation:
During the last drop, volume decreased — that’s a typical sign of a correction phase within the MWC, and it aligns with our long bias.
If you'd like me to analyze a specific coin, feel free to drop it in the comments
Without proper risk management, you're just a ticking time bomb ⚠️
— PXA 📊

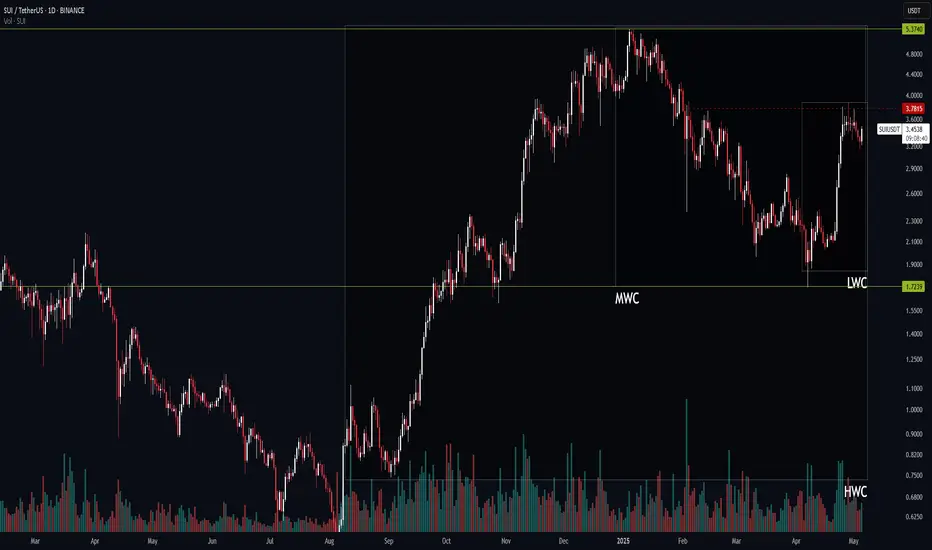
SUI Daily Timeframe – A Big Move Is Loading!BINANCE:SUIUSDT
🧠 Market Cycle Overview:
HWC (High Wave Cycle – Higher timeframe): Bullish 🔼
MWC (Medium Wave Cycle – Medium timeframe): Bearish 🔽
LWC (Low Wave Cycle – Lower timeframe): Bullish 🔼
When the higher and lower timeframe cycles are bullish but the mid-term is bearish, it usually means the market is in a resting phase. This kind of setup can often give us a golden long opportunity! 🎯
📊 Price Action & Volume:
For the past 12 days, SUI has been ranging with decreasing volume. This drop in volume is often a sign that a big move is near. Just be careful — in this phase, the market might make small fakeouts to hit stop-losses.
🔻 Short Setup:
Right now, I’m not opening any short positions until I see the next clear leg.
I wouldn’t recommend shorting either, since it’s going against the main cycles.
But as always, stick to your own plan — this is just my view, not a signal. 👀
🔺 Long Setup:
The $3.7815 level was the last point where price reacted and dropped.
If we get a strong breakout above that, it’s a valid long entry. 🚀
✳️ Since we’re analyzing on the daily timeframe, the confirmation candle for any breakout should close on at least the 1H (1-hour) or preferably the 4H (4-hour) timeframe to be considered reliable.
🎯 Summary:
The market is in a correction, but the primary direction is still bullish.
Long setups are more favorable — just wait for breakout confirmation and manage your entry with patience.
"⚠️ Without proper risk management, you're just a ticking time bomb!"
— PXA 📊
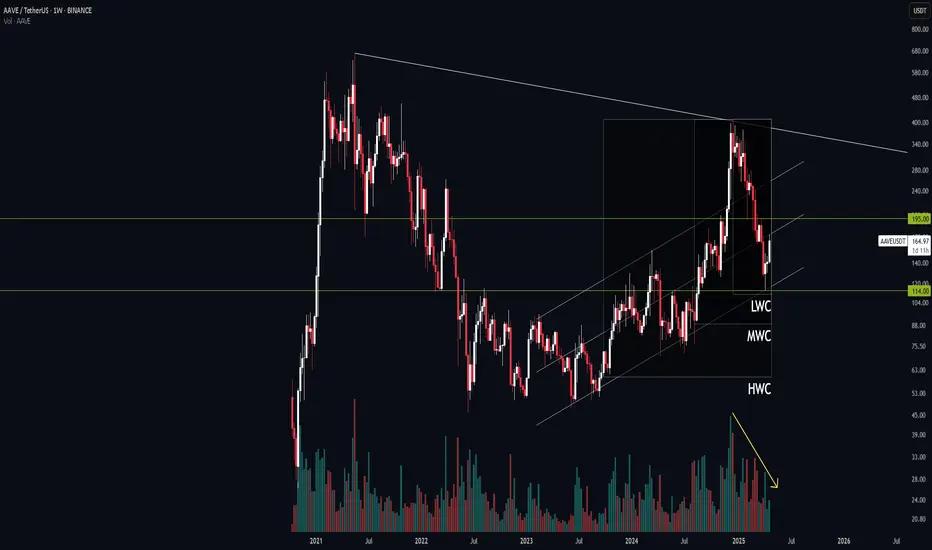
AAVE Price Action: The Calm Before the Storm?BINANCE:AAVEUSDT Weekly Timeframe Analysis 🧠
🔹 Cycles Overview:
HWC (High Wave Cycle): Bullish 🔼
MWC (Medium Wave Cycle): Bullish 🔼
LWC (Low Wave Cycle): Bearish 🔽
When LWC is moving against HWC and MWC, it often means the market is offering a better entry opportunity! 🎯
📈 Current Price Action:
We are currently stuck at the midline of the main channel:
4 touches at the channel bottom.
3 touches at the channel top, plus a breakout and re-entry into the channel.
⚡ If we see a strong rejection from the midline followed by a drop, it could signal that buyers are losing momentum, and the chances of a breakdown below the channel increase. 🚨
⚠️ Risk Management Alert:
Since a short position goes against the higher timeframe cycles (HWC & MWC), it carries higher risk. Stay sharp with risk management! 🛡️
🔎 Volume Observation:
Notice during the last bearish leg, volume is decreasing as price drops.
This could hint at hidden bullish pressure building up beneath the surface! 📉➡️📈
🎯 Setups to Watch:
🔻 Short Setup:
Watch for a clean breakdown below the channel bottom.
(⚠️ Risky — higher chance of hitting stop-loss.)
Alternatively, monitor the $114 zone:
If price reacts weakly here, a breakdown entry might be possible — but again, caution: you’re trading against the main trend.
🔺 Long Setup:
A breakout above $195 would be a strong bullish trigger. 🚀
A midline breakout could offer an early entry, but it’s more risky and requires tight stop management.
🧠 Important Tips:
Since this is weekly analysis, the breakout confirmation should ideally come from a Daily candle close or, at the very least, a strong 4H candle close.
Higher timeframe candles = more reliability ✅
💰 Take Profit Strategy:
First TP: Top of the channel
Second TP: Trendline resistance
"Manage your risk wisely — without it, you're just a ticking time bomb. ⚠️"
— PXA 📊
IEX technical analysisStock Overview: Indian Energy Exchange Ltd (NSE: IEX) is currently priced at INR 187.62. The company operates an electronic platform for trading electricity and renewable energy certificates in India.
Key Levels:
Support: 97.55, 144.81
Upside Swing Zone: 163.83, 193.42
Possible Upside Levels: 289.85, 337.10, 397.30
Technical Indicators:
RSI: The Relative Strength Index (RSI) is at 56.85, indicating neutral to slightly bullish momentum as it is above the midpoint of 50.
Volume: The latest monthly volume is 47.25M, showing a significant increase compared to previous months, suggesting heightened trading activity and interest in the stock.
Sector and Market Context: Indian Energy Exchange Ltd operates within the energy sector, which has been experiencing volatility due to fluctuating energy prices and regulatory changes. Despite these challenges, the stock has shown resilience, maintaining a steady upward trend over the past few years. The overall market trend has been bullish, with increased investor interest in renewable energy and sustainable practices, positively impacting IEX's business model.
Risk Considerations:
Regulatory Risks: Changes in government policies and regulations related to energy trading could impact the company's operations and profitability.
Market Volatility: Fluctuations in energy prices and demand can lead to unpredictable stock movements.
Competition: The presence of other energy trading platforms and technological advancements could pose competitive risks.
Analysis Summary: Indian Energy Exchange Ltd has demonstrated strong performance within the energy sector, supported by increased trading activity and a neutral to slightly bullish RSI. Key levels indicate potential upside, but investors should be mindful of regulatory risks and market volatility. The stock's resilience and alignment with market trends in renewable energy make it a noteworthy candidate for further observation.

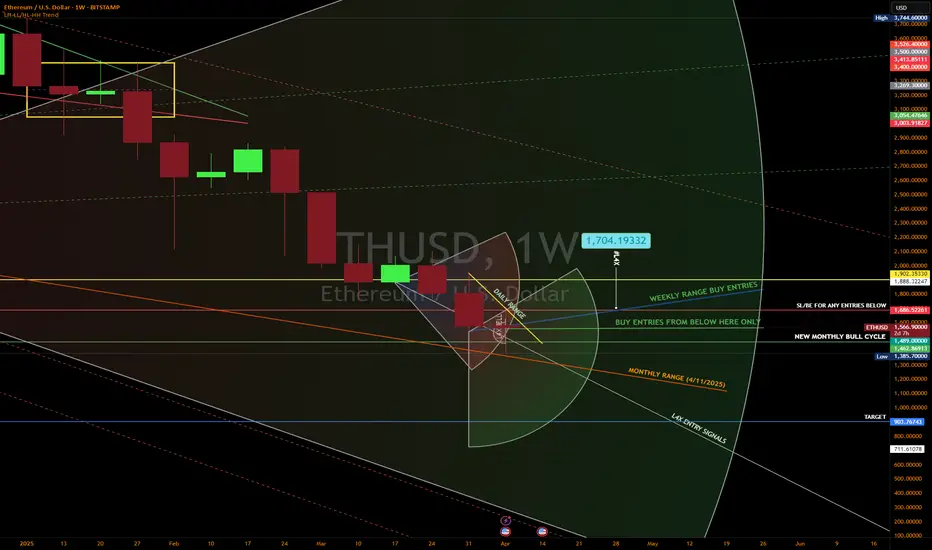
ETH Bull Week and Possibly the MonthBeautiful BULL cycle starting as of April 11, 2025. Hold every BUY position you have below the $1444.84. The 1477.29 LL has been broken. Marking the end of this Weekly Downtrend and sending the Long Buy Signal. Waiting on retest and going long Sunday April 13, 2025 at the
$1412-$1450. The LOWER, the better. I start with small leverage until the breakout is confirmed with the two daily candles. Don't miss out on the possible move! Be ready for a new week.
You're Welcome!! This is my analysis. Hope it helps you with your decisions. Good luck on your trading journey. You can follow me on here and IG. Trust your analysis.
#Latin4X
LAURUS LAB LONG TERM CHANNEL 30% UPTRENDThe Channel is being respected for more than 19 months.
With a steady rise. Low downside potential
Taking Good Support for 200 EMA and channel.
BONUS... Entire Sector is hitting the uptrend.

GOLD Futures ShortThe entire world is bullish on gold. It has run up too much. It looks too stretched. Any possible news that missing gold is found or there is more gold than estimated will send it back down.
There is a gap as well around $2700. I see a 10% correction within 2-3 months.

Long in silver from this level. long in silvermic from this level. according to multi time frame anylysis

possible 10 years breakout irrigation stock MAHINDRA EPCMAHINDRA EPC IRRIGATION 3months chart, price is standing near 10 years trendline and a breakout on closing basis will give a good rally. This is agriculture related FMCG script.
Mahindra EPC Irrigation Ltd., incorporated in the year 1981, is a Small Cap company (having a market cap of Rs 409.26 Crore) operating in Irrigation & Allied Services sector.
Mahindra EPC Irrigation Ltd. key Products/Revenue Segments include Micro Irrigation Systems And Other Agri. Related Products

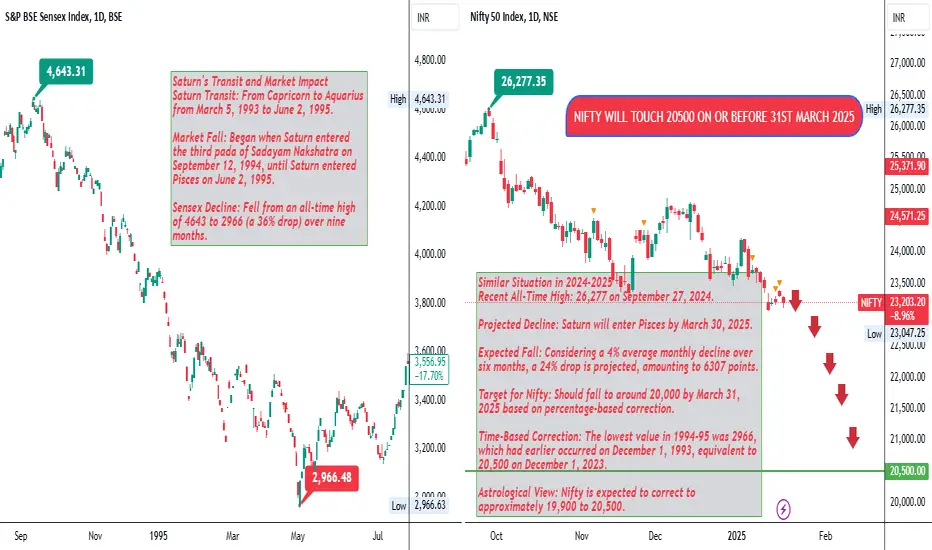
Nifty Astro Technical Analysis from September 2024 to March 2025Saturn's Transit and Market Impact
Saturn Transit: From Capricorn to Aquarius from March 5, 1993 to June 2, 1995.
Market Fall: Began when Saturn entered the third pada of Sadayam Nakshatra on September 12, 1994, until Saturn entered Pisces on June 2, 1995.
Sensex Decline: Fell from an all-time high of 4643 to 2966 (a 36% drop) over nine months.
Similar Situation in 2024-2025
Recent All-Time High: 26,277 on September 27, 2024.
Projected Decline: Saturn will enter Pisces by March 30, 2025.
Expected Fall: Considering a 4% average monthly decline over six months, a 24% drop is projected, amounting to 6307 points.
Target for Nifty: Should fall to around 20,000 by March 31, 2025 based on percentage-based correction.
Time-Based Correction: The lowest value in 1994-95 was 2966, which had earlier occurred on December 1, 1993, equivalent to 20,500 on December 1, 2023.
Astrological View: Nifty is expected to correct to approximately 19,900 to 20,500.
Disclaimer:
I am not Sebi Registered. This analysis is based on historical data, astrological patterns, and market trends. Past performance is not indicative of future results. Trading and investment involve risks, and you should conduct your own research or consult with a financial advisor before making any decisions.
Dixon techEvery stock follows a certain moving average, Dixon technologies respects 40 DMA,
from recent high to low fib levels also suggests that stock is at support of 0.5 levels.
Double confirmation for BUY, can capture atleast 7-10%, fno or cash upto you.
