SBI Stock Analysis: Support Levels and Potential ReboundSBI's stock has returned to a support level of ₹732, with a potential entry point at the long-term 3-year trendline around ₹670, following a recent 15% drop. State Bank of India's Q3FY25 net profit grew 84.32% YoY to ₹16,891 crore7. The bank's loan book also experienced substantial growth, with a YoY increase of 15.8%
Community ideas

Investing in ETFs made simple 101Hello,
Investing in Exchange-Traded Funds (ETFs) can be challenging, especially for beginners who may struggle with selecting the right funds, understanding market trends, and managing risks. With thousands of ETFs available, covering various asset classes, sectors, and investment strategies, it can be overwhelming to determine which ones align with your financial goals. Factors such as expense ratios, liquidity, underlying assets, and market conditions all play a crucial role in making an informed decision.
To simplify this process, we have carefully analyzed and selected a number of ETFs that we believe offer strong potential for growth, diversification, and long-term value. Below, we highlight these ETFs and explain why they could be good investment choices.
ISHARES CORE S&P 500 UCITS ETF U.S. DOLLAR - ISHARES VII PLC
FUND OVERVIEW
The Fund seeks to track the performance of an index composed of 500 large cap U.S. companies.
• Asset Class: Equity (Focused on large caps)
• Accumulation ETF
• Unit price: $643.82
• Benchmark: S&P 500
• Expense ratio: 0.07
Top 10 holdings
• Apple: 7.59%
• Nvidia Corp: 6.61%
• Microsoft Corp: 6.29%
• Amazon Inc.: 4.12%
• Meta platforms: 2.56%
• Tesla: 2.26%
• Alphabet: 2.22%
• Broadcom Inc.: 2.17%
• Alphabet Inc: 1.82%
• Berkshire Hathaway Inc.: 1.67%
Why we think this is a good ETF to have
The iShares Core S&P 500 UCITS ETF (Acc) offers investors a cost-effective way to gain exposure to the 500 largest U.S. companies across various sectors. As a passively managed fund, it seeks to replicate the performance of the S&P 500 Index, making it an excellent choice for those looking for broad market diversification. Having an accumulating structure, dividends are reinvested, maximizing long-term returns through compounding. The fund is managed by Blackrock and is domiciled in Ireland.
SPDR MSCI WORLD COMMUNICATION SERVICES UCITS UCITS ETF USD Acc
Fund Objective
The investment objective of the Fund is to track the performance of companies in the Communication Services sector, across developed markets globally. The MSCI World Communication Services 35/20 Capped Index measures the performance of global equities that are classified as falling within the Communication Services sector, as per the Global Industry Classification Standard (GICS).
• Investment Manager: State Street Global Advisors Europe Limited
• Asset Class: Equity (Focused on companies in the Communication Services sector)
• Accumulation ETF
• Unit price: $67.15
• Benchmark: MSCI World Communication Services 35/20 Capped Index
• Expense ratio:
Top 10 holdings
• Meta Platforms Inc-Class A 18.58
• Alphabet Inc-Cl A 18.30
• Alphabet Inc-Cl C 15.80
• Netflix Inc 7.81
• Walt Disney Co/The 4.11
• Verizon Communications Inc 3.43
• At&T Inc 3.33
• Comcast Corp-Class A 2.96
• T-Mobile Us Inc 2.36
• Deutsche Telekom Ag-Reg 2.13
Fund performance
Why we think this is a good ETF to have
The technology, media, and communications sector is likely to benefit significantly under a Trump presidency. While the tech industry has faced antitrust scrutiny in recent years, Trump has largely ignored or downplayed these cases. His reluctance to support antitrust actions against media giants has indirectly favored them and is expected to continue doing so. During Trump’s inauguration, top tech CEOs were given VIP seats ahead of even some cabinet members, signaling his close ties to the industry. Additionally, Trump owns his own social media platform, "Truth Social," while his close ally, Elon Musk, owns "X." Any restrictive regulations imposed on the sector would directly impact these platforms, making it less likely that heavy-handed policies will be introduced.
A day after his inauguration, Trump announced a major initiative to expand artificial intelligence infrastructure in the U.S., calling it the largest buildout of its kind in history. These factors collectively suggest strong growth prospects for the tech sector under his leadership. Given this favorable outlook, we see an opportunity to invest in an ETF with significant exposure to this sector.
ISHARES GLOBAL HEALTHCARE ETF
Investment objective
The iShares Global Healthcare ETF seeks to track the investment results of an index composed of global equities in the healthcare sector.
• Asset Class: Equity (Focused on the healthcare sector)
• Unit price: $92.57
• Benchmark: S&P Global 1200 Healthcare Sector Index
• Expense ratio: 0.41%
Top holdings
• Eli Lilly- 8.72%
• United Health group Inc- 6.68%
• Johnson & Johnson- 4.74%
• AbbVie Inc- 4.51%
• Novo Nordisk- 3.88%
• Merck & co Inc- 3.61%
• AstraZeneca PLC- 2.92%
• Thermo Fisher scientific Inc- 2.86%
• Roche holding par AG- 2.84%
• Abbott laboratories- 2.82%
Why we think this is a good ETF to have
Investing in a healthcare ETF right now could be especially promising given the anticipated direction of U.S. healthcare policy under President Donald Trump. The administration is expected to stick to its strong deregulation agenda while keeping healthcare access and cost management at the forefront. Looking ahead, the Trump administration intends to uphold campaign promises for the health sector with four key themes: Promote access to healthcare via market competition and transparency, enhance flexibility and choice in healthcare to states and individuals, focus on deregulation by reversing or modifying Biden-era policies and Enhance national security with “America first” principles.
While there is a possibility that efforts to lower drug prices and boost competition might counterbalance some deregulation benefits, the overall push for a more dynamic, less regulated market suggests significant upside potential. For investors, this means your healthcare ETF could stand to gain from a regulatory environment that encourages innovation, speeds up market entry for new products, and drives overall industry growth. We see an opportunity to tap into a changing regulatory landscape with high potential for growth and innovation through investing in the Ishares Global Healthcare ETF.
VANGUARD FINANCIALS ETF
Investment Objective
The fund seeks to track the performance of the MSCI US Investable Market Index (IMI)/Financials 25/50, investing in multi-cap equity within the financials sector. It is passively managed, employing a full-replication strategy when possible, but resorts to a sampling approach if regulatory constraints arise to maintain the index’s key characteristics. The fund remains fully invested, with low expenses helping to minimize net tracking error.
Asset Class: Equity (Focused on the US financial sector)
Unit price: $126.28
Benchmark: MSCI US Investable Market Index (IMI)/Financials 25/50
Expense ratio: 0.10%
Dividend schedule: Quarterly
Ten largest holdings
JPMorgan Chase & Co. 8.7 %
Berkshire Hathaway Inc. 7.7 %
Mastercard Inc. 5.5 %
Visa Inc. 4.8 %
Bank of America Corp. 3.9 %
Wells Fargo & Co. 3.1 %
Goldman Sachs Group Inc. 2.3 %
American Express Co. 2.2 %
S&P Global Inc. 2.0 %
Morgan Stanley 1.9 %
PERFORMANCE
Why we think this is a good ETF to have
Optimism is building for more deal making in a Trump presidency, with activity showing signs of life. After a relatively low year in global mergers & acquisitions in 2023, 2024 witnessed a moderate uptick as the pandemic receded further into the rear-view mirror, the U.S. economy stabilized, inflation declined, financing markets brightened, albeit modestly, and equity markets climbed ever higher. While the business grew in 2024, heightened regulatory enforcement, among other factors, led to fewer very large transactions. The return of President-elect Donald Trump to the White House, with the Republican party having majorities in both houses of the U.S. Congress, is expected to bring a more business-friendly, deregulatory approach to policymaking, and further solidifies widespread expectations among market participants that M&A activity will increase in 2025. The Vanguard Financials ETF gives you exposure to the financial sector at a low cost. Given the above, we see opportunity in owning the ETF.
All the above information has been compiled from
ETF screener: in.tradingview.com
ETF news: in.tradingview.com & in.tradingview.com
ETF ideas: in.tradingview.com
Good luck

Oil India Double bottom Bullish TradeBuy oil india
Entry- 430
Support- 410
Target- 460 470
Pattern- Double bottom at support and a bullish engulfing candlestick pattern.
Note- It has result tomorrow so Keep this in Mind.
Disclaimer- This is just for educational purpose please take advice from your financial advisor before making any decision.
Jai Shree Ram.

VadilalVadilal Industries looks good on the bullish flag.
Short term breakout inside the channel.
Target will be 5000 in next 3 months.
Good to accumulate for the next 3-6 months.

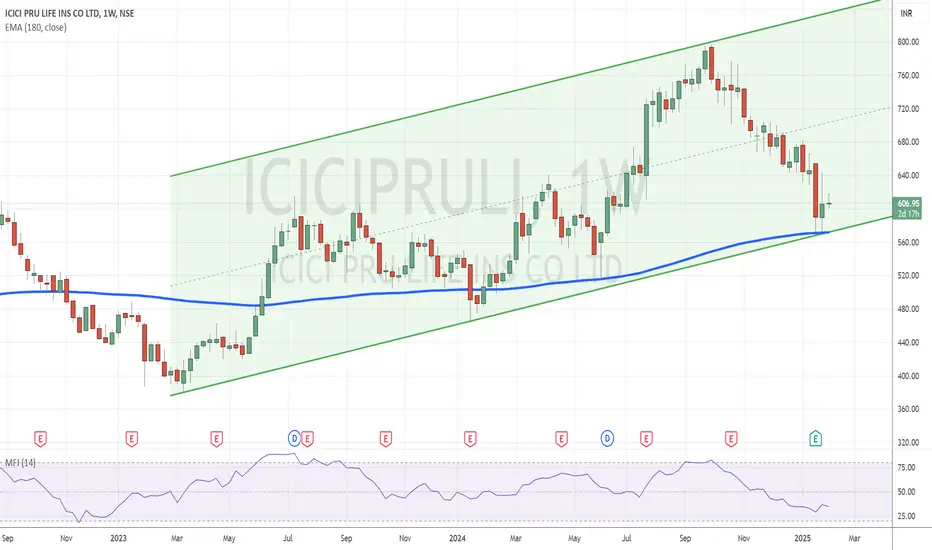
ICICI Prudential: Oversold and Poised for Recovery Topic Statement: ICICI Prudential Life Insurance has made a healthy correction, positioning itself near strong support levels within an up-trending channel.
Key Points:
1. The company reported a robust 43% profit growth QoQ.
2. The price is moving in an up-trending channel, providing clear trading opportunities.
3. The stock is taking support at the lower end of the channel, indicating oversold conditions.
4. The price is near the 180-day moving average, reinforcing the oversold status.
5. Weekly MFI is at 34 which also indicates the price being oversold.
Titan - Keep On WatchCMP 3580 on 03.02.25
The above chart shows that the price has been traveling in a rising parallel channel in recent sessions. At this moment, the price has touched the upper edge of the channel. If rejected from these levels, a bearish move may be seen further.
Targets may be 3510/3330 and 3190.
Please keep in mind the earnings day around 4th February.
This setup fails if the price sustains above 3710.
Plan your trade as per your risk management. ( entry and exit)
The above illustration is my view. It is only for learning and sharing purposes, not a trading recommendation.
All the best.

#Zomato cash : Looks good above 242.10#Zomato cash -Positional call
03. Feb 2025
Looks good above 242.10
Stoploss 220
Tgt 264-265/297-300
Cmp 238

Nifty 50 | Falling Wedge Pattern – A Bullish Breakout Ahead?Hello everyone! I hope you all are doing great in life and in your trading journey. Today, I have brought an in-depth analysis of Nifty 50 , focusing on a powerful Falling Wedge Pattern that is currently forming on the charts. This pattern is known for signaling a bullish reversal , provided we get a confirmed breakout . If this pattern plays out as expected, we could witness a strong upward move in the coming sessions.
Currently, Nifty is trading near a strong support zone around 22,777 – 22,900 , where buyers have previously shown interest. The price is moving within a converging downward-sloping range , indicating that selling pressure is weakening . Key resistance levels to watch post-breakout include 23,700, 24,207, 24,781, 25,191, and 26,277 , with a stop-loss placed below 22,777 to manage risk effectively . However, this analysis holds true only if Nifty breaks out of the Falling Wedge Pattern; until then, caution is advised.
If the breakout is confirmed with good volume, we might see a strong rally ahead, potentially targeting the marked resistance levels. As always, patience and discipline are key—wait for confirmation before making any trading decisions.
Disclaimer:- This analysis is for educational purposes only. Please trade responsibly and consult a financial advisor before making any decisions.
If you found this analysis helpful, don’t forget to like, follow, and share your thoughts in the comments below! Your support keeps me motivated to share more insights. Let’s grow and learn together—happy trading!

JK LAKSHMI CEMENT LTD.Presenting One More Chart Analysis after a Long time...
JK LAKSHMI CEMENT LTD Chart is quite strong with Bullish View and looks promising at CMP 813.00.
Patterns are drawn on Daily Chart and as usual complex & detailed drawing with Price Analysis is presented considering all the aspects of the chart.
Target & SL is as follows:
Tgt: 950.00 and above
SL: 750 (Closing Basis)
Market is all about OPPORTUNITY / ENTRY / TIMING !!!!!
Basis some minute observations, chart analysis is made, target and SL is given to understand the core of the subject and for learning purpose only.

KSB Ltd: Channel Breakout on Budget 2025 Irrigation BoostDetails:
Asset: KSB Ltd
Breakout Level: Channel breakout confirmed
Potential Target: To be determined based on momentum
Stop Loss: Below breakout level or as per risk tolerance
Timeframe: Short to medium-term
Rationale: KSB Ltd has given a channel breakout following positive news on irrigation development in the Budget 2025. Increased government focus on infrastructure and irrigation projects could drive further upside.
Market Analysis:
Technical Setup: The breakout confirms strong bullish sentiment, with sustained buying interest.
Sector Boost: Budget-driven demand for industrial pumps and irrigation solutions strengthens KSB’s growth outlook.
Risk Management:
Implement a stop loss below the breakout level to mitigate downside risks.
Timeframe:
Short to medium-term move expected, depending on follow-through buying.
Risk-Reward Ratio:
Favorable, backed by technical breakout and fundamental sector growth.
Monitor for sustained momentum and volume confirmation post-breakout.

The Budget Effect- Key ObservationsThe market often reacts to major political or economic events, with people setting high expectations. These expectations, whether positive or negative, lead to wild market swings and hence higher volatility. However, when you take a look at the Nifty’s long-term chart, you’ll see that the impact of such events tends to be pretty small within the overall market structure. During a strong bull market, the market usually absorbs a big negative news. There might be a short-term dip, but within a few weeks or months, things typically stabilize, and the market resumes its upward trend.
With the budget announcement coming up tomorrow, here are some key observations based on the budget’s impact on the market over the last five years, both in the short-term and long-term perspective:
🔘 Budget Week Trend: The market has generally closed higher in the budget week (meaning the close was above the open), except in 2020 when it ended in the red. Based on this, there are good chances that the market could close green this week as well.
🔘 Post-Budget Market Behavior: After the budget news, the market has mostly resumed its prior short-term trend, except in 2020. Here’s a quick note of what happened in previous years:
2021: The market consolidated for 11 weeks before bouncing back and resuming into its strong bull trend.
2022: The market was in a bearish phase from late 2021 and continued that trend for 19 weeks after the budget, despite some strong rallies in between.
2023: The short-term downtrend continued for another 7 weeks after the budget.
2024: The market consolidated for 15 weeks before picking up the bullish trend again.
2025: Since September 2024, we’ve been in a downtrend, so based on the last four years observations, it seems likely this short-term downtrend could continue for a few more weeks.
🔘 Breaking the Budget week Low: If the market is already in a correction before the budget, there's a chance it could dip further if the budget week low is breached.
🔘 Breaking the Budget Week High: Just because the market breaks above the budget week high doesn’t necessarily means we are going for a big rally. It could also lead to consolidation or a continuation of a short-term downtrend until a higher high is established. In 2025, any bullish move below 24858 would not confirm a change in short term trend.
🔘 Long-Term Bullish Trend: In all of the past years, after the short-term effects of the news is over, the market has resumed its longer-term bullish trend.
Now this is up to a trader how he interprets these observations. A short-term trader might be looking for short term moves and short the rallies, whereas a long-term trader will focus on the long-term bullish trend and buy the pullbacks.
So, what’s your approach? Feel free to drop a comment below, and don’t forget to like or share if you want more educational content in the future.

Inverse head-and-shoulders - Coal IndiaInverse head-and-shoulders chart pattern
is an important indicator for identifying bullish reversals.
Characterized by three (3) distinct troughs: a lower "head" between two (2) higher "shoulders,"
this pattern signals a potential shift from a bearish to a bullish trend when the price breaks
above the "neckline."

MAZDOCK - Ready for the next moveThe stock has been a market favorite. Technically it has cooled down owing to the Wave analysis which every stock goes through. Overall the Stock is in Stage 2. The stock is now gearing up to give Range Breakout.
On the Fundamental side:
- Strong Long Term Fundamental Strength with an average Return on Equity (ROE) of 24.14%
- Healthy long term growth as Net Sales has grown by an annual rate of 24.97% and Operating profit at 94.40%
- Company has a low Debt to Equity ratio (avg) at 0 times
- The company has declared Positive results for the last 8 consecutive quarters
- NET SALES(9M) At Rs 8,217.50 cr has Grown at 35.18 %
- ROCE(HY) Highest at 44.63 %
- INVENTORY TURNOVER RATIO(HY) Highest at 2.19 times
- Increasing Participation by Institutional Investors. Institutional investors have increased their stake by 0.56% over the previous quarter and collectively hold 3.02% of the company.

Vani Commercial - Bullish Pennant Breakout- 3 rising methodsIt has formed bullish pennant breakout with three rising methods candlestick patterns on the monthly chart. On weekly it shows a VCP Pattern with Higher high, Higher low with 50 MA as support and overall, 3 years of consolidation can be seen.
Hopeful of showing a good move in the upcoming months specially in February
CMP: 12.70
Target 1: 15.70
Target 2: 18.00
Stop Loss: 10.70
Disclaimer: Trade at your own risk

Laurus Labs Date 28.01.2025
Laurus Labs
Timeframe : Weekly Chart
Remarks :
1 Currently at 50% of Fibonacci retracement
2 Head & Shoulder at top of the trend & its neckline + Support & resistance band = 615
3 Descending triangle neckline + Support base + 61.8% retracement of Fibonacci = 497
4 Currently at RSI mean reversion + 50% retracement, may have 2%-4% pull back
Regards,
Ankur

Parallel channel breakout with retest in Laurus LabsNSE:LAURUSLABS
A bullish parallel channel breakout has happened with a retest at 550 levels.
Currently on a weekly level stock can go past 600 with a buying price at 570-580 levels & subsequently increase beyond 600.
A SL of 450 with a higher target of 700, 900 & 1100 can be achievable in 1 1-year time frame.

VBLwe see this stock at weekly support and as per CPR concept we do see coming week it formed narrow cpr on weekly and same narrow on daily time frame expecting a momentum based move coming week just a view not a reco...

Gold’s Liquidity Gap: Bearish Signals Align with Market Shifts🔍 Insights from FVG (Fair Value Gaps):
The chart highlights key Fair Value Gaps (FVG) – liquidity voids that price tends to revisit and fill.
FVG acts as a magnet: Prices often retrace to these zones to rebalance liquidity.
Currently, gold is trading near the strong resistance level of $2,786, which could trigger a significant correction.
📊 Key Levels to Watch:
Major Resistance Zone:
$2,786 - $2,790: This is a strong resistance area where a reversal is highly probable if selling pressure dominates.
Important FVG Zones:
$2,728 - $2,683: Price is likely to revisit this zone to fill the liquidity gap.
$2,580: If selling pressure persists, this zone will be the next target.
🔄 Market Behavior and SWAP CHARGE Alignment:
SWAP CHARGE shifting from buying to selling:
This is a strong indicator that selling volume is gaining dominance, aligning with the likelihood of price retracing to lower FVG levels.
Formation of a bearish trend:
Failure to break the $2,786 resistance and potential retracement toward lower FVG zones reinforce the expectation of a bearish cycle.
💡 Conclusion:
Forecast: Given the current market behavior and SWAP CHARGE data, it is highly likely that gold prices will correct toward lower FVG zones such as $2,728, $2,683, and even $2,647.
Trading Strategy Tips:
Closely monitor price reactions at major resistance levels before entering trades.
Use the FVG zones as key targets when the bearish trend is confirmed.
👉 Reminder:
Always set your TP/SL levels to protect your account and manage risks in this volatile market.
📢 Follow KevinNguyen-SimpleTrade for more in-depth analysis and effective trading strategies! 🚀

How to define the Daily Bias for the Day? Determining the likely direction of the market for a particular day can be both challenging and cumbersome. Many traders find themselves overwhelmed by the multitude of data points and differing indicators. However, using a structured methodology, one can systematically analyze the chart and create a daily bias for the day.
If you are an intraday trader, you can use a combination of the Daily chart for the bias and the 15-minute chart for the entry, or alternatively, you can use a 75-minute chart for the bias and a 5-minute chart for the entry.
Steps to Identify the Daily Bias
1. Identify the Most Recent Swing High and Swing Low
The first step in defining the daily bias involves identifying the most recent swing high and swing low. This can be done manually, or you can use ready-made indicators available on trading platforms such as TradingView to plot these points on the chart. Understanding swing highs and lows are fundamental concepts in technical analysis, representing the highest and lowest points within a specific time period. These points can indicate potential reversal areas where the market may change direction.
2. Divide the Region into Two Equal Parts
Once the swing high and swing low are identified, the next step is to divide this region into two equal parts. This can be achieved using the rectangle tool in TradingView. Make sure to enable the middle line feature within the rectangle tool to visually divide the two sections. The middle line acts as a crucial reference point, providing a clear visual boundary between areas of perceived higher and lower value.
3. Define Retail and Wholesale Areas
After dividing the region into two parts, the upper section is termed the “Retail Area,” where prices are considered expensive. Conversely, the lower section is called the “Wholesale Area,” where prices are deemed cheap. This concept stems from the basic economic principle of supply and demand, where higher prices in the Retail Area suggest selling opportunities, and lower prices in the Wholesale Area indicate buying opportunities.
4. Focus on Buying and Selling Opportunities
With the areas defined, the next step is to focus on the appropriate trading opportunities. When prices are in the Retail Area, the focus should be on “Selling” opportunities. When prices are in the Wholesale Area, the focus should be on “Buying” opportunities. This methodology, known as “Curve Analysis” or determining your Bias for the day, simplifies the decision-making process by providing a clear framework for evaluating market conditions.
Example: BankNifty 75-Minute Chart
Let’s look at an example to understand this better. Here we have the BankNifty 75-minute chart. We have identified the most recent swing high and swing low on the chart and divided the section into two parts. The current market price is in the Wholesale Area, which means that on your execution time frame, which is 5 minutes, you will be focusing on buying or “Long” opportunities.
Now, proceed to the lower time frame and identify your key levels of interest using support, resistance, demand, supply, or any other technical analysis tools. Observe how the supply zone on the chart played out beautifully and how prices fell from the Retail Area. This example illustrates the practical application of the methodology, demonstrating how historical price movements can inform future trading decisions.
While the above steps provide a solid foundation for defining the daily bias, incorporating the following advanced tips can enhance your trading efficiency:
1. Use Multiple Time Frames
Integrate multiple time frames to gain a comprehensive view of the market. For example, use the Daily chart to determine the overall bias and the 15-minute or 5-minute chart for precise entries and exits. This multi-time frame analysis allows traders to align shorter-term trades with the broader market trend, increasing the likelihood of successful outcomes.
2. Incorporate Technical Indicators
Employ technical indicators such as Moving Averages, RSI, and MACD to corroborate your bias. Confirming signals from multiple sources can provide greater confidence in your trades. These indicators serve as additional tools to validate the defined bias, offering insights into market momentum, overbought or oversold conditions, and potential trend reversals.
3. Monitor Economic News
Stay updated with economic news and events that could influence market movements. Important news releases can cause significant price fluctuations, impacting your defined bias. Economic indicators, such as GDP reports, employment data, and central bank announcements, can have profound effects on market sentiment and price action.
4. Practice Risk Management
Always practice sound risk management strategies. Define your risk tolerance levels and use stop-loss orders to protect your capital. Never risk more than you can afford to lose on any single trade. Effective risk management involves setting appropriate position sizes, diversifying trades, and adhering to pre-defined risk parameters to safeguard against unforeseen market movements.
5. Keep a Trading Journal
Maintain a trading journal to record your trades, strategies, and outcomes. Analyzing past trades can help you refine your methodology and improve future performance. A detailed journal provides valuable insights into trading patterns, strengths, and areas for improvement, fostering continuous learning and development.
Conclusion
Defining the daily bias for the day is crucial for successful intraday trading. By following the structured steps of identifying swing highs and lows, dividing the price region into Retail and Wholesale areas, and focusing on appropriate buying and selling opportunities, traders can streamline their market analysis. Remember to use multiple time frames, incorporate technical indicators, stay informed about economic news, practice risk management, and maintain a trading journal. With these strategies in place, you can effectively navigate the markets and enhance your trading performance.
I hope you all find this article useful. Do give your valuable feedback in the comments section.

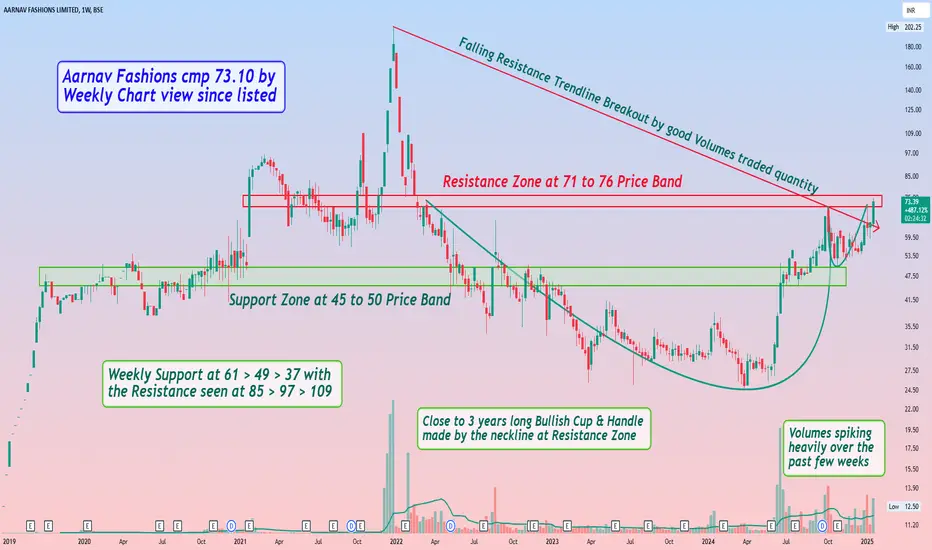
Aarnav Fashions cmp 73.10 by Weekly Chart view since listedAarnav Fashions cmp 73.10 by Weekly Chart view since listed
- Support Zone at 45 to 50 Price Band
- Resistance Zone at 71 to 76 Price Band
- Volumes spiking heavily over the past few weeks
- Falling Resistance Trendline Breakout by good Volumes traded quantity
- Close to 3 years long Bullish Cup & Handle made by the neckline at Resistance Zone
- Weekly basis Support seen at 61 > 49 > 37 with the Resistance seen at 85 > 97 > 109
Zensar Technologies W pattern Breakout. 🚨 Zensar Technologies Trade Alert 🚨
🔍 Setup at a Glance:
Pattern: W-pattern forming within a trading channel 📈
Breakout Level: ₹840
Support Zones:
Channel support
200 DMA (holding since March 2024)
Trend: Overall uptrend, trading above key DMAs ✅
Volume: 🚀 2x-3x higher than previous sessions today!
RSI: Strong and supportive – signaling momentum.
💡 Trading Plan:
Entry: Above ₹840 (start small; e.g., buy just 10% of your usual quantity).
If the stock closes above ₹840, you can consider adding more.
Target (T1): ₹1025 (channel top) – +21% upside potential 🎯
Stop Loss (SL): ₹709 – -16% downside risk 🔻
Risk-Reward Ratio (RR): ⚖️ 1:1.3
⚠️ Key Risks & Considerations:
Market Structure:
Currently in a Lower High - Higher Low (LH-HL) sequence.
This trade goes against the broader trend – a higher probability of failure!
Why Consider It?
Exceptional volume and strong RSI, combined with a well-defined W-pattern and breakout level, make this setup compelling.
🚦 Risk Management Tip:
Example Position Sizing: If you usually buy 100 shares, start with only 10 shares initially.
⚠️ Disclaimer: This analysis is for educational purposes only.
Please assess your own risk tolerance and consult with a financial advisor before trading. 📘
💬 What’s your view on Zensar? Let’s discuss in the comments below! 👇

BBTC: Showing strength from a critical level!⚡️Price Analysis:
1️⃣ Perfect retest of 5-year ATH breakout level.
2️⃣ Overall price structure is bullish.
3️⃣ EMAs are providing dynamic support to the price.
4️⃣ Volumes are good.
5️⃣ Price respecting and bouncing from the fibonacci 60% retracement level.
✨ Key Observations:
➡️ Multiple timeframe alignment showing strength
➡️ Ideal RRR setup at current retest level
➡️ 1:3 RRR can be expected.
➡️ Multiple target zones visible on upside
➡️ Trend structure remains strongly bullish
⚠️ Disclaimer: This is NOT a buy/sell recommendation. This post is meant for learning purposes only. Views are personal. Please, do your due diligence before investing.⚠️
💬 Drop your thoughts on the analysis below! ✌️
🔥 Happy Trading!✅🚀

Stock to watch !!!Good setup to break ALL TIME HIGH !!! Recent we can see volume buildup and taken strong support .
Wait to take support at 61.80 level.
