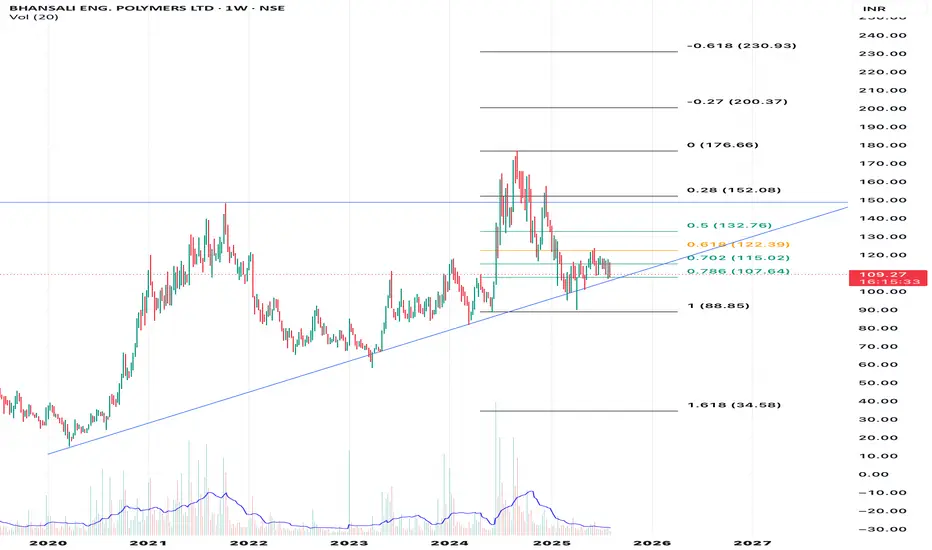
Weekly chart of Bhansali Engineering Polymers Ltd (BEPL) on NSE🔍 Technical Analysis Summary
1. Current Price & Trend
• Current Price: ₹109.27
• Price Action:
• Price is sitting just above the 0.786 Fibonacci level (~₹107.64).
• It has pulled back from recent highs near ₹152.
• Currently hovering near the ascending trendline support from the 2020 lows.
⸻
2. Support & Resistance Levels
📉 Support Levels
• Trendline Support: Rising trendline from 2020 (~₹107–₹110 range).
• Fibonacci Support Levels:
• 0.786 Fib: ₹107.64 ✅ (Currently acting as support)
• 1.000 Fib: ₹88.85 (Major support if breakdown occurs)
📈 Resistance Levels
• Immediate Resistance:
• 0.702 Fib: ₹115.02
• 0.618 Fib: ₹122.39
• 0.5 Fib: ₹132.76
• Major Resistance:
• ₹152.08 (0.28 Fib) – previous swing high
⸻
3. Chart Patterns
• Symmetrical Triangle / Ascending Triangle Formation:
• Price is coiling within a tightening range between horizontal resistance and rising trendline.
• A breakout above ₹122–₹132 could indicate bullish continuation.
• Breakdown below ₹107 and especially ₹88.85 may trigger bearish momentum.
⸻
4. Volume Analysis
• Volume is relatively subdued recently.
• Previous price surges have been supported by spikes in volume — important to watch for volume breakout confirmation.
⸻
🧭 Possible Scenarios
✅ Bullish Scenario
• Hold above ₹107 support and break above ₹115–₹122 zone.
• Target: ₹132 (0.5 Fib) → ₹152 (swing high) → ₹176 → ₹200+
❌ Bearish Scenario
• Breakdown below ₹107 with volume.
• Breakdown of trendline → ₹88.85 (strong horizontal + Fib support)
• Deeper downside if ₹88 breaks → ₹34.58 (1.618 Fib extension)
⸻
🧠 Final Thoughts
• The chart is at a make-or-break zone, testing strong confluence of support (Fib 0.786 + rising trendline).
• Traders may watch ₹107 closely for support.
• Investors should keep an eye on a breakout above ₹122 with volume for potential re-entry.
Community ideas
Jio Financial Services Ltd (JIOFIN)New Product Offerings:
The company has ventured into loans against securities, digital insurance for autos and two-wheelers, and ship leasing. Plans to finance solar panels and IT equipment, along with expanding its business correspondent network to 16,000 locations, will further diversify revenue streams.
Share Price Targets for 2025-26 ₹ 400/ -
My forecasts for Jio Financial Services’ share price in 2025-26 vary, reflecting different assumptions about market conditions and company performance:
2025 Share Price Targets: Estimates range from ₹208.50 to ₹345, with an average target of around ₹250–₹325. Optimistic projections, like those from Exla Resources, suggest a high of ₹425, driven by strong backing from Reliance Industries and technological advancements. More conservative estimates, predict a maximum of ₹331.75.
2026 Share Price Targets: Projections for 2026 range from ₹282.40 to ₹462, with an average target of approximately ₹330.80–₹580. Growth in lending, insurance, and wealth management, along with continued technological innovation, is expected to drive these targets.
Disclaimer: The above analysis is based on available data and should not be considered financial advice. Always conduct thorough research and consult with a certified financial advisor before making investment decisions.

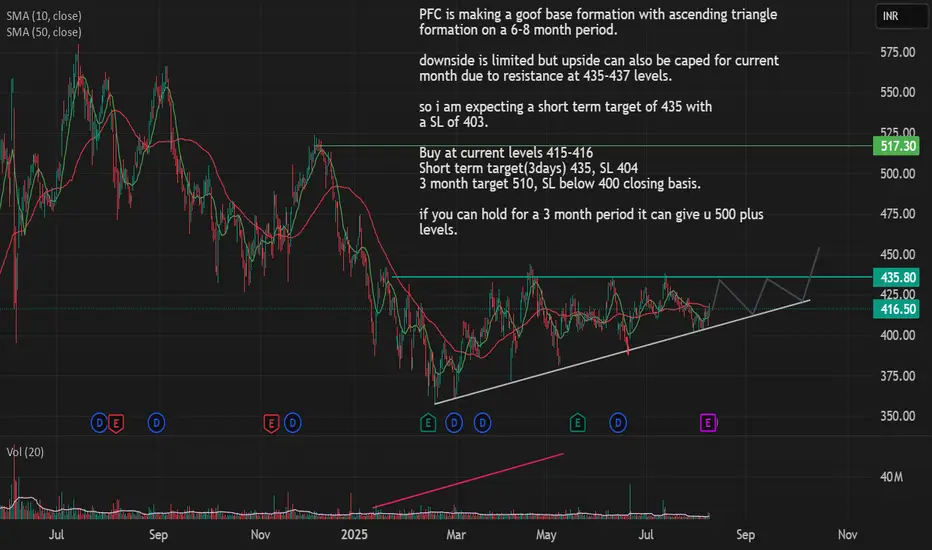
PFC bottoming outPFC is making a goof base formation with ascending triangle formation on a 6-8 month period.
downside is limited but upside can also be caped for current month due to resistance at 435-437 levels.
so i am expecting a short term target of 435 with
a SL of 403.
Buy at current levels 415-416
Short term target(3days) 435, SL 404
3 month target 510, SL below 400 closing basis.
if you can hold for a 3 month period it can give u 500 plus levels.
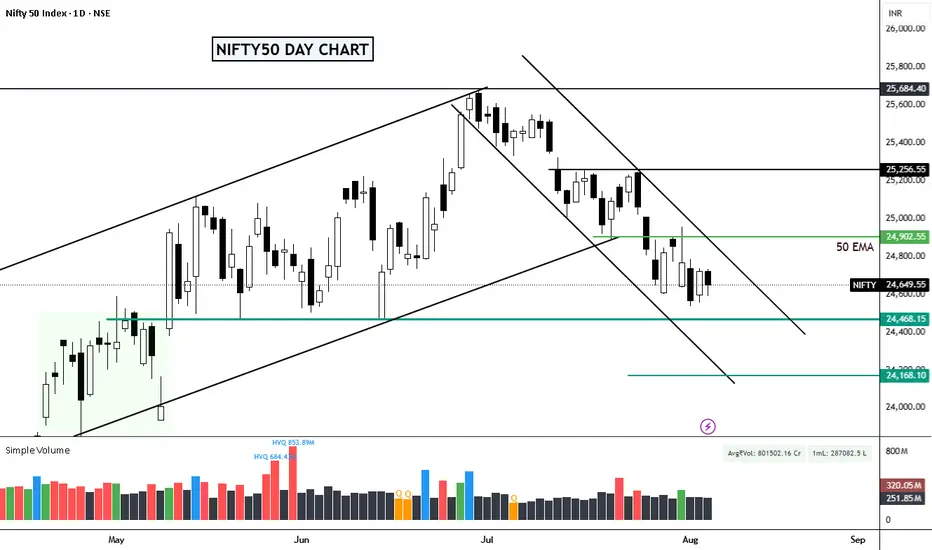
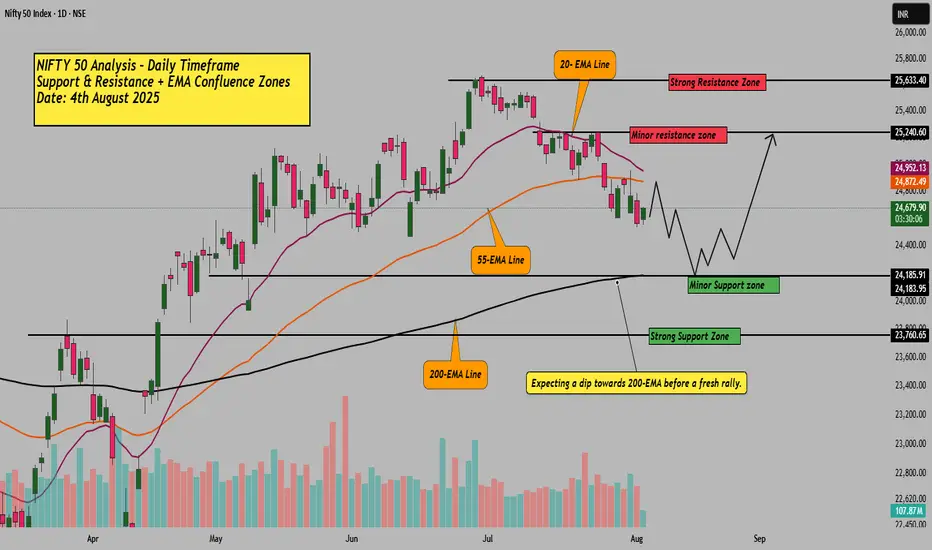
Nifty at important level - August 7Trump imposed an additional 25% tariffs on Indian goods, bringing the total to 50%. Will it affect market movement today? Nifty is sustaining above the 24500 zone so far. Will it break it? According to the daily chart, where is the support?
The support is in zone 24460 - 24480. If this level is also breached, we can expect the price to find support in the zone of 24360 -24380.
Now we will see how to trade using these levels.
If the price opens in the zone 24460 and shows bullish strength, then it can move towards 24600.
If there is no trend strength, then we can expect range volatile movement in the area 24360 to 24500. Please remember the price is in a bearish trend, and bears will try to make the price fall during every pullback towards 24600.

Apollo hospital- short fro 10 %Bearish Technical Points
1. Major Pivot Resistance
The stock has failed to break above the ₹7,564 pivot level, a previous high.
This pivot is now acting as strong resistance, evidenced by multiple rejections.
2. Repeated Rejection at Resistance
Price has tested the same level thrice and failed each time, suggesting supply dominance at that level.
The most recent candle shows a rejection wick, confirming selling pressure.
3. Negative Divergence on RSI-like Indicator (possibly DMI/CCI)
The oscillator below the chart shows lower highs while price made equal or higher highs.
This is a classic bearish divergence, indicating weakening momentum.
4. Bearish Candlestick Patterns
The recent candles are forming small-bodied or upper-wick candles near resistance — often precursors to a pullback or trend reversal.
5. Volume Drop
Despite the price pushing higher recently, volume is decreasing, indicating lack of conviction among buyers.
6. Risk-Reward Setup Implies Downside
The red zone on the chart implies a short position with a significant downside target (~₹6,616).
The stop-loss region (~₹7,564) suggests the trade idea assumes the pivot won’t break.

Nifty Navigator - Trading Switch is off NSE:NIFTY (06 - August )
👉Stuck below 50EMA & above previous demand zone.
Too much silence out there for long traders,
Now Next Resistance is - 50 EMA zone as of now, uncertainty building up
Seems like the current pause is just a pullback in the correction leg, and it should hit the support zone and build a linear base before moving up.
👉PCR - 0.72
👉INDIAVIX - 11.71
Support: 24470,24170
Resistance:-24900,25250
⭐️Verdict: The views remain the same as last time, we need more action and hold our horses, otherwise, we may cripple it.
The Trading Switch is Off - As the MARKET SCORE is Now 3.
RBL BANK CUP AND HANDLEThe Stock Has Formed Cup And Handle. It is near its major resistance, its consolidating below it,so waiting for the breakout. Once the breakout is done, it may see its first target as marked, rest targets will be marked as the charts unfold. so its awaited for the breakout. Hoping the best.
Also Inverse Head & Shoulder forming,which will be completed at the first target.good luck. ty. JMK

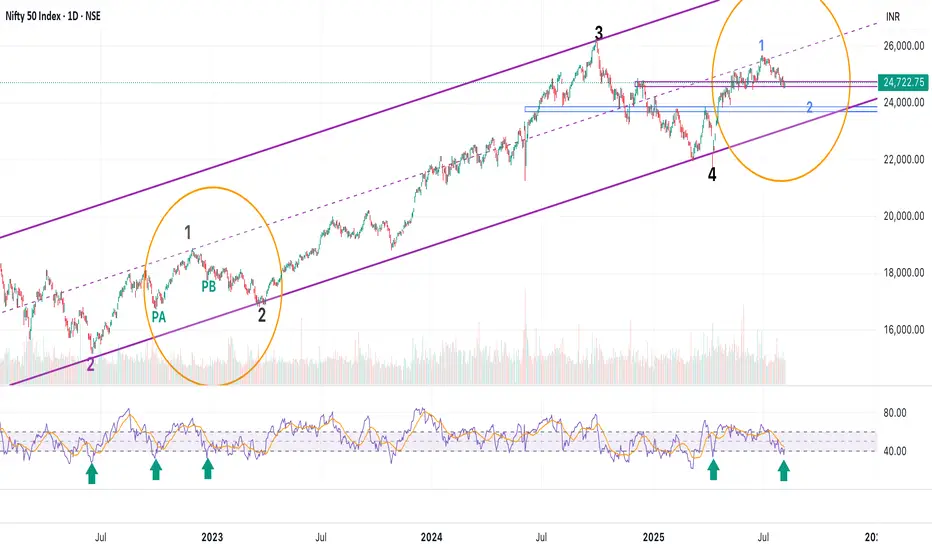
Nifty - Elliot Wave Counts - Update (Neutral)In our last post we discussed that in short term 25700 is the target and if we cross that, then Leading diagonal gets invalidated and hence we look for much higher levels.
Last post:
Thankfully, we didn't get out in shakeouts and rode the entire move till +25600
Now, unfortunately we did not cross 25700 and hence the chance of Wave 1 or something else ending at 25670 became stronger.
As of now, we are at a place where there is a lot of confusion. I see a 5th up pending in wider indices, but Nifty seems done.
So, is there a possibility that other indices go up, while Nifty just does a pullback as part of the correction and not make a new swing high?
A few charts for reference:
Nifty Smallcap:
Nifty 500:
That's about the counts : From other technicals perspective the move looks very similar to Sep 2022 - March 2023 period. But where in that period are we?
PA (point A)Oct 2022 - where one more high till Dec 2022 is left?
or
PB - Feb 2023 - where we just get a pullback and drift lower?
(I have marked green arrows on RSI charts to show the reference)
So, what do we do in such case?
Ditch nifty, play stocks. Lot of stocks looking good - starting 5th up (Just browse through and you'll find many making similar structure as SmallCap index)
(Hint - Defence, Realty, Autos, Metals, Pharma)
All the best!
I will share updates, if I get more clarity on Nifty - till then enjoy the stocks and trade light - remember we are playing seemingly the last leg. :)
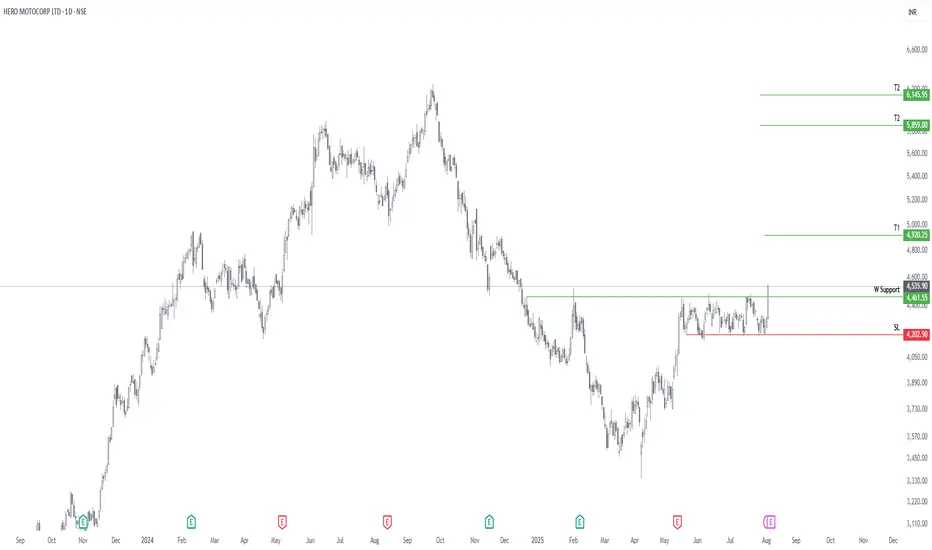
HEROMOTOCO Long IdeaHero Motor Corp formed Inverse Head & Shoulder pattern. It broke out today.
Stoploss and targets are given in chart.
Note: Trade as per Risk Management Rules.
Dow Theory Update and Nifty AnalysisIn this video, we have explained the following points -
* A new Dow Top "A1" has been created by Nifty50.
* The significance of the new Dow Top has been explained.
* The current structure of Nifty has been discussed.
* The importance of waiting for the next candle and the current key support level has been highlighted.

August Iron Condor Setup on Nifty – Premium Eating Strategy!Hello Traders!
Just like we nailed the July Iron Condor, here comes the fresh setup for August expiry.
Nifty is trading around 24680 and we are seeing tight range movement with no clear trend for now. In such times, Iron Condor becomes a powerful income-generating strategy for option sellers, especially if the market stays within a defined range.
So here's the plan:
Strategy Type:
Bullish Iron Condor on Nifty (28th August 2025 expiry)
Position Details:
Sell 2x 24300 PE @ 130.05
Buy 2x 23800 PE @ 53.75
Sell 2x 25000 CE @ 172.50
Buy 2x 25500 CE @ 49.30
Strategy payoff graph:
Strategy Rationale:
We’ve created a wide range between 24101 to 25199 as our breakeven zone. As long as Nifty stays in this range by expiry, we collect full premium and enjoy time decay.
Why We Call It Bullish Iron Condor:
We’ve kept the Put side tighter and Call side slightly wider, meaning we have a bullish bias but still want to benefit from a range-bound expiry.
Rahul Tip:
Don’t go for iron condors blindly, always check for major events, news, or breakout signals. A sudden breakout or breakdown can flip your setup. Adjust or exit if market moves out of your defined zone.
Disclaimer:
This strategy is for educational purposes only. Please do your own risk management and position sizing. Avoid taking full quantity at once — better to scale in once the range confirms.
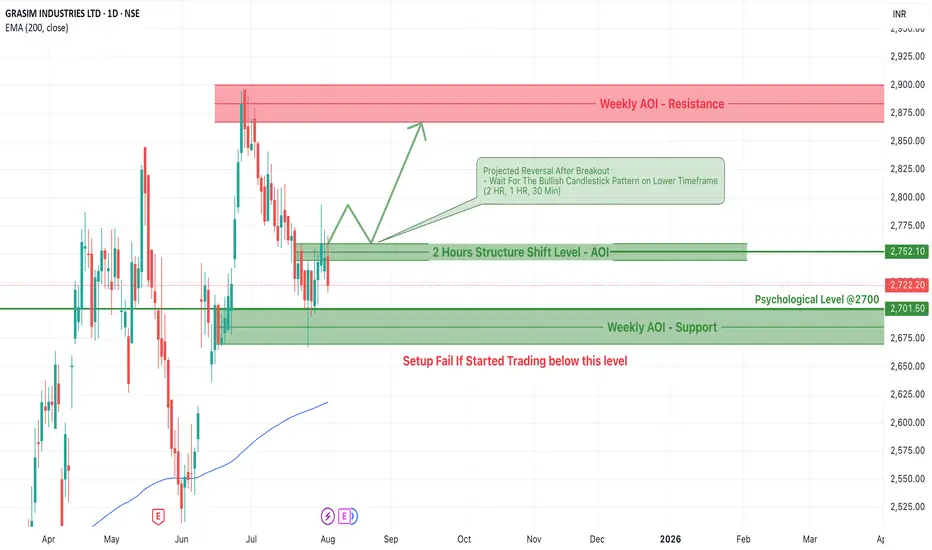
GRASIM Bullish Setup: Key AOI Levels and Reversal Trade PlanGRASIM Industries Ltd is currently forming a potential bullish reversal structure as it approaches a key structural AOI (Area of Interest) zone on the daily chart. This post outlines the complete trade setup, including price action analysis, important zones to monitor, trade plan, and conditions under which the setup could fail.
Key Observations
1. Weekly AOI – Support Zone
Range: Around ₹2,675 to ₹2,701
This green zone represents a strong weekly demand area, acting as a base for potential reversal.
Aligned with the psychological level of ₹2,700, this zone has historically acted as a strong pivot.
2. 2H Structure Shift AOI Zone
Level: ₹2,752.10
This level marks the intraday structure breakout zone on the 2-hour chart.
A successful breakout followed by a retest and bullish candlestick pattern may trigger confirmation for a long position.
Suggested lower timeframes for confirmation: 2HR, 1HR, and 30 Min.
3. Weekly AOI – Resistance Zone
Range: ₹2,875 to ₹2,925
The upside potential is capped at this resistance area, making it an ideal zone for partial or full profit booking.
Trade Plan Breakdown
Projected Move:
Price is currently hovering below the intraday structure shift.
If the price breaks above the ₹2,752 level, traders should wait for a pullback and confirmation in the form of a bullish candle on lower timeframes.
Post-confirmation, an upward move toward the weekly resistance zone is projected.
Entry Strategy
Trigger: Break and retest of the ₹2,752.10 level.
Confirmation: Bullish candlestick pattern (Pin Bar, Engulfing, or Morning Star) on 30 Min – 2HR timeframe.
Stop-Loss: Below the structure AOI or below ₹2,700.
Target 1: ₹2,875 (Near top of Weekly AOI – Resistance)
Target 2: ₹2,900+ (Aggressive target within resistance zone)
Setup Invalidation Level
If the price starts trading below ₹2,700, especially with strong bearish momentum, the setup fails.
In that case, price may revisit lower zones, and traders should refrain from taking long positions.
Technical Confluence
EMA 200 Support: Current price is significantly above the EMA 200 (₹2,618), indicating long-term bullish momentum.
Psychological Level ₹2700: Key psychological round number acting as a magnet and support.
Intraday structure shift: The break of lower timeframe structure adds strength to the setup
Risk Management Guidelines
Position Sizing: Do not risk more than 1-2% of capital per trade.
Wait for Confirmation: Avoid premature entries without bullish candlestick confirmation.
Trail Your Stop-Loss: After price moves into profit zone, trail SL to protect capital.
GRASIM Industries is showing signs of potential reversal and strength near the ₹2,700 zone. The structure shift on the 2-hour chart provides a bullish opportunity, but entry must be cautious and confirmation-based. With a solid risk-to-reward ratio, this could be a textbook breakout-retest trade if conditions align.
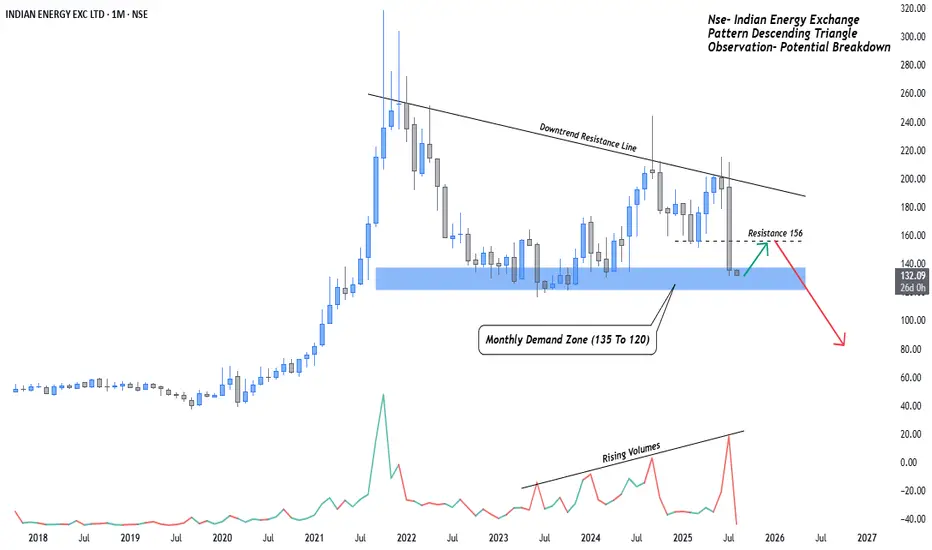
Energy Exhausted: Indian Energy Exchange Nears BreakdownGreetings Fellow Traders, Sharing a critical technical update on Indian Energy Exchange (IEX). The chart is flashing early warning signs of a potential breakdown. Key zones and price action indicate growing bearish momentum stay alert and trade with caution!
Indian Energy Exchange – Bearish Outlook Strengthens.
Indian Energy Exchange is showing clear signs of weakness as it continues to respect a long standing downtrend resistance line. The recent price action saw a sharp rejection near the 156 resistance, reinforcing bearish control.
Currently, the stock is testing a crucial Monthly Demand Zone (135–120) a level that has historically offered strong support. However, the structure now suggests increasing vulnerability.
Bearish Signals-:
Price consistently forming lower highs beneath the descending trendline.
Rising volume on red candles signals strengthening selling pressure.
Price nearing the lower boundary of demand, risking a breakdown.
Key Levels to Watch:
Breakdown below 120-: A close below this level, especially with volume confirmation, could trigger a deeper correction toward 70 or lower.
Rejection from 156 zone-: Any bounce back to this level may offer fresh shorting opportunities, unless a trend reversal is confirmed.
A decisive move below 120 would mark the beginning of a markdown phase, validating the broader bearish reversal pattern in play.
This publication I am sharing for learning purpose like price action, Support and resistance and trends ETC.
Regards- Amit
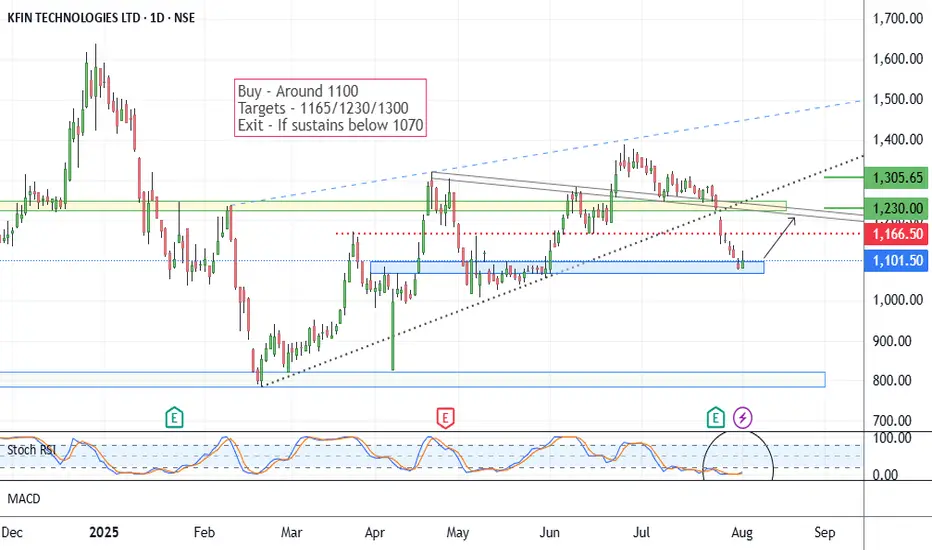
Kfintech - Positional Long SetupIn the last month of July, the stock price fell from 1380 to 1100. Presently seems on a support area. As you may see on the chart. This setup is based on a reversal possibility from the support range around 1080.
Stochastic RSI shows a reversal sign.
Possible targets may be 1165/1230 and 1305.
If it sustains below 1070-1050 levels, the setup will go weak. Below 1070, the exit plan should be considered.
One has to keep the position size according to the risk management.
All these illustrations are my personal view, only for learning and observation purposes; this is not buying or selling advice.
All the best.
WAAREE ENERGIES LTD – Approaching Key Resistance & Supply Zone |WAAREE ENERGIES LTD (NSE: WAAREE) is currently trading at ₹3,136.20, showing strong bullish momentum with a recent gain of over 4%. The stock is approaching a crucial resistance zone between ₹3,435–₹3,500, which lies just below the marked supply zone (T1: ₹3,764.95).
A breakout above this resistance and sustained move could lead to a new upward leg, with T1 as the immediate target. However, failure to break above may trigger a consolidation or pullback toward the green demand zone (around ₹2,800–₹2,950), which has acted as strong support.
Key levels to watch:
• Resistance/Supply Zone: ₹3,435 – ₹3,764
• Immediate Support: ₹2,800 – ₹2,950
• Trend: Stock showing higher lows and holding within an ascending channel
Monitor price action closely near the resistance for a breakout or potential reversal signal. Volume and RSI indicators will be key in confirming the next big move.
Disclaimer: This chart is for educational purposes only. Please do your own research or consult a financial advisor before making any trading decisions.

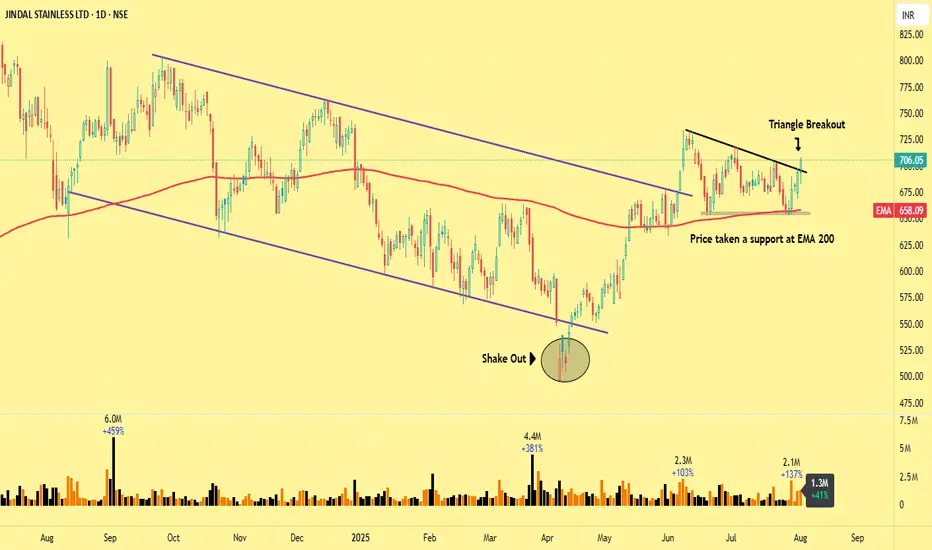
Confluence of a channel breakout, volume point and 200-day EMAFor a year, price trended lower within a well-defined descending parallel channel. In mid-April 2025, the stock shook out below the channel support but quickly recovered, signalling a false breakdown and accumulation. By late May, price decisively broke above the upper boundary of the channel and compressed into an ascending triangle. The 200-day EMA provided dynamic support and multiple pullbacks at or slightly above this EMA, confirming it as a reliable demand zone. The breakout leg coincided with above-average volume validating the move and suggesting follow up buying.
The long positions with proper risk controls, keeping a stop loss just below 200 EMA.
Disclaimer: The information and publications are not meant to be, and do not constitute, financial, investment, trading or any other types of advice or recommendations.
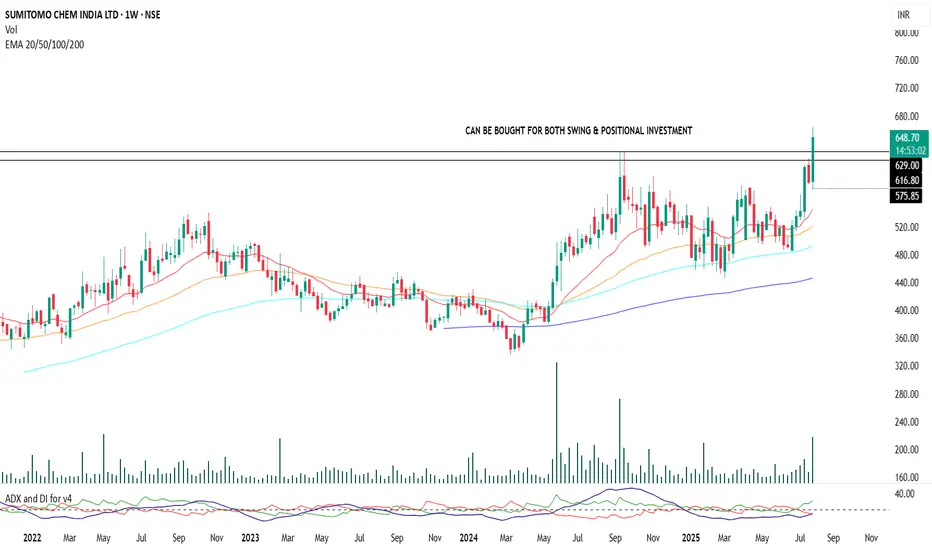
Sumitomo Chemical | Positional Swing Setup with Dynamic SLA strong setup is forming in Sumitomo Chemical with bullish c price action and trend indicators. Entry can be been initiated at current levels with small quantity with a stop-loss placed at ₹570 on a weekly closing basis.
No fixed targets. This is a trailing stop-loss-based position aimed at capturing a sustained trend move.
Add-on Zone: If the price retests the support near the ₹630 level (previous structure/support), more quantity will be added as part of a pyramiding strategy, provided broader market structure remains bullish.
Indicators Used for Trailing SL & Confirmation:
ADX & DI , RSI Levels
Exit Criteria:
Weekly close below ₹570 (hard stop)
Note: This is a disciplined, structure-based swing trade with optional pyramiding. Avoid impulsive exits; trail stop-losses logically based on trend indicators.
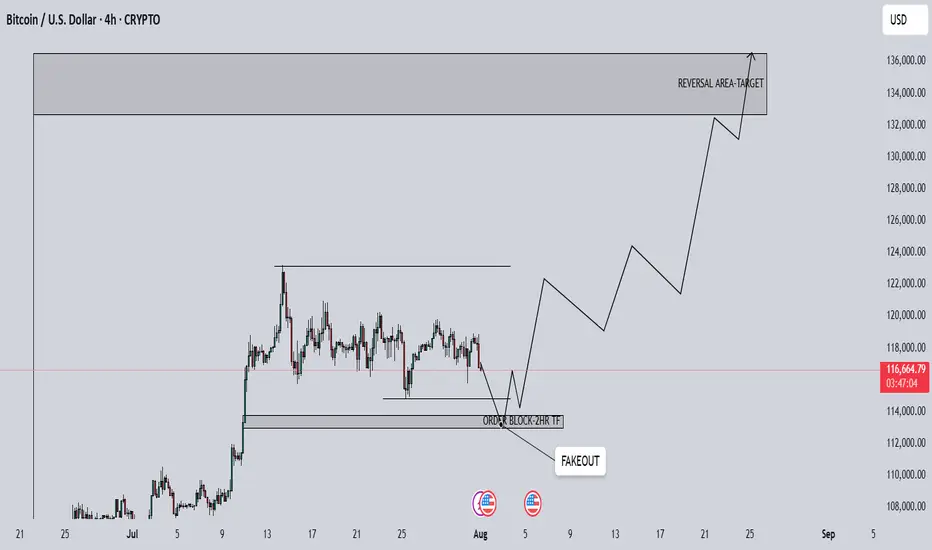
BTCUSD 4H Analysis1. Overall BTC is bullish but currently its at central area of
demand. so we can see a consolidation here.
2. There is a inducement/wicks at downside, so we can expect
a fake out at downside to fill the inducement and then market
can go to target area.
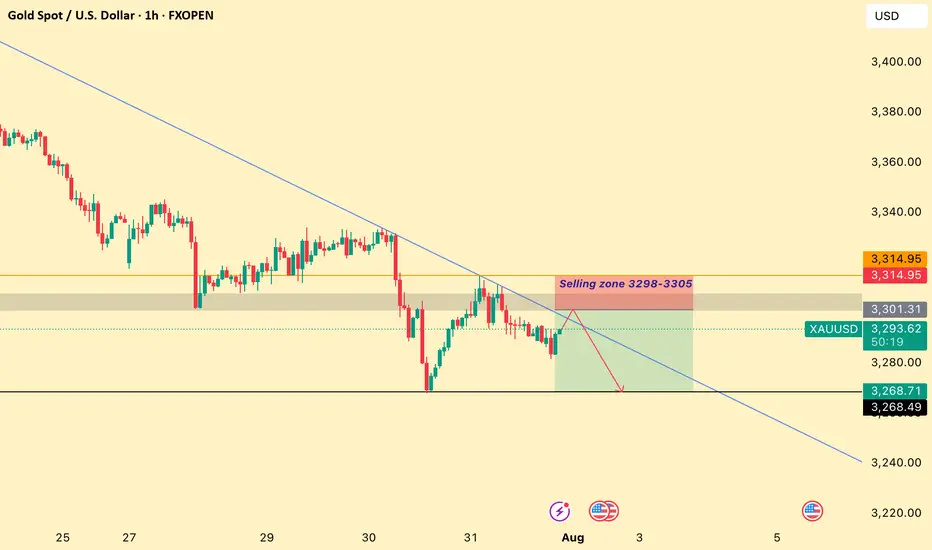
XAUUSD GOLD Analysis on (01/08/2025)#XAUUSD UPDATEDE
Sell Limited - (3298-3305)
If price stay below 3315, then next target 3282,3268 and above that 3335
Plan;If price break 3298-3305 area,and stay below 3295,we will place sell order in gold with target of 3282,3268 and 3250 & stop loss should be placed at 3315
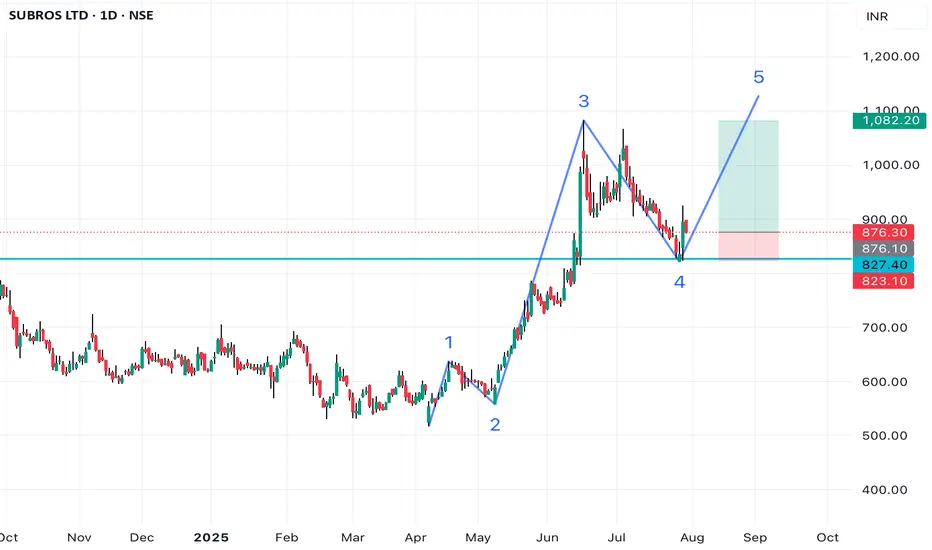
SUBROS may have started 5th waveThe stock is in clear uptrend on higher time frames (Weekly & Monthly).
It has given a break out on weekly time frame and now has come to retest the same level.
In daily TF we can see the bullish candle on support and a corrective wave (A-B-C).
It has also taken support on 50 EMA.
So the confluence of the 2 context gives some conviction on this chart. If NIFTY goes up then the chances of this stock going up increase dramatically.
NOTE: Pls do not take this as an advice, Just sharing my study.
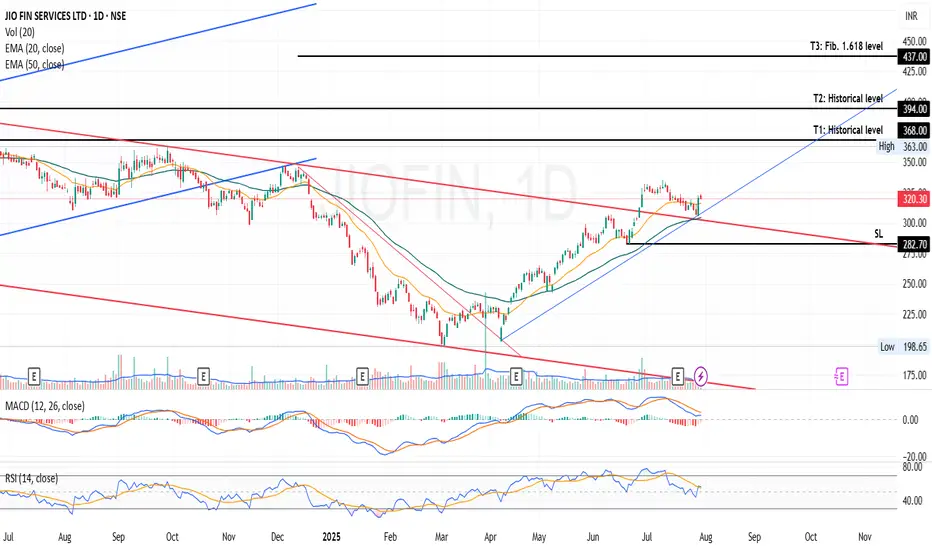
Jio Financial Services Ltd - Breakout OpportunityDate : 30-Jul-2025
LTP : Rs. 320.30
Targets: (T1) Rs. 368 --> (T2) Rs. 394 --> (T3) Rs. 437
SL : Rs. 282
Technical View:
• NSE:JIOFIN was going through primary downtrend since Apr 2024. From it's lifetime high of 394.70 in Apr 2024, it has retraced 50% to 198.65 in Mar 2025.
• From Apr 2025, NSE:JIOFIN has started moving in secondary uptrend within its primary downtrend and had given a breakout from its primary downtrend on 26-Jun-2025 with higher than average volume.
• on 28-Jul-2025, NSE:JIOFIN has re-tested the downtrend line and bounced back closing above 20 DEMA.
• NSE:JIOFIN is currently trading above 20 DEMA and 50 DEMA.
• MACD is trading at 2.38 and RSI is trading at 56.18.
• Looking good to continue the current momentum.
If you have liked this analysis, please Boost/Like this idea and follow my ID for more ideas.
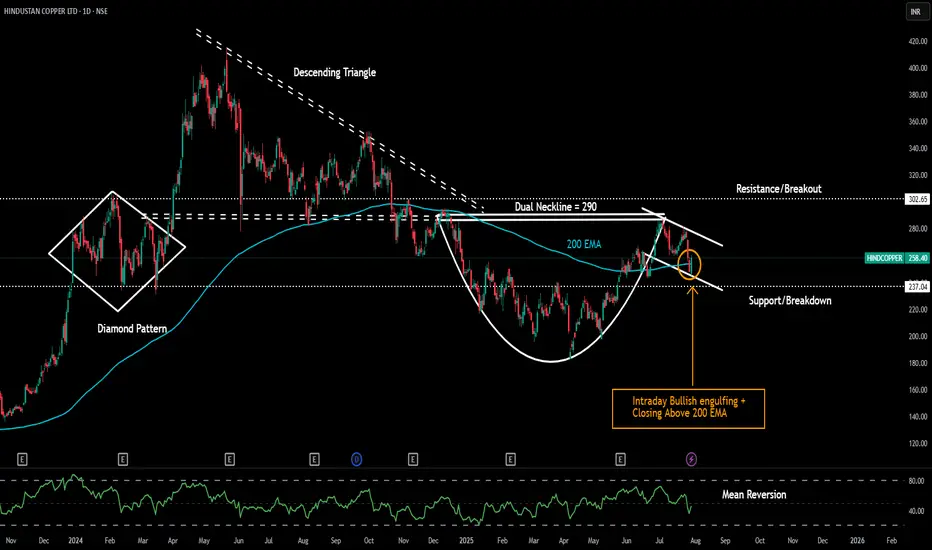
Hindustan Copper LtdDate 29.07.2025
Hindustan Copper Ltd
Timeframe : Day Chart
Technical Remarks :
1 Formed bullish engulfing on intraday closing basis
2 Closed above 200 exponential moving average
3 Took support from handle's bottom base
4 Dual neckline at 290 of descending triangle + cup & handle pattern
5 302 is another resistance after that high momentum journey
6 Keep todays low at 245 or 200 ema as strict stoploss on trailing basis
About The Company :
Main Products
1) Continous Cast Copper rod
2) Copper Cathode
3) Copper Concentrate
By-products
1)Copper Sulphate
2)Sulphuric acid
3) Anode Slime
4) Nickel hydroxide
5) Reverts
Plant Location
Taloja in Maharashtra
Jhagadia in Gujarat
Ghatsila in Jharkhand
Malankjand in Madhya Pradesh
Khetrinagar in Rajasthan
Revenue break up
Domestic sales - 43%
Export sales -57%
Exports sales - Product wise
Copper concentrates- 94%
Copper reverts- 2%
Anode slime - 4%
Valuations
Roce = 24%
Roe = 19%
Pe Ratio = 53
Book Value = 9X
Operating Profit Margins = 36%
Holding Pattern :
Promoter = 66.14%
DII = 3.71%
FII = 8.24%
Public = 21.90%
Regards,
Ankur
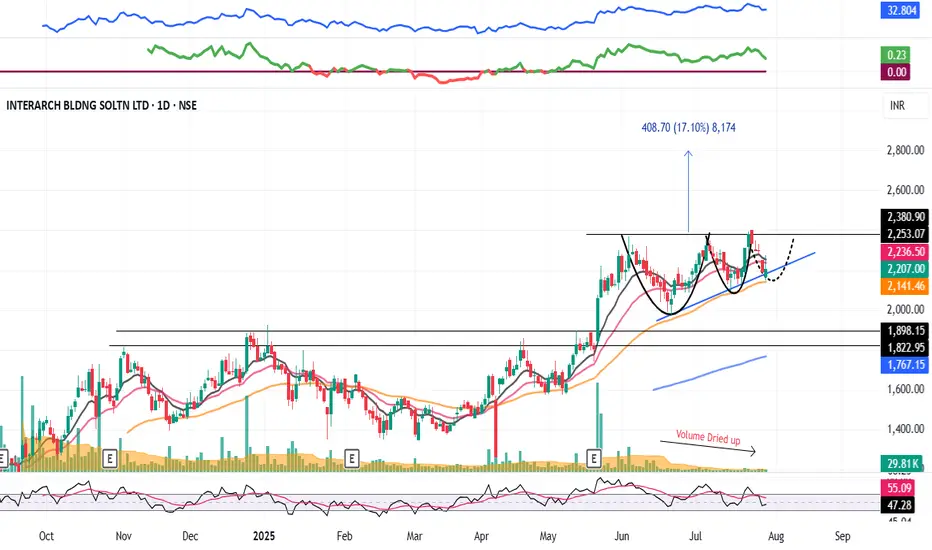
INTERARCH : Swing Pick (1-3 Months)#INTERARCH #vcppattern #chartpattern #ascendingtrianglepattern #breakoutstock #patterntrading #Swingtrading
INTERARCH : This will test Patience
>> VCP formation in process
>> Ascending Triangle forming
>> Breakout candidate
>> Good Strength & Volumes Dried up
>> Trending Stock in consolidation
Swing Traders can lock profits at 10% & Keep Trailing
Pls Comment , Boost and Follow for more such Analysis
Disc : Charts shared are for Learning Purpose and not a Trade recommendation, Consult your Financial advisor or a SEBI Registered Advisor before taking position in it.