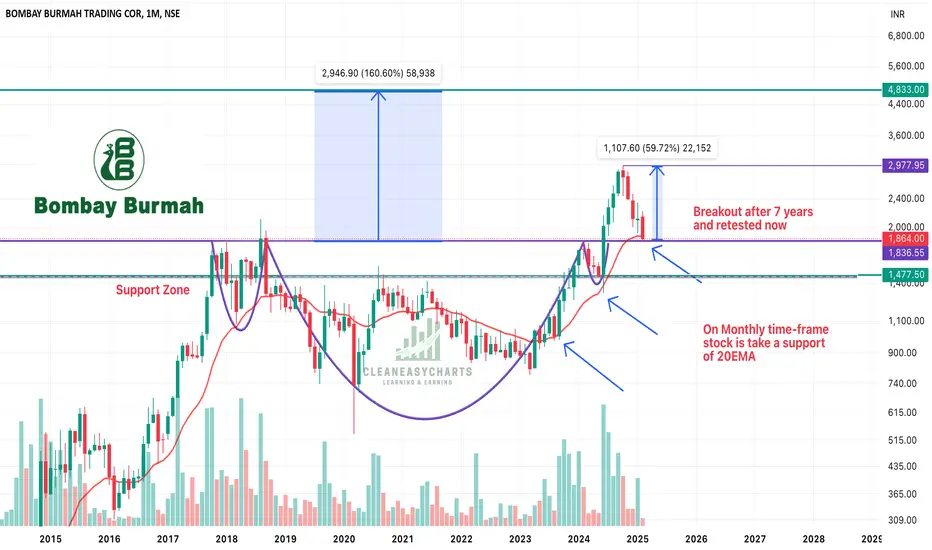
Bombay Burmah Trading Corp - Head & Shoulder Pattern & Retest!!Bombay Burmah had given breakout of Head & Shoulder pattern and now has entered retest zone on a monthly time frame. It is looking good and can move towards our targets as mentioned in the chart. Other factors:
1. Monthly Time frame set-up : Head & Shoulder Patter breakout and retest on a larger time frame is much stronger set-up. On a smaller time frame it can come down till support level given market conditions.
2. Stock price is taking EMA 20 as a support on MTF
3. Holds 50% in one of the largest FMCG Co. Britannia - FMCG sector should revive and should give tailwinds to this stock.
4. Hold many dimensional business and EPS is increasing on a YoY basis
Keep this stock in your radar!! Keep following @Cleaneasycharts as we provide Right Stock at Right Time at Right Price !!
Cheers!!!
Community ideas
NIFTY analysis based on Elliott Wave theoryNIFTY is looking like in wave (Z).
Now, wave (Z) is always in 3 moves (ABC).
If we take a look in 75 min chart of NIFTY, we may see wave (a) of wave (Z) finished on 12 Feb. The price is in wave B of wave (b) now.
It looks like Zig-zag pattern is forming and it is observed most of the times that, Wave B of Zig-zag takes at least equal time of wave A.
So we may assume that, wave (b) of Zig-zag will finish at least by 19 Feb near 50% to 61.8% And then we may expect a fall to form wave (c) of Zig-zag.
This analysis is based on Elliott Wave theory and Fibonacci.
This analysis is for educational purpose only.

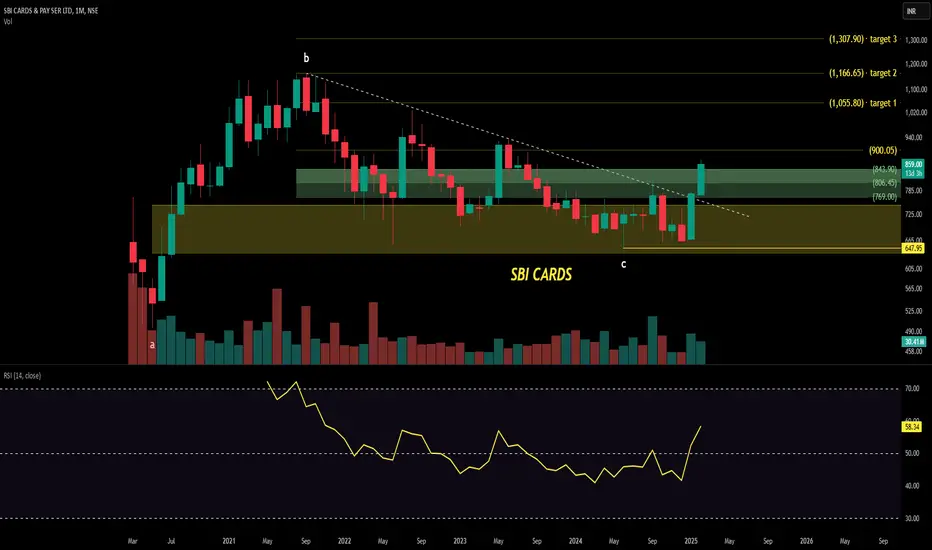
ready to blast SBI CARDSRelative Strength Index (RSI)
RSI Value: 58.34
Interpretation: The RSI indicates that the stock is in a neutral to slightly bullish territory. RSI values above 70 indicate an overbought condition, while values below 30 indicate an oversold condition. With a current RSI of 58.34, the stock is neither overbought nor oversold.
Volume
Recent Volume: 30.41 million
Interpretation: The recent increase in volume suggests strong buying interest and higher trading activity. A significant increase in volume often indicates strong investor interest and can signal the strength of price movements.
Key Support and Resistance Levels
Support Levels:
647.95 INR (Highlighted support zone)
Resistance Levels:
769.00 INR
806.45 INR
843.90 INR
900.05 INR
Target 1: 1,055.80 INR
Target 2: 1,166.65 INR
Target 3: 1,307.90 INR
Trend Analysis
Trendline: The chart shows a descending trendline from point 'b' to point 'c', which has been recently broken with the latest candlestick moving above the trendline. This breakout indicates a potential reversal of the previous downtrend.
Candlestick Patterns: The recent candlestick shows a significant upward movement with a closing price of 859.00 INR, up by 80.80 INR (+10.38%).
Summary
The stock has recently broken above several resistance levels (769.00 INR, 806.45 INR, and 843.90 INR) and is approaching the next resistance at 900.05 INR. The RSI value suggests a neutral to slightly bullish stance, and the increase in volume indicates strong investor interest. The breakout above the descending trendline indicates a potential reversal of the previous downtrend.
Disclaimer: This analysis is for informational purposes only and should not be considered as financial advice. I am not a SEBI registered analyst. Please consult with a certified financial advisor before making any investment decisions.
ONGC : Is oil Going to burn?
Technical View
Box trading strategy in which you identify a stock consolidating for couple of days and trade in the direction of the breakout. In case of ONGC the stock was consolidating for about three days before breaking out earlier today.
PRO TIP
Use the High of the candle as your stop loss and trail it to either protect profits or hold your trade for longer duration.
Target 227 Intra-day Target
Fundamentals
Weak Q3FY25 Results:
ONGC's consolidated net profit attributable to owners declined by 19.4% to ₹8,621.69 crore in Q3 FY25, compared to ₹10,703.13 crore in the same period last year. This drop was attributed to lower global crude prices.
The company reported a 6.9% decrease in net profit for the quarter, standing at ₹9,784 crore, down from ₹10,511 crore in the same period last year.
ONGC's gross revenue also showed a slight decline of 0.7%, falling to ₹1.66 trillion in Q3 FY25, compared to ₹1.67 trillion in Q3 FY241. The company's revenue from operations also saw a decline, reaching ₹166,096.68 crore.
Bearish Trend: The stock is trading below its 5-day, 20-day, 50-day, 100-day, and 200-day moving averages, which indicates a bearish trend in its short to long-term performance.
Brokerage Views:
CLSA has cut its FY25 EPS estimate by 5% due to cautious outlooks on the company's production and profitability
Not an investment advice

AI16Z bullish path started.1. Price came out of the accumulation channel and formed the cup and handle.
2. volume was increasing we can observe at the bottom.
3. break out of the 0.56 and consolidate the above leads to AI16Z at nearly 1 dollar.
4. I think we still entered my entry around 0.3181. (swing trade).
5. above the 0.46 chart was bullish below this level price go consolidation.
DYOR (not financial advice)

Nifty about to TRAP longs... Bullish? Think AGAIN!Hello traders!
I'm looking at equal lows/sellside as the draw. My narrative is that we would take out any longs remaining with BUYSIDE at 23144.70 .
If we gap up above buyside, which is what I expect, it would be an easy day for shorts.
If we gap down, we may see a rush up to buyside and then take the move forward to SELLSIDE at 22786.90 .
But whatever the gap scenario is, my draw remains towards 22786.90...
GLGT!
Not financial advice.

ABFRL - Expecting more fall from this point nowAs expected & explained in my Jan 22nd analysis that stock would not go upside beyond 288
It tried twice but finally resisted and fell
And while falling it now broke important support area near 260-62
So now when its pulling back, it is expected to repeat previous pattern and resist the area of 260 - 62
As it is now the new resistance as well as the flip zone, so the changes are very high
Downside 1st stop can be expected at 250 at the least, further will update, when time arrives

Nifty Intraday Analysis for 12th February 2025NSE:NIFTY
Index closed near 23070 level and Maximum Call and Put Writing near CMP as below in current weekly contract:
Call Writing
23500 Strike – 99.23 Lakh 23400 Strike – 79.45 Lakh
23300 Strike – 71.23 Lakh
Put Writing
22500 Strike – 91.19 Lakh
22700 Strike – 84.36 Lakh
22800 Strike – 61.43 Lakh
Index has resistance near 23250 - 23300 range and if index crosses and sustains above this level then may reach near 23450 - 23500 range.
Index has immediate support near 22850 – 22800 range and if this support is broken then index may tank near 22650 – 22600 range.

EURJPY - TRADING AT DEMAND ZONESymbol - EURJPY
EURJPY is currently trading within a important support zone. This level has acted as a solid base for price action, offering stability to the currency pair and providing key support for the ongoing trend.
At current market price (CMP 156.50), EURJPY presents a promising opportunity to initiate long positions. The current price level aligns well for potential upward movement, making it a favorable entry point for traders looking to take advantage of the prevailing trend.
However, it is crucial to monitor certain levels for any signs of trend reversal. A breakdown below the 155.25 area could trigger additional selling pressure, and a sustained move below 155.00 would confirm a shift from a bullish to a bearish market structure. In such a case, a retest of the breakdown zone could offer a good opportunity for short positions.
Conversely, if EURJPY continues to recover, we could see a push toward the 158.67 and 160.85 levels, which represent key resistance areas. A successful breakout above these levels would likely signal the continuation of the bullish trend, suggesting further upward momentum.
Key Resistance Levels: 158.70, 159.90, 160.85
Key Support Levels: 156.00, 155.25

Is Tata Motors Ready for a Bullish Reversal?Timeframe: Daily
Tata Motors (NSE) has been in an expanded flat correction pattern for the past 11 months. In this pattern, the highest high (HH) was 1179, and the lowest low (LL) was 683.2. Currently, the price is trading below the 200, 100, and 50 EMA levels, indicating a bearish trend.
In this expanded flat correction:
Wave (A) completed at 855.4,
Wave (B) peaked at 1179,
Sub-wave 4 of Wave (C) touched 786.65,
Sub-wave 5 is now unfolding.
Once Wave 5 is completed, traders can look for buying opportunities with target levels at 799 – 951 – 1050+. First, it’s crucial to identify the end of Wave (C) to confirm the correction’s completion and a bullish reversal.
Projecting ending point of wave (C):
Wave (C) may end at 2.618% of Wave (A) around 628.7.
Wave 5 has multiple potential targets/support levels:
0.618 extension of Wave 1 at 526,
0.382 extension of Wave 1 at 628,
1.618 reverse Fibonacci of Wave 4 at 657,
2.618 reverse Fibonacci of Wave 4 at 562.
We will update further information soon.

Kfin Technologies cmp 1224.25 by weekly Chart view since listedKfin Technologies cmp 1224.25 by weekly Chart view since listed
- Support Zone at 980 to 1060 Price Band
- Stock traversing within Rising Price Channel
- Technical Indicators EMA, MACD, RSI in positive momentum
- Volumes are spiking close to and above average traded quantity
- Support Zone seems to have been tested and retested successfully
- Weekly Support 980 > 775 > 590 with Resistance 1380 > ATH 1641.35

#SAIL#SAIL has corrected about 40% from recent swing high and currently trading near 61.8% retracement zone + weekly 200 ema and parallel channel support confluence zone. On weekly tf, it is probably trying to make a double bottom.
Historidally, when it gave a breakdown below weekly 200 ema and unable to sustain above it, it continued to underperform for almost 8-10 years but now it is probably trying to take support around it.
Also, RSI is making HLs off late, which is probably a good sign.
In terms of R:R, this is currently a good bet on long side.
As usual, DYOR and this isn't a Buy or Sell reco - but just an educational purpose post

Jubilant Food Breakout📈 Jubilant Foods: On the Verge of a Major Breakout!
After nearly 4 years of consolidation (from November 2021 to January 2025), Jubilant Foods is showing strong signs of a potential breakout. The formation of a classic Reverse Head and Shoulders pattern on the charts strengthens this bullish outlook.
Additionally, there's been a noticeable decline in public shareholding, indicating potential accumulation by strategic investors or institutions — a factor that often precedes strong market movements.
If this breakout materializes, it could unlock significant upside potential. Based on my analysis, I foresee promising returns ahead.
What are your thoughts? Have you spotted similar patterns or trends in other stocks recently? Let's discuss!

EUR/USD Daily Chart Analysis – Smart Money Perspective
Current Market Bias: Bearish
The price action indicates that the overall structure remains bearish, with lower highs and lower lows being formed. Despite recent bullish retracements, the price has failed to break key resistance levels, signaling that sellers remain in control.
Key Areas on the Chart:
1. Order Block (OB) & Fair Value Gap (FVG) Zone:
• The highlighted gray zone represents an order block (OB), which is a supply area where institutions likely placed large sell orders.
• The presence of a fair value gap (FVG) within this zone indicates an inefficiency in price, making it a strong area for potential reversals.
• Price recently tapped into this area and reacted downward, confirming bearish momentum.
2. Liquidity Grab Possibility:
• The lower dashed line represents a previous swing low, where liquidity (stop-loss orders) is likely resting.
• Smart Money often seeks liquidity before reversing or continuing trends.
• There is a high probability that price will sweep this low before any potential bullish move occurs.
3. Market Structure Shift for a Bullish Setup:
• Although the bias remains bearish, a market structure shift (MSS) is required before considering any long (buy) setups.
• A key level to watch is 1.05351, where a break above could signal a reversal.
• Until then, selling pressure is likely to dominate.
Conclusion & Trade Plan:
• Bearish bias remains active.
• Price might sweep the previous low to grab liquidity before a potential reversal.
• A confirmed market structure shift above 1.05351 is required for bullish confirmation.
• Until that happens, traders should focus on shorting opportunities near supply zones or order blocks.
Final Thought:
By following Smart Money Concepts (SMC), traders can align their trades with institutional movements. Patience is key—wait for confirmations before entering positions. Keep an eye on liquidity sweeps and market structure shifts for the best trade setups.

SBI Stock Analysis: Support Levels and Potential ReboundSBI's stock has returned to a support level of ₹732, with a potential entry point at the long-term 3-year trendline around ₹670, following a recent 15% drop. State Bank of India's Q3FY25 net profit grew 84.32% YoY to ₹16,891 crore7. The bank's loan book also experienced substantial growth, with a YoY increase of 15.8%

Investing in ETFs made simple 101Hello,
Investing in Exchange-Traded Funds (ETFs) can be challenging, especially for beginners who may struggle with selecting the right funds, understanding market trends, and managing risks. With thousands of ETFs available, covering various asset classes, sectors, and investment strategies, it can be overwhelming to determine which ones align with your financial goals. Factors such as expense ratios, liquidity, underlying assets, and market conditions all play a crucial role in making an informed decision.
To simplify this process, we have carefully analyzed and selected a number of ETFs that we believe offer strong potential for growth, diversification, and long-term value. Below, we highlight these ETFs and explain why they could be good investment choices.
ISHARES CORE S&P 500 UCITS ETF U.S. DOLLAR - ISHARES VII PLC
FUND OVERVIEW
The Fund seeks to track the performance of an index composed of 500 large cap U.S. companies.
• Asset Class: Equity (Focused on large caps)
• Accumulation ETF
• Unit price: $643.82
• Benchmark: S&P 500
• Expense ratio: 0.07
Top 10 holdings
• Apple: 7.59%
• Nvidia Corp: 6.61%
• Microsoft Corp: 6.29%
• Amazon Inc.: 4.12%
• Meta platforms: 2.56%
• Tesla: 2.26%
• Alphabet: 2.22%
• Broadcom Inc.: 2.17%
• Alphabet Inc: 1.82%
• Berkshire Hathaway Inc.: 1.67%
Why we think this is a good ETF to have
The iShares Core S&P 500 UCITS ETF (Acc) offers investors a cost-effective way to gain exposure to the 500 largest U.S. companies across various sectors. As a passively managed fund, it seeks to replicate the performance of the S&P 500 Index, making it an excellent choice for those looking for broad market diversification. Having an accumulating structure, dividends are reinvested, maximizing long-term returns through compounding. The fund is managed by Blackrock and is domiciled in Ireland.
SPDR MSCI WORLD COMMUNICATION SERVICES UCITS UCITS ETF USD Acc
Fund Objective
The investment objective of the Fund is to track the performance of companies in the Communication Services sector, across developed markets globally. The MSCI World Communication Services 35/20 Capped Index measures the performance of global equities that are classified as falling within the Communication Services sector, as per the Global Industry Classification Standard (GICS).
• Investment Manager: State Street Global Advisors Europe Limited
• Asset Class: Equity (Focused on companies in the Communication Services sector)
• Accumulation ETF
• Unit price: $67.15
• Benchmark: MSCI World Communication Services 35/20 Capped Index
• Expense ratio:
Top 10 holdings
• Meta Platforms Inc-Class A 18.58
• Alphabet Inc-Cl A 18.30
• Alphabet Inc-Cl C 15.80
• Netflix Inc 7.81
• Walt Disney Co/The 4.11
• Verizon Communications Inc 3.43
• At&T Inc 3.33
• Comcast Corp-Class A 2.96
• T-Mobile Us Inc 2.36
• Deutsche Telekom Ag-Reg 2.13
Fund performance
Why we think this is a good ETF to have
The technology, media, and communications sector is likely to benefit significantly under a Trump presidency. While the tech industry has faced antitrust scrutiny in recent years, Trump has largely ignored or downplayed these cases. His reluctance to support antitrust actions against media giants has indirectly favored them and is expected to continue doing so. During Trump’s inauguration, top tech CEOs were given VIP seats ahead of even some cabinet members, signaling his close ties to the industry. Additionally, Trump owns his own social media platform, "Truth Social," while his close ally, Elon Musk, owns "X." Any restrictive regulations imposed on the sector would directly impact these platforms, making it less likely that heavy-handed policies will be introduced.
A day after his inauguration, Trump announced a major initiative to expand artificial intelligence infrastructure in the U.S., calling it the largest buildout of its kind in history. These factors collectively suggest strong growth prospects for the tech sector under his leadership. Given this favorable outlook, we see an opportunity to invest in an ETF with significant exposure to this sector.
ISHARES GLOBAL HEALTHCARE ETF
Investment objective
The iShares Global Healthcare ETF seeks to track the investment results of an index composed of global equities in the healthcare sector.
• Asset Class: Equity (Focused on the healthcare sector)
• Unit price: $92.57
• Benchmark: S&P Global 1200 Healthcare Sector Index
• Expense ratio: 0.41%
Top holdings
• Eli Lilly- 8.72%
• United Health group Inc- 6.68%
• Johnson & Johnson- 4.74%
• AbbVie Inc- 4.51%
• Novo Nordisk- 3.88%
• Merck & co Inc- 3.61%
• AstraZeneca PLC- 2.92%
• Thermo Fisher scientific Inc- 2.86%
• Roche holding par AG- 2.84%
• Abbott laboratories- 2.82%
Why we think this is a good ETF to have
Investing in a healthcare ETF right now could be especially promising given the anticipated direction of U.S. healthcare policy under President Donald Trump. The administration is expected to stick to its strong deregulation agenda while keeping healthcare access and cost management at the forefront. Looking ahead, the Trump administration intends to uphold campaign promises for the health sector with four key themes: Promote access to healthcare via market competition and transparency, enhance flexibility and choice in healthcare to states and individuals, focus on deregulation by reversing or modifying Biden-era policies and Enhance national security with “America first” principles.
While there is a possibility that efforts to lower drug prices and boost competition might counterbalance some deregulation benefits, the overall push for a more dynamic, less regulated market suggests significant upside potential. For investors, this means your healthcare ETF could stand to gain from a regulatory environment that encourages innovation, speeds up market entry for new products, and drives overall industry growth. We see an opportunity to tap into a changing regulatory landscape with high potential for growth and innovation through investing in the Ishares Global Healthcare ETF.
VANGUARD FINANCIALS ETF
Investment Objective
The fund seeks to track the performance of the MSCI US Investable Market Index (IMI)/Financials 25/50, investing in multi-cap equity within the financials sector. It is passively managed, employing a full-replication strategy when possible, but resorts to a sampling approach if regulatory constraints arise to maintain the index’s key characteristics. The fund remains fully invested, with low expenses helping to minimize net tracking error.
Asset Class: Equity (Focused on the US financial sector)
Unit price: $126.28
Benchmark: MSCI US Investable Market Index (IMI)/Financials 25/50
Expense ratio: 0.10%
Dividend schedule: Quarterly
Ten largest holdings
JPMorgan Chase & Co. 8.7 %
Berkshire Hathaway Inc. 7.7 %
Mastercard Inc. 5.5 %
Visa Inc. 4.8 %
Bank of America Corp. 3.9 %
Wells Fargo & Co. 3.1 %
Goldman Sachs Group Inc. 2.3 %
American Express Co. 2.2 %
S&P Global Inc. 2.0 %
Morgan Stanley 1.9 %
PERFORMANCE
Why we think this is a good ETF to have
Optimism is building for more deal making in a Trump presidency, with activity showing signs of life. After a relatively low year in global mergers & acquisitions in 2023, 2024 witnessed a moderate uptick as the pandemic receded further into the rear-view mirror, the U.S. economy stabilized, inflation declined, financing markets brightened, albeit modestly, and equity markets climbed ever higher. While the business grew in 2024, heightened regulatory enforcement, among other factors, led to fewer very large transactions. The return of President-elect Donald Trump to the White House, with the Republican party having majorities in both houses of the U.S. Congress, is expected to bring a more business-friendly, deregulatory approach to policymaking, and further solidifies widespread expectations among market participants that M&A activity will increase in 2025. The Vanguard Financials ETF gives you exposure to the financial sector at a low cost. Given the above, we see opportunity in owning the ETF.
All the above information has been compiled from
ETF screener: in.tradingview.com
ETF news: in.tradingview.com & in.tradingview.com
ETF ideas: in.tradingview.com
Good luck

Oil India Double bottom Bullish TradeBuy oil india
Entry- 430
Support- 410
Target- 460 470
Pattern- Double bottom at support and a bullish engulfing candlestick pattern.
Note- It has result tomorrow so Keep this in Mind.
Disclaimer- This is just for educational purpose please take advice from your financial advisor before making any decision.
Jai Shree Ram.

VadilalVadilal Industries looks good on the bullish flag.
Short term breakout inside the channel.
Target will be 5000 in next 3 months.
Good to accumulate for the next 3-6 months.

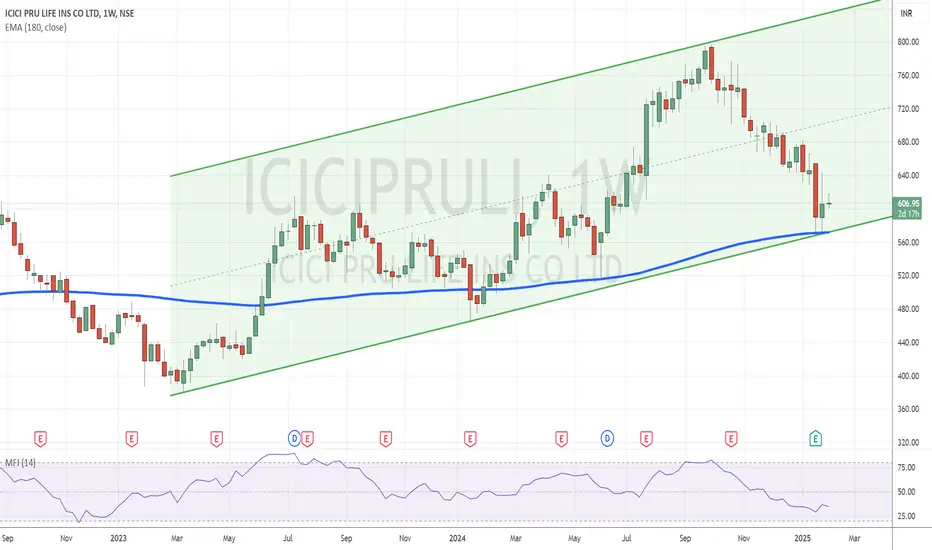
ICICI Prudential: Oversold and Poised for Recovery Topic Statement: ICICI Prudential Life Insurance has made a healthy correction, positioning itself near strong support levels within an up-trending channel.
Key Points:
1. The company reported a robust 43% profit growth QoQ.
2. The price is moving in an up-trending channel, providing clear trading opportunities.
3. The stock is taking support at the lower end of the channel, indicating oversold conditions.
4. The price is near the 180-day moving average, reinforcing the oversold status.
5. Weekly MFI is at 34 which also indicates the price being oversold.
Titan - Keep On WatchCMP 3580 on 03.02.25
The above chart shows that the price has been traveling in a rising parallel channel in recent sessions. At this moment, the price has touched the upper edge of the channel. If rejected from these levels, a bearish move may be seen further.
Targets may be 3510/3330 and 3190.
Please keep in mind the earnings day around 4th February.
This setup fails if the price sustains above 3710.
Plan your trade as per your risk management. ( entry and exit)
The above illustration is my view. It is only for learning and sharing purposes, not a trading recommendation.
All the best.

#Zomato cash : Looks good above 242.10#Zomato cash -Positional call
03. Feb 2025
Looks good above 242.10
Stoploss 220
Tgt 264-265/297-300
Cmp 238

Nifty 50 | Falling Wedge Pattern – A Bullish Breakout Ahead?Hello everyone! I hope you all are doing great in life and in your trading journey. Today, I have brought an in-depth analysis of Nifty 50 , focusing on a powerful Falling Wedge Pattern that is currently forming on the charts. This pattern is known for signaling a bullish reversal , provided we get a confirmed breakout . If this pattern plays out as expected, we could witness a strong upward move in the coming sessions.
Currently, Nifty is trading near a strong support zone around 22,777 – 22,900 , where buyers have previously shown interest. The price is moving within a converging downward-sloping range , indicating that selling pressure is weakening . Key resistance levels to watch post-breakout include 23,700, 24,207, 24,781, 25,191, and 26,277 , with a stop-loss placed below 22,777 to manage risk effectively . However, this analysis holds true only if Nifty breaks out of the Falling Wedge Pattern; until then, caution is advised.
If the breakout is confirmed with good volume, we might see a strong rally ahead, potentially targeting the marked resistance levels. As always, patience and discipline are key—wait for confirmation before making any trading decisions.
Disclaimer:- This analysis is for educational purposes only. Please trade responsibly and consult a financial advisor before making any decisions.
If you found this analysis helpful, don’t forget to like, follow, and share your thoughts in the comments below! Your support keeps me motivated to share more insights. Let’s grow and learn together—happy trading!

JK LAKSHMI CEMENT LTD.Presenting One More Chart Analysis after a Long time...
JK LAKSHMI CEMENT LTD Chart is quite strong with Bullish View and looks promising at CMP 813.00.
Patterns are drawn on Daily Chart and as usual complex & detailed drawing with Price Analysis is presented considering all the aspects of the chart.
Target & SL is as follows:
Tgt: 950.00 and above
SL: 750 (Closing Basis)
Market is all about OPPORTUNITY / ENTRY / TIMING !!!!!
Basis some minute observations, chart analysis is made, target and SL is given to understand the core of the subject and for learning purpose only.
