ETHUSD: Where Price Could Go?4h tf
ETHUSD has bounced back strongly from around $3,826 after completing an A-B-C wave pattern. Right now, the price is testing resistance near $4,756. It could drop a little to around $4,440 before moving higher again. If the uptrend continues, the next target levels are $4,955, $5,300, and $5,500.
Stay tuned!
Thank you,
@Money_Dictators
Community ideas

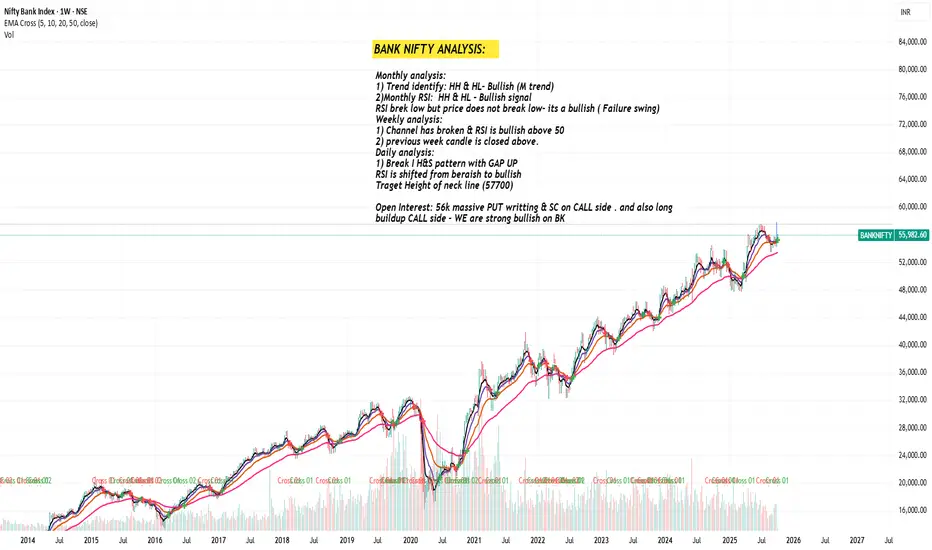
BANK NIFTY ANALYSIS: Strong BullishMonthly analysis:
1) Trend identify: HH & HL- Bullish (M trend)
2)Monthly RSI: HH & HL - Bullish signal
RSI brek low but price does not break low- its a bullish ( Failure swing)
Weekly analysis:
1) Channel has broken & RSI is bullish above 50
2) previous week candle is closed above.
Daily analysis:
1) Break I H&S pattern with GAP UP
RSI is shifted from beraish to bullish
Traget Height of neck line (57700)
Open Interest: 56k massive PUT writting & SC on CALL side . and also long buildup CALL side - WE are strong bullish on BK
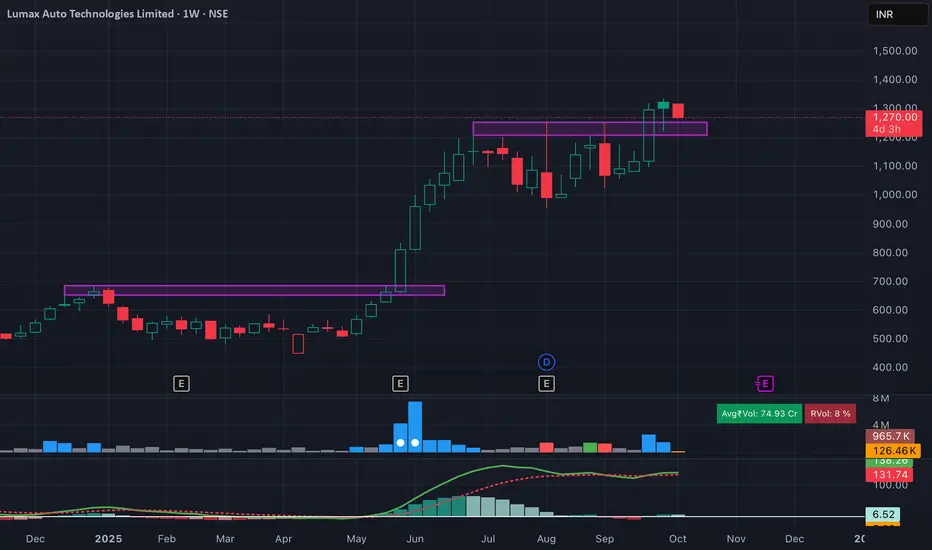
Lumax Auto Technologies – Fresh Breakout & Retest OpportunityLumax Auto Technologies has given a clean breakout above the 1,200–1,230 resistance zone and is now retesting the breakout on the weekly chart. Structure remains strong with higher highs and higher lows — showing continuation of the uptrend.
MACD is stabilizing after a healthy correction, suggesting momentum could rebuild soon.
📊 Swing Trade Setup
Entry Zone: 1,260–1,280
Stop Loss (SL): 1,215 (Weekly closing basis)
Targets: 🎯 1,400 / 1,500 / 1,600
View: As long as the stock holds above 1,215, trend remains bullish with potential for new highs in the coming weeks.
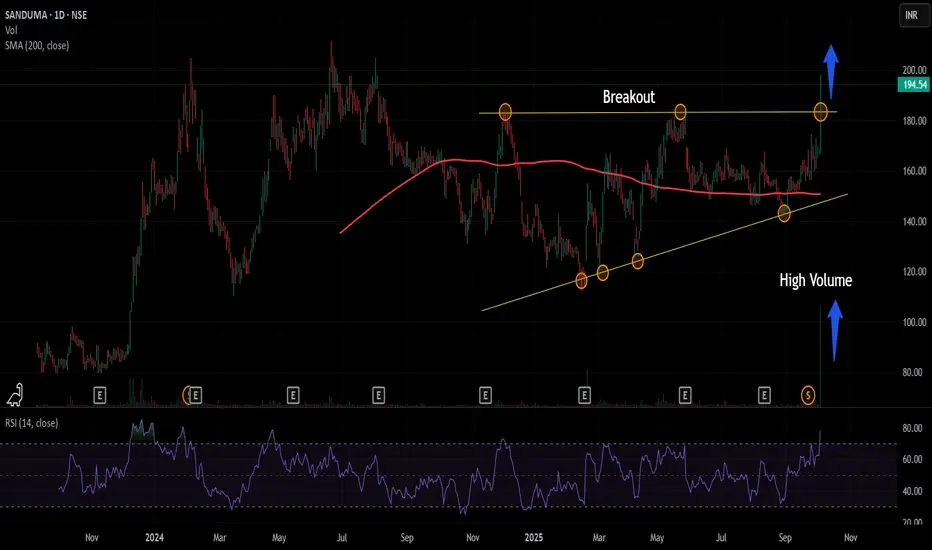
Sandur Manganese & Iron Ores Ltd : Breakout Sandur Manganese & Iron Ores Ltd is in consolidation since last one year. On Friday 3rd of Oct the stock moved up 15% with huge uptick in the volume.
The RSI reading above 70 also suggest there is momentum in the move.
Sector : Metal, outperforming to Nifty 50 benchmark
Looking at the price chart , the stock holds to the level of 175 can go up to 260 in short to medium term.
CMP : 194
SL 175
T1 : 260
Reward to Risk Ratio : 3
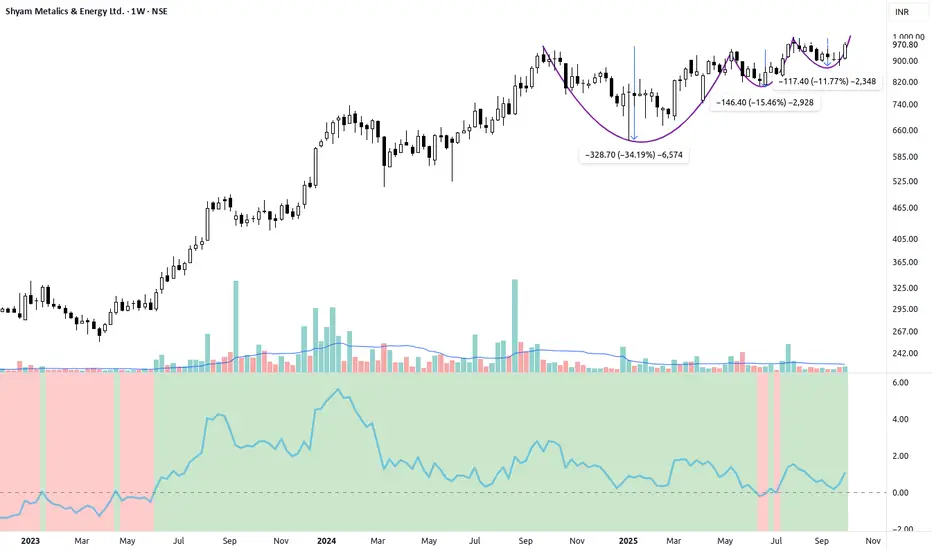
SHYAMMETL -High-Conviction VCP Breakout Setup1. The Setup: Textbook Volatility Contraction Pattern (VCP)
SHYAMMETL is setting up for a major breakout after consolidating near its all-time highs. The chart shows a classic Volatility Contraction Pattern (VCP), a powerful sign of institutional accumulation and supply exhaustion.
We can clearly observe three stages of contracting volatility:
Contraction 1: Deepest pullback (~34%)
Contraction 2: Shallower pullback (~15%)
Contraction 3: Tightest pullback (~11%)
This progressively tighter base confirms that selling pressure has dried up and the stock is ready for its next major leg up.
2. Key Technical Confirmation
Superior Relative Strength (RS): The Relative Strength line (bottom indicator) is trending strongly higher and is well above the zero line, confirming that this stock is significantly outperforming the broader market (Nifty). Leaders lead out of bases.
Uptrend Intact: The price is trading well above all key moving averages, which are stacked in a bullish configuration (shorter MAs above longer MAs). The long-term trend remains extremely robust.
Volume: Volume has been quiet during the base formation, which is ideal. We expect a large surge of breakout volume to confirm the move.
3. The Trade Plan
Entry Signal: Look for a decisive daily or weekly close above the ₹1,000 psychological and technical resistance level, backed by a significant surge in trading volume.
Stop Loss (Risk Management): Place a tight, objective stop loss just below the low of the final tight contraction range (e.g., around ₹830-840). This defines your maximum risk per share.
Target Expectation: Based on the strength of the VCP and superior relative strength, the expectation is for a sustained move into new All-Time Highs and a large multi-quarter trend extension.
#Disclaimer: This is for educational and observation purposes only and is not financial advice. Trade at your own risk.
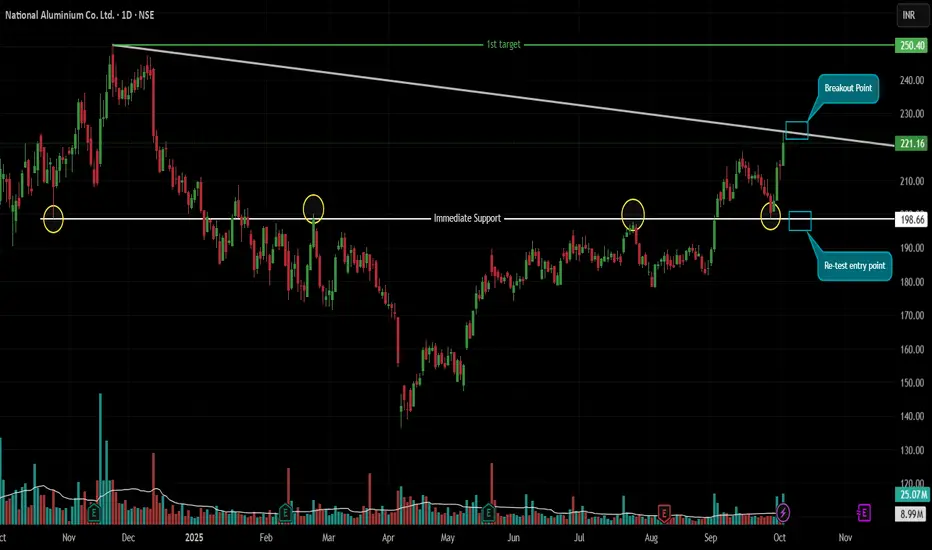
Two Precision Setups for a Major Move | Breakout vs. ReboundChart: NSE:NALCO | Daily Timeframe
📈 Executive Summary:
Nalco Ltd. is at a technical crossroads, compressed between a massive 12-month descending trendline and a rock-solid multi-touch support zone. This creates two high-probability, well-defined trading opportunities for both momentum and value traders. The key for both setups will be confirmation with above-average volume.
🔥 Scenario 1: The Mega Breakout (Momentum Play)
This setup capitalizes on a decisive shift in long-term trend dynamics.
The Structure: A dominant Descending Trendline connects the November 2024 high (₹250) with the recent October 2025 high (₹225). This line has contained all major rallies for nearly a year.
The Trigger & Confirmation: A strong, 'big green' daily candle that closes decisively above ₹225. This move must be supported by above-average volume to confirm genuine buying interest and not a false breakout.
The Logic: A breakout from such a long-standing consolidation has the potential to unleash significant pent-up momentum, targeting the previous major high.
🎯 Trading Plan (Breakout):
🎯 Entry: On a daily close above ₹225, confirmed by above-average volume.
⛔ Stop Loss: Low of the breakout candle. This pragmatic level protects against a false breakout and allows for a tight, logical risk definition.
🎯 Target: ₹250 (The origin point of the trendline, acting as a logical and psychological target).
⚖️ Risk-Reward: Highly favorable, estimated above 1:3.
🛡️ Scenario 2: The Support Bounce (Value Play)
This is a classic "buy low, sell high" strategy at a proven demand zone.
The Structure: The ₹199 level is a historic support and resistance zone, tested multiple times since October 2024. It currently acts as a strong support floor.
The Trigger & Confirmation: The price must retrace and hold the ₹199-202 zone and then form a clear bullish reversal candlestick pattern (e.g., Hammer, Bullish Engulfing) with above-average volume on the daily timeframe.
The Logic: Entering at a proven support level with a candlestick confirmation provides a high-probability entry with an excellent risk-to-reward profile.
🎯 Trading Plan (Support Bounce):
🎯 Entry: On the confirmation of the bullish candlestick pattern (e.g., a close above the high of the pattern's candle) in the ₹199-202 zone, with volume confirmation.
⛔ Stop Loss: Low of the identified reversal candlestick pattern. This minimizes risk by invalidating the setup if the support fails immediately.
🎯 Target 1: 1:1 Risk-Reward Level (e.g., if risk is ₹5, target is Entry + ₹5).
🎯 Target 2: ₹225 (The recent swing high and trendline resistance). Once Target 1 is hit, trail the stop loss to lock in profits and ride the move towards ₹225.
Key Levels At a Glance:
All-Out Resistance: ₹225 (The 12-Month Trendline)
Foundational Support: ₹199 (The Multi-Touch Zone)
Breakout Target: ₹250
Support Bounce Target: ₹210-225
Final Note: Both setups require patience and discipline. Wait for the specific trigger and volume confirmation. Do not pre-empt the trade.
Disclaimer: This idea represents a technical analysis perspective and is not financial advice. All trading decisions carry risk. Please perform your own due diligence.
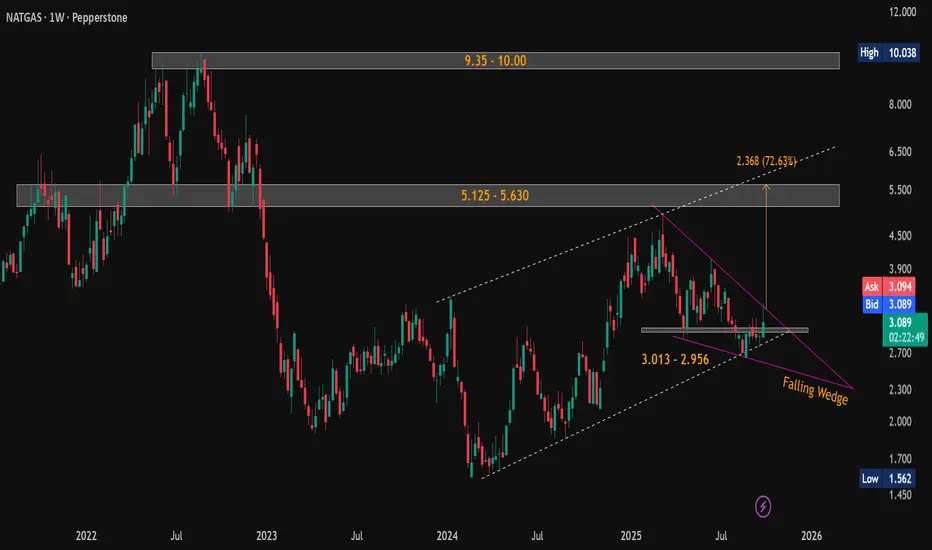
Natural Gas (NG) Weekly Breakout Brewing — 80% Upside Potential!Current Price: $3.090
Technical View (Weekly Timeframe):
Natural Gas has formed a classic falling wedge pattern on the weekly chart - a strong bullish reversal setup. Price action is currently on the verge of breakout , with increasing volume and narrowing range suggesting imminent movement.
🟢 Strong Support Zones:
$3.013 – $2.956
$2.692 – $2.643
🔺 Key Resistance / Upside Targets:
Short-term: $5.125 – $5.630 (Pattern target: $5.625 )
Long-term: $9.35 – $10.00
📈 The pattern breakout target of $5.625 aligns closely with the major resistance zone of $5.125 – $5.630, representing a potential ~80% upside from current levels.
Look for confirmed breakout above the wedge resistance with strong volume for trend continuation.
#NaturalGas | #NG | #FallingWedge | #ChartPatterns | #TechnicalAnalysis | #PriceAction
📌 Disclaimer: This analysis is shared for educational purposes only. It is not a buy/sell recommendation. Please do your own research before making any trading decisions.
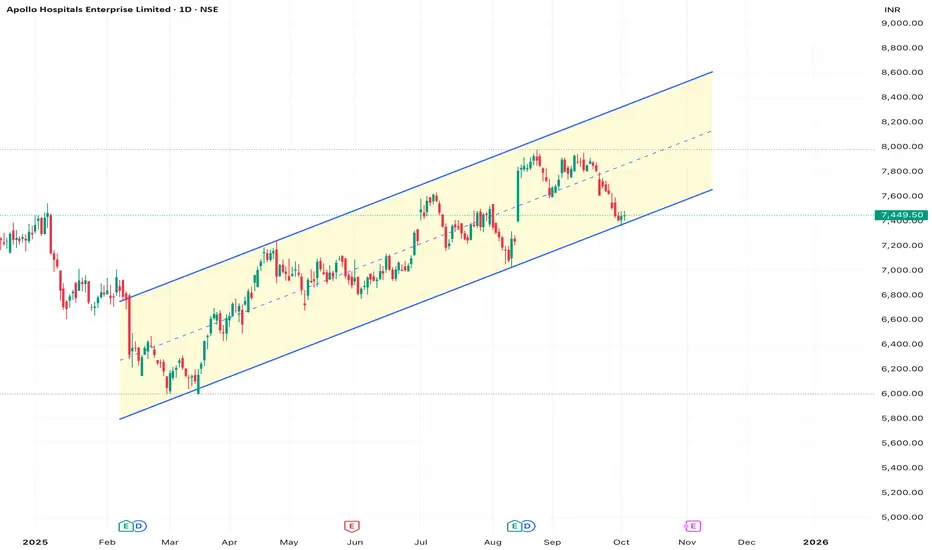
Apollo Hospital: Structure Analysis & Trade PlanThe price is currently sitting at ₹7,449.50, making it a high-interest area from a technical perspective.
Market Structure & Chart Pattern Analysis
Chart Pattern (Classic TA): The price is perfectly tracking the lower boundary (support) of a long-term Upward Channel. This is a classic "Buy the Dip" zone in a well-defined bullish trend structure.
Trend: The macro trend remains Bullish, as defined by the sustained movement within the rising channel since early 2025.
Current Location: The touch of the channel support at ₹7,400 - ₹7,450 offers a low-risk, high-reward entry point for a swing trade.
ICT Concepts for Confirmation
Discount Zone: The price is near the lowest quadrant of the recent price action (relative to the August high), placing it in a Discount Array, making it an opportune area to look for institutional buying.
Liquidity Sweep/Confirmation: The highest probability entry would involve waiting for one of the following on a lower timeframe (e.g., 4H/1H):
A slight break below the channel support (a liquidity grab/sweep of Sell-Side Liquidity - SSL below the recent swing lows) followed by an immediate reversal back into the channel.
A clear formation of a Bullish Order Block (final down candle before the expected strong move up) or an unmitigated Fair Value Gap (FVG) at the channel support line.
Market Structure Shift (MSS): Wait for a short-term MSS on a lower timeframe to confirm the buyers are taking control before entering.
Trade Plan
BUY (Anticipating Channel Bounce)
Entry Zone: ₹7,480 - ₹7,500 (Enter near the channel support, ideally with confirmation)
Stop Loss (SL): Below ₹7,300 (This places the SL clearly outside the channel and below the psychological support, invalidating the bullish channel structure).
Risk: ₹150 - ₹200 per share (The difference between current price/entry and SL).
Target 1 (T1): ₹7,900 - ₹8,000 (Channel Midline & psychological resistance).
Target 2 (T2): ₹8,200 - ₹8,400 (Channel Upper Boundary/Resistance).
Risk/Reward: Favorable (R:R is 1:2 to 1:4 depending on entry and target).
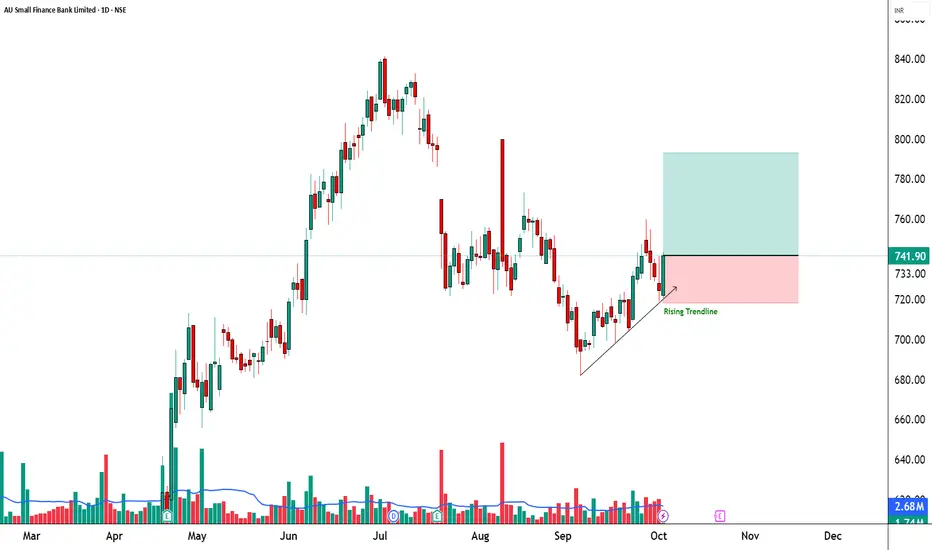
AUBANK - Bullish Engulfing + EMA50 Breakout = Power Rally Setup________________________________________
📈 AU Small Finance Bank | Bullish Engulfing + EMA50 Breakout 🚀
🔹 Entry Zone: ₹741.90 – ₹743.70
🔹 Stop Loss: ₹718.20 (Risk ~23 pts)
🔹 Supports: 727.17 / 712.43 / 704.17
🔹 Resistances: 750.17 / 758.43 / 773.17
________________________________________
🔑 Key Highlights
✅ Strong Bullish Candle – Engulfing pattern confirming reversal power
✅ EMA50 Breakout – trend shift signal
✅ Bullish VWAP Alignment – institutional buying confirmation
✅ Bollinger Squeeze-Off → breakout & volatility expansion expected
________________________________________
🎯 STWP Trade View
📊 Momentum indicates short-term bullish rally. A close above ₹750 may trigger an extended upside towards ₹758–773.
⚠️ Supports at ₹727 & ₹712 are important for trade protection.
________________________________________
💡 Learning Note
This setup demonstrates how a Bullish Engulfing pattern combined with EMA breakout + VWAP alignment can act as a multi-signal confirmation for a trend reversal.
________________________________________
⚠️ Disclosure & Disclaimer – Please Read Carefully
The information shared here is meant purely for learning and awareness. It is not a buy or sell recommendation and should not be taken as investment advice. I am not a SEBI-registered investment adviser, and all views expressed are based on personal study, chart patterns, and publicly available market data.
Trading—whether in stocks or options—carries risk. Markets can move unexpectedly, and losses can sometimes exceed the money you have invested. Past performance or past setups do not guarantee future results.
If you are a beginner, treat this as a guide to understand how the market works and practice on paper trades before risking real money. If you are experienced, always assess your own risk, position sizing, and strategy suitability before entering trades.
Consult a SEBI-registered financial adviser before making any real trading decision. By engaging with this content, you acknowledge full responsibility for your trades and investments.
💬 Found this useful?
🔼 Give this post a Boost to help more traders discover clean, structured learning.
✍️ Drop your thoughts, questions, or setups in the comments — let’s grow together!
🔁 Share with fellow traders and beginners to spread awareness.
👉 “If you liked this breakdown, follow for more clean, structured setups with discipline at the core.”
🚀 Stay Calm. Stay Clean. Trade With Patience.
Trade Smart | Learn Zones | Be Self-Reliant 📊
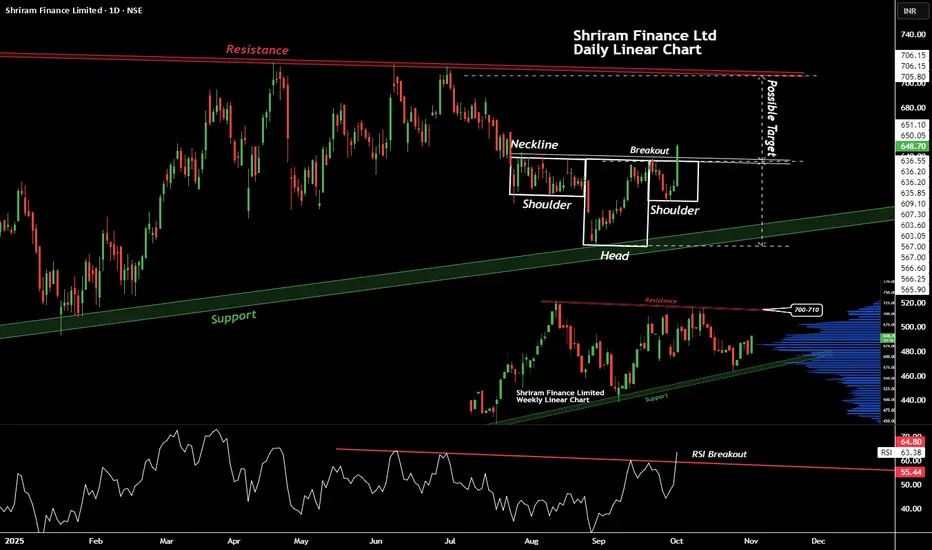
Shriram Finance Ltd, Breakout of Head & Shoulder patternWe can witness curious case of Mother pattern and a Child pattern here. In the caption image (right lower corner) we can see a bullish pattern of Ascending Triangle (not counting waves at the moment), to complete present wave stock must reach 700 to 710 levels, we can confirm same with child pattern of Head & Shoulder. Positive things about this stock are:-
Stock bouncing back from weekly support zone (Mother Pattern).
There is a breakout (Child Pattern).
Bullish with Momentum breakout (Child Pattern).
RSI breakout on daily timeframe, approving momentum.
Highest Volume activity (Mother Pattern), traders are taking interest.
Target of Child Pattern confirms with Resistance boundaries of Mother Pattern.
Though there is an EMA support on Mother pattern, not visible here as i checked it later.
Shriram Finance Ltd is a quality F&O stock, one can add on retest or at current prices for the small target of 700-710 in coming times. Always prepare for worse, in case of some bad news, some geo-political event or volatility, always apply some logical stoploss, you can go for HA lows or Swing lows.
Thanks, Happy Trading.
Saregama India LtdDate 03.10.2025
Saregama
Timeframe : Day Chart
Key Highlights
(1) Company is almost debt free
(2) Debtor days have improved from 63.4 to 44.6 days
(3) Company's median sales growth is 18.8% of last 10 years
(4) Company's working capital requirements have reduced from 86.2 days to 40.3 days
(5) Fii & Dii have increased stake/s in the last 2-3 quarters
(6) It owns ~50% of all the music ever recorded in India
Valuations
(1) Market Cap ₹ 9,127 Cr
(2) Stock P/E 45.5
(3) ROCE 17.2 %
(4) ROE12.5 %
(5) OPM 24 %
(7) Promoter holding 60%
Business Segments
(1) Music : Licensing + Artist Management 77%
(2) Video : Films, TV, and Digital Content 23%
(3) Events : 0.5%
Geographical Split
(1) India - 59%
(2) Others - 41%
Regards,
Ankur Singh

spot gold or mcx gold update as per chartgold spot looks stair pattern or now news in focus usa shut down--
technical lvl- spot gold abv 3883 looks again up side 3900-3920--3945$ where support 3860$ which break blow with volume than more down fall 33852--42--34$ expect.
mcx gold sustain abv 118300 looks 119k near where support 117700 which can be create down correction in evening side.

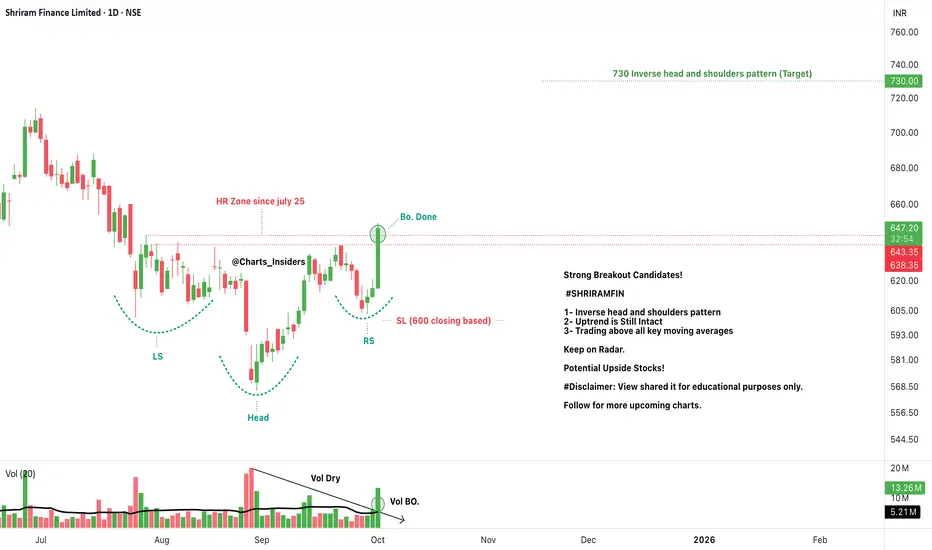
SHRIRAMFINStrong Breakout Candidates!
#SHRIRAMFIN
1- Inverse head and shoulders pattern
2- Uptrend is Still Intact
3- Trading above all key moving averages
Keep on Radar.
Potential Upside Stocks!
#Disclaimer: View shared it for educational purposes only.
Follow for more upcoming charts.
LIC – High Probability Breakout Setup!After a long consolidation, LIC is now approaching a falling trendline breakout with strong bullish momentum.
This is a high probability breakout setup supported by price action and structure.
📌 Plan:
✅ Entry: 900–910
❌ Stoploss: 844
🎯 Targets: 970–985 / 1068 / 1172
Highlights:
Multiple rejections at the trendline – now testing again 🔄
Strong base with trend reversal expected 📊
Favorable Risk–Reward for swing traders ⚡
Holding Duration: As per Target & Stoploss ⏳
📈 A breakout above 910 could open the gates for a strong rally ahead!
#LIC #NSEStocks #BreakoutSetup #SwingTrading #PriceActionTrading #TrendlineBreakout #TechnicalAnalysis #StockMarketIndia #TradingView #RiskReward

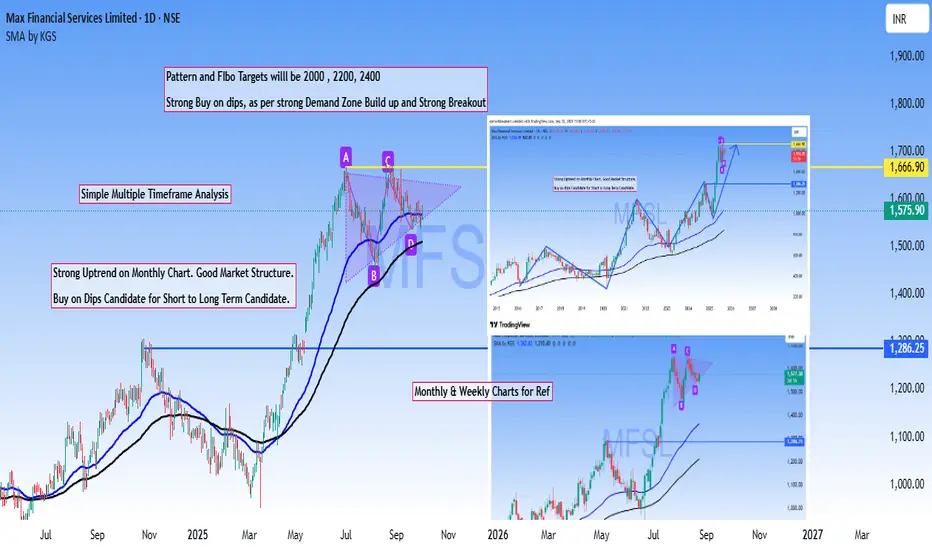
MFSL Multi time frame AnalysisMulti-timeframe confluence analysis offers traders a robust edge through straightforward yet highly effective methodology.
Based on that MFSL is a strong Buy on dips stock based on powerful breakout of previous ATH and the current market structure.
Targets are derived from #Pattern #breakout and #Fibonacci levels.
Bullish Pennant in formation.
Disclaimer: Above analysis shared for educational purpose only.
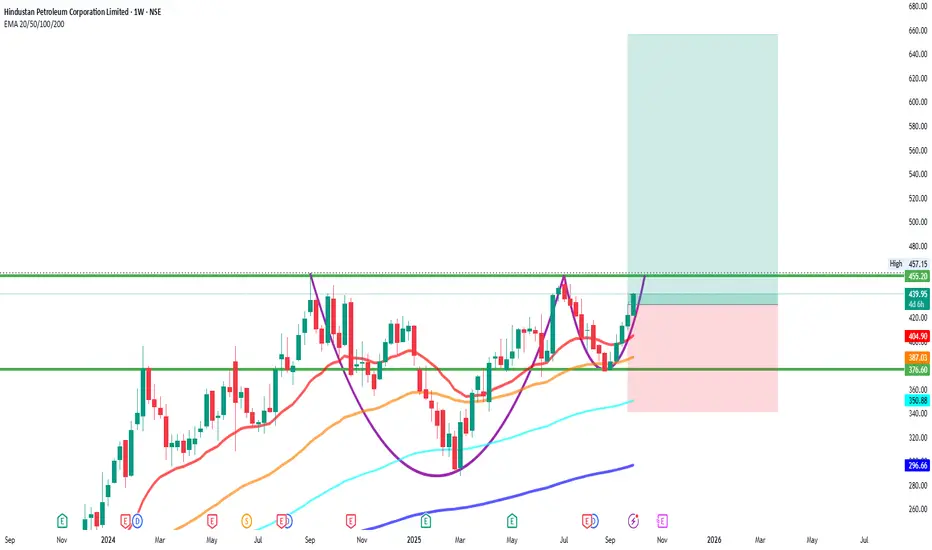
HINDPETROHINDPETRO
bullish trend is Showing on the chart.
buy signals in
technical indicators and
cup with handle chart pattern.
Watch for a breakout above 450/460 to sustain the bullish trend. If the resistance holds, there could be a retest towards 360/370 and an uptrend from here.
ICICI Bank: Resistance Turned Support Powers Next Rally🔍 Technical Analysis
ICICI Bank showcases another remarkable wealth creation story spanning over two decades. The stock has delivered an extraordinary super bullish rally, transforming from ₹40 to the current trading level of ₹1,351 - representing an impressive 33.8x growth over 20+ years.
The ₹1,345-₹1,365 zone has historically acted as a strong resistance, tested multiple times. However, with the confirmation of strong FY25 results, the stock decisively broke out from this resistance zone and created a new all-time high at ₹1,500.
Following the breakout peak, the stock witnessed a sudden fall and is now trading back in the same zone at current market price of ₹1,351. This presents a critical juncture - if the earlier resistance zone transforms into support with bullish candlestick pattern confirmations, it could signal the next leg of the rally.
Entry Strategy: Enter only on confirmation of ₹1,345-₹1,365 zone acting as support with bullish patterns.
🎯 Targets:
Target 1: ₹1,400
Target 2: ₹1,450
Target 3: ₹1,500
🚫 Stop Losses:
Critical Support: ₹1,200 (crucial demand zone)
If ₹1,200 level doesn't sustain, no more expectations on this stock.
💰 FY25 Financial Highlights (vs FY24 & FY23)
Total Income: ₹1,86,331 Cr (↑ +17% YoY from ₹1,59,516 Cr; ↑ +95% from FY23 ₹95,407 Cr)
Total Expenses: ₹1,30,078 Cr (↑ +31% YoY from ₹99,560 Cr; ↑ +48% from FY23 ₹87,864 Cr)
Financing Profit: ₹-32,775 Cr (Improved from ₹-14,152 Cr in FY24)
Profit Before Tax: ₹72,854 Cr (↑ +21% YoY from ₹60,434 Cr; ↑ +58% from FY23 ₹46,256 Cr)
Profit After Tax: ₹54,569 Cr (↑ +18% YoY from ₹46,081 Cr; ↑ +54% from FY23 ₹35,461 Cr)
Diluted EPS: ₹71.65 (↑ +14% YoY from ₹63.02; ↑ +47% from FY23 ₹48.74)
🧠 Fundamental Highlights
ICICI Bank delivered robust FY25 performance with 18% PAT growth to ₹54,569 crore, supported by strong 17% revenue growth. The bank announced Q4 FY25 net profit of ₹12,630 crore, marking 18% increase, and declared ₹11 per share dividend reflecting strong financial health.
Market cap stands at ₹9,71,186 crore (up 4.06% in 1 year) with total revenue reaching ₹1,90,830 crore and profit of ₹56,563 crore. Stock is trading at 3.08 times its book value, indicating reasonable valuation for quality franchise.
Asset quality continues to improve with gross NPA dropping to 1.97% in Q2FY25 from 2.48% in Q2FY24, while net NPA ratio remained healthy at 0.43% in Q1 FY25. This demonstrates effective risk management and strong credit discipline.
The bank shows strength near key support zone of 1370-1390 on daily charts, with technical indicators suggesting potential diamond pattern formation around 1380-1400 range. Analysts expect stable net interest margins and continued momentum.
Strong digital banking initiatives, expanding retail franchise, and consistent delivery of 14-18% profit growth across quarters validates the bank's operational excellence and market leadership position in private banking sector.
✅ Conclusion
ICICI Bank's remarkable 20+ year journey from ₹40 to ₹1,500 all-time high, backed by strong FY25 fundamentals showing 18% PAT growth and ₹11 dividend, validates the sustained growth thesis. The critical ₹1,345-₹1,365 resistance-to-support transformation offers attractive entry opportunity for targeting ₹1,500 retest. Improving asset quality with 1.97% gross NPA, strong ROE profile, and digital transformation drive provide multiple growth catalysts. Key support at ₹1,200 provides risk management framework for this quality banking franchise.

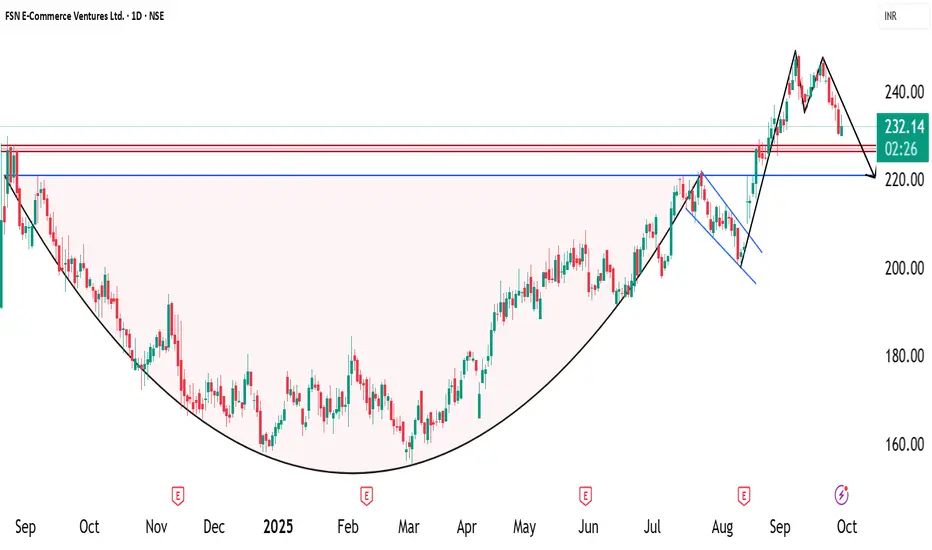
NYKAA - Cup with handle pattern📈 Pattern Analysis: Nykaa recently completed a "Cup-with-Handle Breakout" , which is a strong bullish continuation pattern. However, the breakout targets have not yet been achieved. In the past few sessions, the stock has witnessed selling pressure, forming a double-top bearish pattern on the chart.
📊 Key Levels & Structure: The price is currently in a corrective phase and may move lower to retest the breakout zone of the cup-with-handle pattern. This zone is expected to act as a strong support level and could provide a fresh opportunity for accumulation if the structure holds.
🔎 Momentum Indicators:
RSI has cooled off from overbought levels, creating room for the next leg of upside.
Volumes during the recent dip are lower compared to the breakout volumes, suggesting the decline is corrective rather than a trend reversal.
🎯 Projection & Outlook:
A successful retest of the breakout zone could resume the uptrend with upside targets around ₹ .... levels in the medium term. Failure to hold the support could, however, lead to extended consolidation.
⚠️ Disclaimer:
This is a technical projection, not an investment recommendation. Traders should manage risk carefully and align strategies with their financial objectives.
Daily analysis for Nifty50: 29/09/25Nifty is still not bullish. A trendline support test is quite possible. That comes at around 24535-24520 range of price. If that is breaching it will test lower levels of 24560, 24405 and 24360 as downside fall.
On bounce it will rise till 24630 to 24740 as resistance.

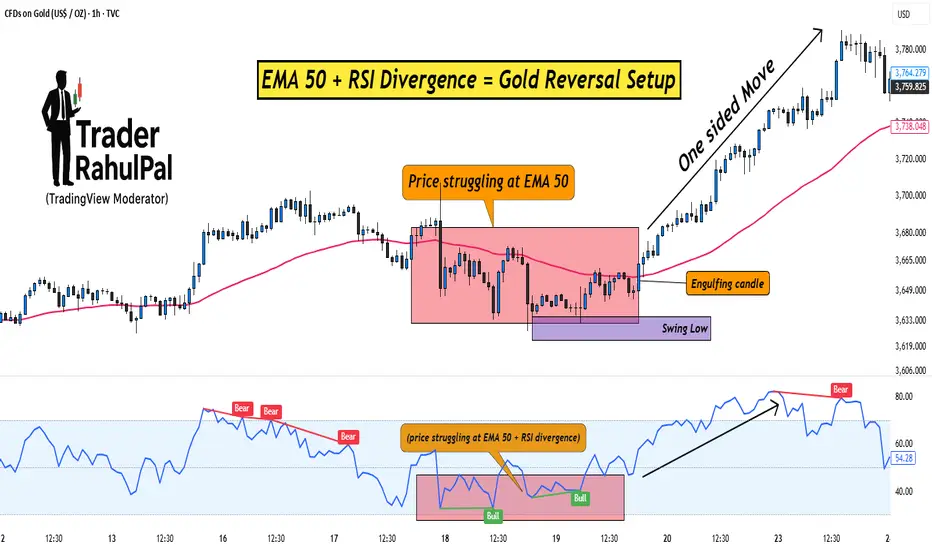
EMA 50 + RSI Divergence = Gold Reversal Setup!Hello Traders!
Gold often makes sharp one-sided moves, trapping traders who enter too late. But if you know how to combine a simple moving average with a momentum indicator, you can spot high-probability reversal setups.
One such method is using the EMA 50 together with RSI Divergence . Let’s break down how it works.
1. Why EMA 50?
The 50-period EMA acts as a dynamic trend filter.
When gold trades above it, the short-term trend is bullish; below it, bearish.
Price often retests the EMA 50 during pullbacks, making it a key level to watch for reversals.
2. What is RSI Divergence?
Divergence happens when price makes a new high/low, but RSI doesn’t confirm it.
Example: Price makes a higher high, but RSI makes a lower high → bearish divergence.
This signals that momentum is weakening, even if price is still moving strongly.
3. Combining EMA 50 with RSI Divergence
First, check where price is relative to EMA 50.
Next, look for divergence on RSI near that zone.
If both align (price struggling at EMA 50 + RSI divergence), chances of a reversal increase sharply.
4. Entry & Risk Management
Wait for a confirmation candle near EMA 50 (like engulfing or pin bar).
Place stop loss just above recent swing high/low.
Target the next support/resistance zone for exits.
Rahul’s Tip:
Don’t use divergence alone, combine it with EMA 50 for structure and you’ll filter out most false signals. This setup works best on higher timeframes like 1H or 4H for gold.
Conclusion:
EMA 50 gives you the trend filter, and RSI divergence reveals momentum weakness.
Together, they form a reliable reversal setup that helps you enter gold trades at the right time instead of chasing moves.
This Educational Idea By @TraderRahulPal (TradingView Moderator) | More analysis & educational content on my profile
If this post gave you a new setup idea, like it, share your thoughts in comments, and follow for more practical trading strategies!
Lumax industries Look like after strong volume absorption done
Also auto part sector in trending.
Also sector given break out
Little bit late post , allready created entry just post for my trading history chart remember in future look what i have done mistake or Good point
Take 10%risk withtrade

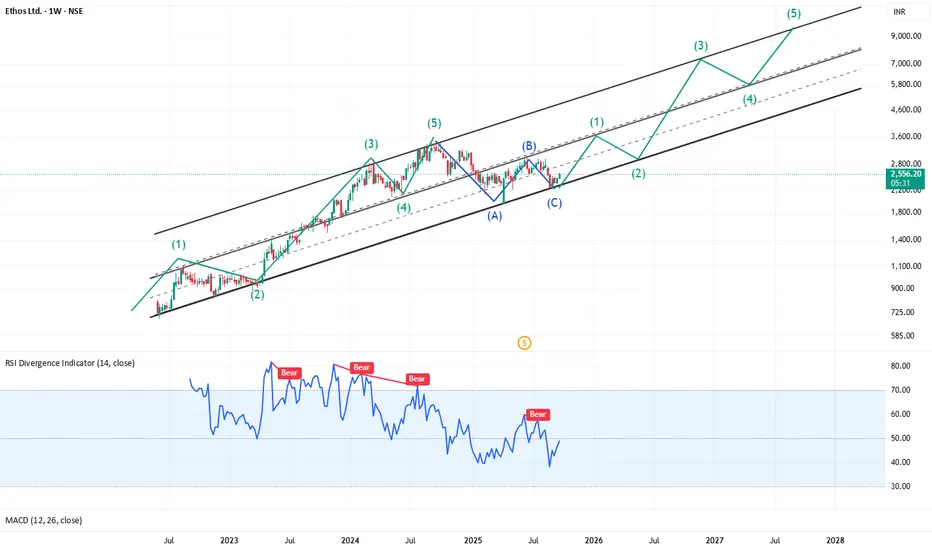
Fasten your wrist watches : CMP 2560Impulse and Corrective Structure
On the ETHOS weekly chart, the price action aligns closely with classic Elliott Wave theory. A complete 5-wave impulse pattern (labelled 1-2-3-4-5 in green) can be observed progressing within a rising parallel channel. Each impulse sequence is followed by a 3-wave corrective phase (labelled A-B-C in blue), after which a new cycle initiates.
Impulse Waves (1-2-3-4-5):** These waves move in the direction of the primary trend. Waves 1, 3, and 5 represent strong advances, while waves 2 and 4 are smaller pullbacks or consolidations.
Corrective Waves (A-B-C):** Corrections are typically countertrend moves that restore balance before the next motive cycle resumes. The corrective sequence here perfectly resets the price for the next bullish advance.
Channeling Technique
Drawing parallel channels around waves 1 and 3, and extending them through wave 2 or 4, offers structural clarity and potential target zones for subsequent waves—especially for the powerful wave 5.
Momentum and Divergence
The Relative Strength Index (RSI) at the bottom provides crucial support to this wave count. Notably, multiple Bearish Divergence signals (marked as "Bear" in red) preceded key market tops, aligning with wave 3 and wave 5 peaks. The RSI's cyclical response adds confidence to the completion of impulse or corrective phases and helps anticipate market reversals.
Projection and Trading Strategy
Based on the current wave structure:
- ETHOS has potentially completed a full corrective A-B-C phase.
- The initiation of a new impulse cycle is underway, with projected sub-waves (1-2-3-4-5) mapped along the upper channel.
- Conservative traders can look for confirmation with a breakout above the corrective channel or a bullish RSI signal.
- Aggressive entries may be considered near wave (2) lows with stop-losses below prior corrective supports.
As always, proper risk management and confirmation from supporting indicators are essential for successful implementation.
Traders are encouraged to validate their wave counts with price action and momentum tools.
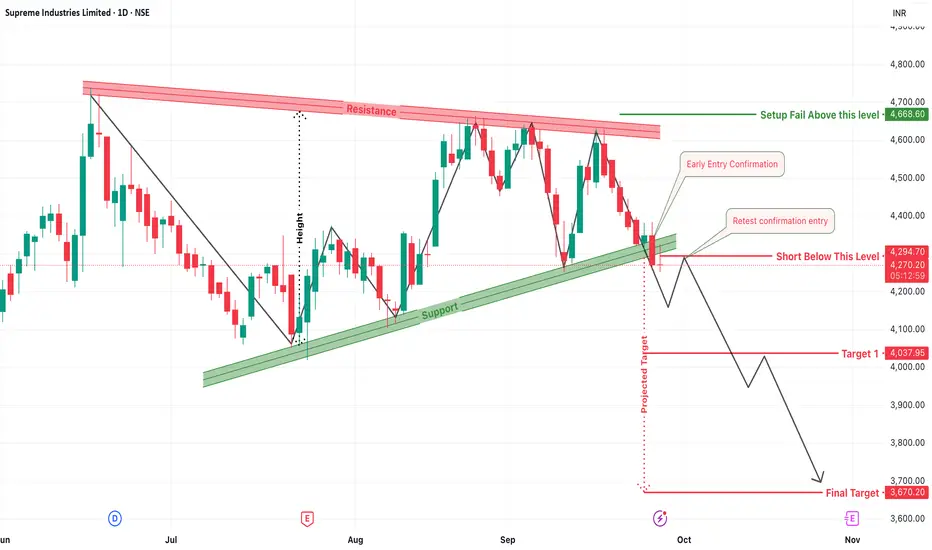
Supreme Industries: Breakdown Below Ascending SupportThe daily chart of Supreme Industries is showcasing a strong bearish signal with a breakdown below a long-held ascending trendline. The structure clearly resembles a descending triangle pattern, and the breakdown confirms growing weakness in price action, favoring sellers in the near term.
1. Bearish Structure Breakdown
The chart shows a clear descending resistance line with a rising support trendline, forming a tight triangle pattern. This kind of setup often indicates building pressure for a breakout, and in this case, it has resulted in a sharp breakdown below ₹4294, signaling the start of a fresh bearish leg.
2. Short Entry Below ₹4294.70
A confirmed breakdown is seen once the price breached below ₹4294.70. This is the ideal short entry trigger zone. Traders looking to enter early may have taken a position right at breakdown, while others may wait for a retest of the broken trendline as confirmation before entering.
3. Early Entry & Retest Entry Zones
For aggressive traders, an early entry just as the price approached the lower trendline was possible. However, confirmation entry after a retest offers better risk-reward and lower false breakdown probability. In this case, a small pullback to retest the broken support would be the sweet spot to enter with tight stop-losses.
4. Target 1: ₹4037.95 – First Downside Milestone
Once the breakdown is confirmed, the first logical price target based on previous swing lows and pattern measurement comes to around ₹4037.95. Traders can consider booking partial profits at this zone to lock in gains while letting the rest of the position ride.
5. Final Target: ₹3670.20 – Projected Measured Move
Based on the height of the triangle structure, the projected final bearish target lies near ₹3670.20. This level aligns with previous consolidation zones and serves as a strong psychological and technical support. If price action remains weak, this target has a high probability of being achieved in the coming weeks.
6. Stop Loss: Setup Invalid Above ₹4668.60
To protect against a failed breakdown or reversal, a stop-loss should be strictly placed above ₹4668.60. This level invalidates the bearish structure and signals that buyers may have regained control.
7. Trading Psychology and Risk Note
Breakdowns from such ascending supports after long consolidations often result in impulsive price moves. However, risk management is critical. Stick to position sizing and trail your stop-losses once Target 1 is achieved. Avoid holding full-size positions near earnings or event-based volatility.