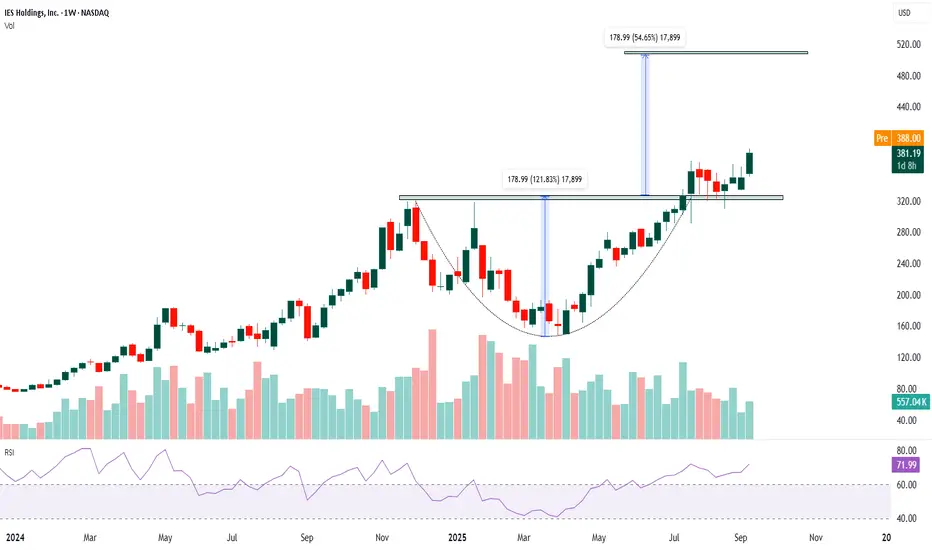
IESC- Long The chart shows a clear uptrend over the past year.
Price formed a rounded bottom (cup-shaped base) and has broken above the neckline near $320–$330, confirming a bullish continuation pattern. Current price around $381 indicates sustained bullish strength.
Volume rose meaningfully during the breakout above $330, confirming the validity of the breakout. Prior to the breakout, volume was lower during consolidation, which is typical before a strong move.
Cup and Handle breakout confirmed above $330 neckline.
Current breakout is clean, backed by momentum and volume.
The stock is in a confirmed uptrend, backed by strong momentum and volume. Best strategy: Buy on dips near $340–$350 or add above $390–$400 with confirmation. Targets: $450 short-term, $500–$520 long-term. Maintain disciplined stop-loss placement to manage risk.
Community ideas
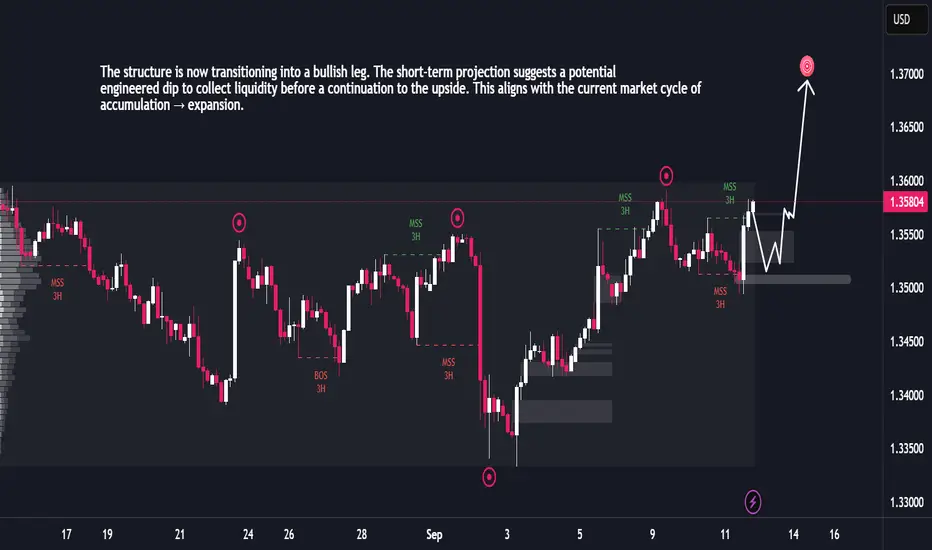
GBPUSD Ready for Expansion After Liquidity GrabThe market has been trading within a broad range, characterized by multiple liquidity grabs on both highs and lows. Each sweep has been followed by sharp reactions, confirming active smart money positioning. Recent price action shows a strong recovery after a downside liquidity sweep, indicating accumulation and rebalancing of orders.
The structure is now transitioning into a bullish leg. The short-term projection suggests a potential engineered dip to collect liquidity before a continuation to the upside. This aligns with the current market cycle of accumulation → expansion.
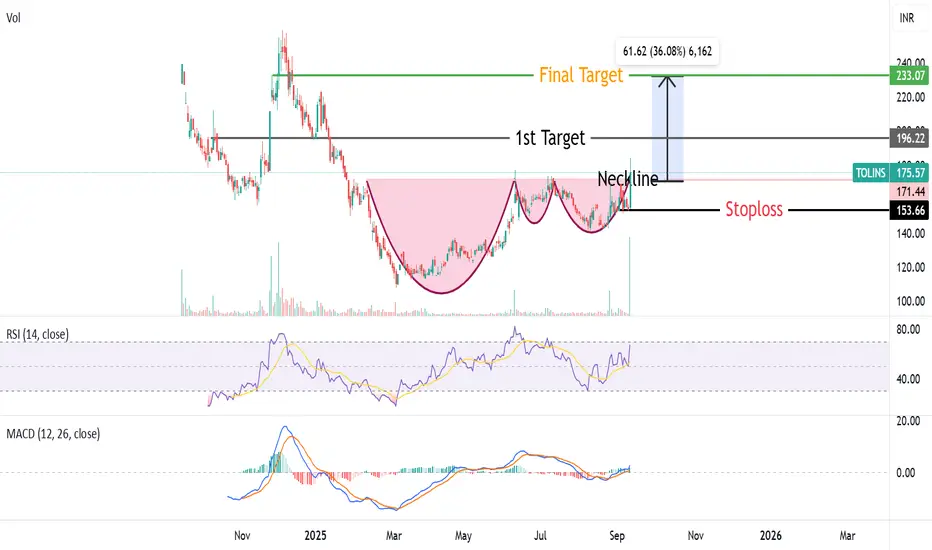
Complex Cup & Handle Pattern Breakout in TOLINS TyresTolins Tyres given Complex Cup & Handle Pattern Breakout from neckline arround 170 level. RSI & MACD also showing positive momentum ,Stock also trading above all important moving averages(50,10,200).Target of this breakout will be 230 Rs ,With a stoploss of 150Rs.
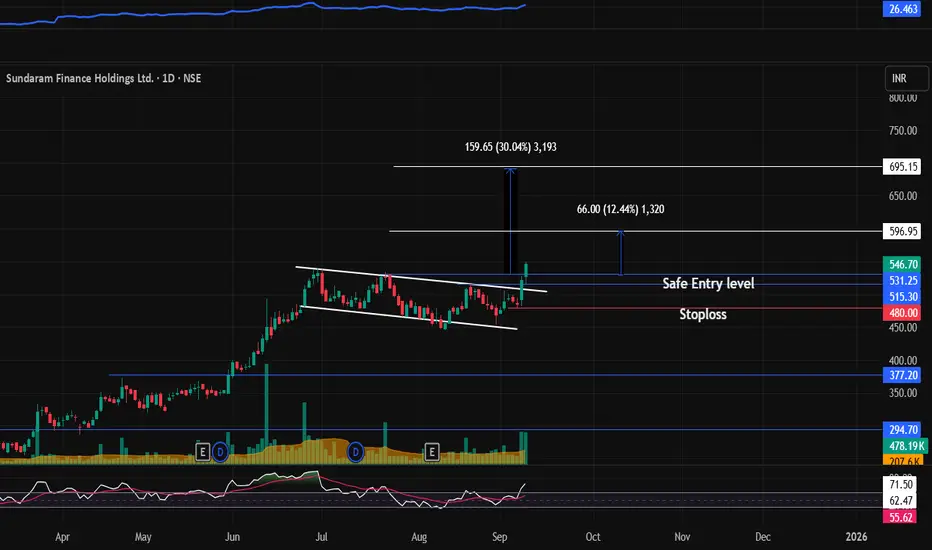
SUNDARMHLD : Breakout stock (Swing pick)#SUNDARMHLD #flagbreakout #breakoutstock #channelbreakout #swingtrading #momentumtrading
SUNDARMHLD : Swing / Short term (1-3 months)
>> Flag Breakout or Channel Breakout
>> Good Strength in stock
>> Volumes picking up
>> Low PE Stock
>> Swing Traders can Look for 10-12% Levels & Short term traders can go for Higher Levels
>> Enter at Retracement
Swing Traders can lock profit at 10% and keep Trailing
Please Boost, comment and follow us for more Learnings
Disc : Charts shared are for learning purpose only, not a Trade recommendation. Do your own research and consult your financial advisor before taking any position.
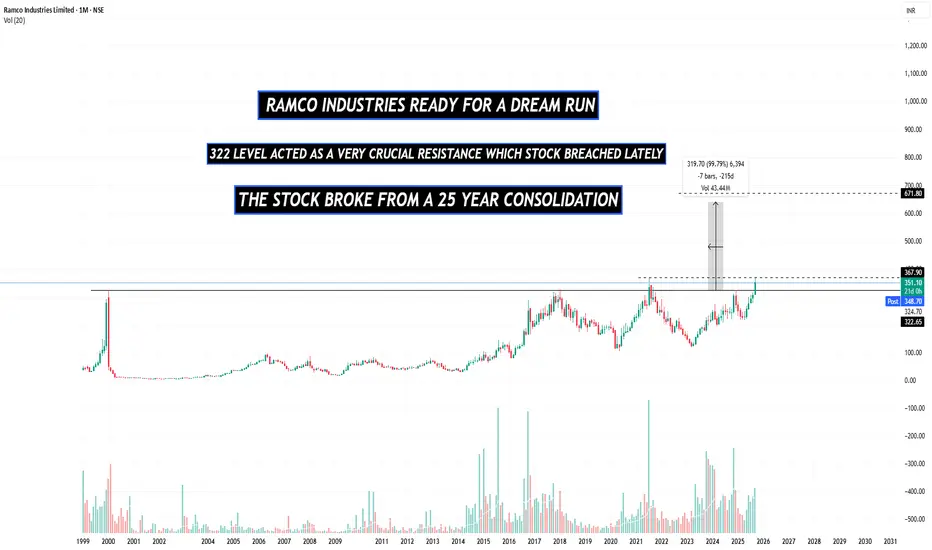
RAMCO INDUSTRIES NEAR MULTIYEAR BREAKOUTThe stock has not been able to breach the crucial resistance of 322 since 1999, pretty strange.
but now the the stock ha rallied past that level with good momentum enforcing further trust in the stock
The stock is also trading below it's book value of 488 again a pretty strange yet interesting opportunity.
It is Part of the Chennai-based Ramco Group;
Ramco Industries Ltd. is engaged in the manufacture of Fiber Cement (FC) sheets and Calcium Silicate Boards (CSBs). Company is also engaged in the spinning of cotton yarn; sale of surplus electricity generated from its windmills and computer software.
The company operates through 10 manufacturing plants for Building Products with a combined production capacity of 10,00,000 TPA
The company's profits and sales have also skyrocketed
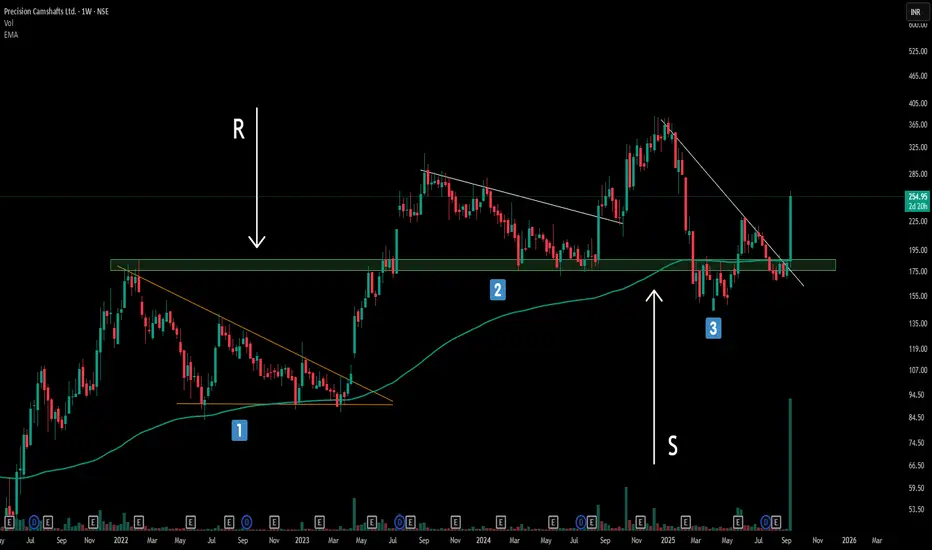
The Power of Trendline Angles : My Full time trading ExperienceBreaking Down Three Critical Trendline Structures - A Complete Analysis
Structure 1: The Power of Steep Angles (Primary Focus)
The first structure showcases what I consider the gold standard of trendline breakouts. Notice how the trendline is significantly tilted/slanted rather than following a gradual 45-degree angle.
Compressed Energy Release: Steep trendlines act like coiled springs, storing tremendous buying/selling pressure that explodes upon breakout
Key Observation: The resistance level (marked as 'R') held price down multiple times before the decisive breakout. Once broken, this level immediately flipped to become strong support (marked as 'S')—a textbook example of polarity flip dynamics.
Structure 2 & 3: Valid but Secondary Setups
While structures 2 and 3 represent legitimate continuation-based trendline breakouts, they pale in comparison to the explosive potential of Structure 1. However, they still qualify as CT (Continuation Trend) based breakout structures and shouldn't be ignored entirely
Remember: Not every trendline break deserves your attention. Focus on steep angles, exceptional volume, and clear flip confirmations for the highest probability setups. The market rewards patience and precision over frequency.
Disclaimer: Trading involves significant risk and is not suitable for all investors. Past performance does not guarantee future results. Always conduct your own research, consider seeking advice from a qualified financial advisor, and trade only with capital you can afford to lose.
Apollo Tyre - SMC AnalysisTechnical Analysis (SMC Method)
Even it is formed bullish choch and trendline breakout in the weekly timeframe, it has to break the crucial resistance zone in daily timeframe (between 488 & 500) for confirmation. Once it's broken in daily timeframe the estimate target price will be 535/540.
== EDUCATIONAL PURPOSE ONLY ==

Finally the breakout is done or has it not?Stock has been in long consolidation phase with ibu and para prices making lower lows since over stocking post covid. With the new initiative taken by management and prudent cash allocation from covid times, the volumes speak of more than what the PAT showcases.
Technically on weekly charts on the first day of the week, a good volume is seen. Close at 20% would be essential for the continuous up move.
Lupin LtdDate 08.09.2025
Lupin
Timeframe : Weekly Chart
Brands
(1) Lupin Life
(2) Lupin Diagnostics
(3) Life Atharv Ability
(4) SciFlix
(5) Humrahi
(6) Pharmarack
Leadership
(1) Respiratory
(2) Diabetes Care
(3) Cardiac Care
Lupin has partnered with Amman Pharma for exclusive marketing and
commercialization of Ranibizumab, a biosimilar of Lucentis, in the Middle East region, including select territories of Jordan, Saudi Arabia, UAE, Iraq, Lebanon, and other GCC countries
Sales Mix
(1) India 34%
(2) US 38%
(3) API 5%
(4) EMEA 10%
(5) ROW 4%
(5) Growth markets 9%
Valuations
(1) Market Cap ₹ 89,467 Cr.
(2) Stock P/E 24
(3) ROCE 21%
(4) ROE 20%
(5) OPM 23%
(6) PEG 0.48
(7) Sales Growth 12%
(8) Profit Growth 63%
(9) Promoter 47%
(10) DII 25%
Regards,
Ankur

URJA a worthy penny stock??? detailed analysis - education only!short term speculative trade? - educational purpose
in the past the stock after touching longterm trendline bounces significantly
personally I'm allocation 1-2.5% of my total capital into this speculative trade with 50%+ sl
Momentum in Fundamentals:
FY24 saw total revenue grow from ₹39.58 Cr in FY23 to ₹44.47 Cr (+12.4%), and PBT rise 43.9% to ₹2.85 Cr. Net profit jumped 33.3% to ₹2.04 Cr.
On a nine-month basis (ending December 2023), net profit improved to ₹2.38 Cr from ₹1.89 Cr year-on-year. Margins (PATM) also increased to 7.49% from 6.41%.
Recent Quarterly Jump: In Q3 FY25, revenue surged to ₹14.35 Cr compared to ₹1.16 Cr the previous year. While net profit fell from ₹0.98 Cr to ₹0.36 Cr, the revenue growth was significant. Importantly, this spike triggered a 5% upper-circuit move in the stock.
ROE & ROCE Trends:Urja Global's Return on Equity (ROE) and Return on Capital Employed (ROCE) have been improving over the past two years—indicating increasing efficiency.
Low Leverage: The company maintains low debt and has zero promoter pledge, implying a cleaner balance sheet and lower financial risk relative to highly leveraged peers.
Stock Performance History:
Despite high valuations, its stock has delivered remarkable returns—~175% over one year and ~735% over five years (as of May 2024).

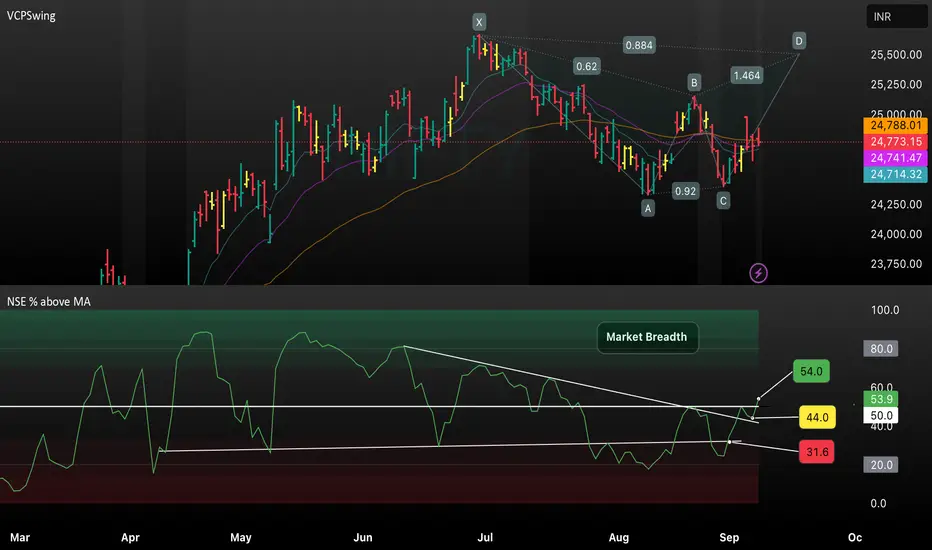
Market Breadth Breakout – Tracking NSE MomentumThis TradingView chart analyzes the NSE Index with a focus on market breadth, highlighting the percentage of stocks above their moving averages. The chart showcases a recent breakout above key breadth levels (44.0 and 50.0), signaling improving momentum and a potential trend reversal. Visual trendlines track advancing participation, offering insight into market strength and possible continuation if breadth values sustain above these thresholds. This setup helps traders identify early signs of bullish sentiment before price confirmation.
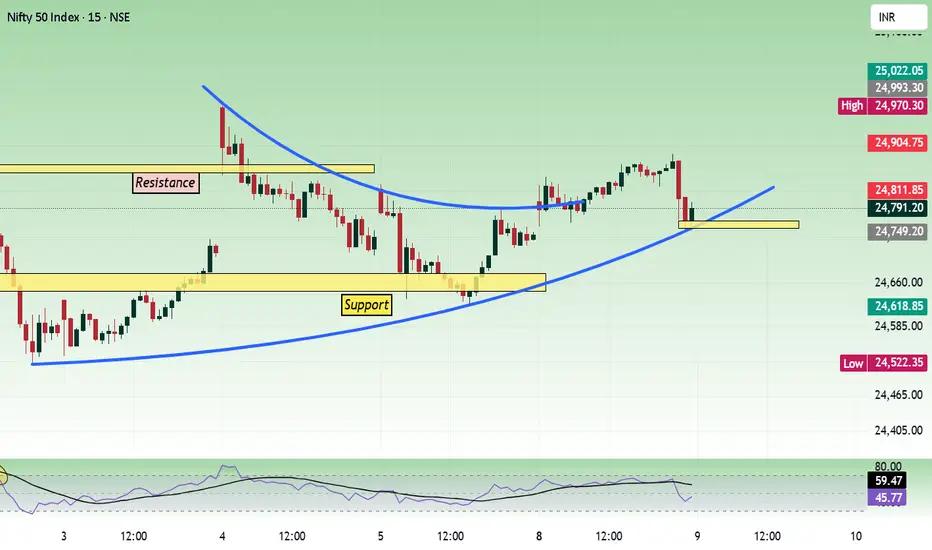
Nifty - Multi time frame analysis Sep 9Today, the price did not gain strength and moved in the range of 24700 to 24900. And 25000 is a psychological level. This type of nearby support/resistance can give choppy movement unless the price shows strength from the opening.
Support levels are 24500, 24600. Resistance levels are 24900, 25000.
We can buy if the price opens at support with bullish strength.
If the opening is flat, buy above 24820 with the stop loss of 24770 for the targets 24860, 24920, 24980, 25020, and 25080.
Sell below 24680 with the stop loss of 24730 for the targets 24640, 24600, 24540, 24500, 24460 and 24420.
As per the daily chart, the price is moving in a range, and it also has nearby trendline resistance.
Strong movement can happen if the trend line is taken with strength.
As per the hour chart, if the price does not gain strength when breaking the range it has formed today, then the expiry will be in range.
Expected expiry day range is 24400 to 24900.
Bullish Iron Condor on Nifty (30th September 2025 expiry)Hello Traders!
Just like we shared the August Iron Condor setup, here comes the fresh plan for September expiry.
Nifty is trading around 24,840 and we are witnessing a defined range between 23,750 – 25,500.
Such ranges are perfect for premium eating strategies like the Iron Condor, where time decay works in our favour as long as the index stays inside the zone.
So here’s the September plan:
Position Details
Sell 2 lots 24,700 PE @ 140.30
Buy 2 lots 24,400 PE @ 71.60
Sell 2 lots 25,500 CE @ 53.95
Buy 2 lots 25,750 CE @ 22.95
We expect Nifty to consolidate between 23,750 – 25,500 as per our technical chart analysis .
200-DEMA is acting as dynamic support
Strong resistance capped near 25,500 – 26,270
Until a breakout happens on either side, premium sellers can stay in control
This Iron Condor gives us a balanced risk-reward setup and benefits from time decay while keeping risk well-defined.
Why I Like This Setup:
Limited loss , defined by hedge positions
High probability of success as long as Nifty remains in the range
Best suited for traders focusing on consistent income from option writing
Rahul’s Tip 👉 Discipline in trade management is always more important than the setup itself.
For income-based option strategies, always check for:
Key events and news (policy, RBI, FED, budgets, etc.)
Breakout signals beyond short strikes
Quick exit or adjustment if market moves out of range
Disclaimer This post is for educational purposes only . Please manage your risk and position sizing wisely.
Avoid large quantities at once – it’s always better to scale in gradually once the range confirms.

COALINDIA-buy for 10 % move bullish points visible on Coal India Ltd (NSE: COALINDIA) 4H chart:
1. Breakout and Retest
Price broke out above a consolidation zone (marked as 1. breakout).
It later came back and successfully retested the breakout level (point 2), confirming it as support.
2. Positive Divergence
The RSI shows higher lows while price made equal/lower lows (point 3).
This indicates bullish divergence → momentum is shifting upward despite price weakness.
3. Moving Average Signals
Inside bar above 18 EMA (point 4): This shows strength and trend continuation potential.
Price action is currently defending the 200 EMA (point 6), meaning the long-term trend support is holding.
4. Bullish Candlestick Patterns
Bullish engulfing bar (point 5): A strong reversal candle pattern after consolidation.
Inside bar breakout above EMA: Suggests accumulation before an upward push.
5. Flag Pattern
After the bullish engulfing bar, price formed a flag pattern near the 200 EMA (point 6).
Flags are typically continuation patterns, suggesting further upside.
6. Volume Support
On the retest and engulfing bar, volumes are elevated, confirming genuine buying interest.
✅ Summary:
Breakout + successful retests
Positive divergence
Bullish engulfing + inside bar above EMA
Price holding above 200 EMA with a flag pattern
All these are strong bullish confluences pointing to potential continuation toward the marked target zone (~₹429).

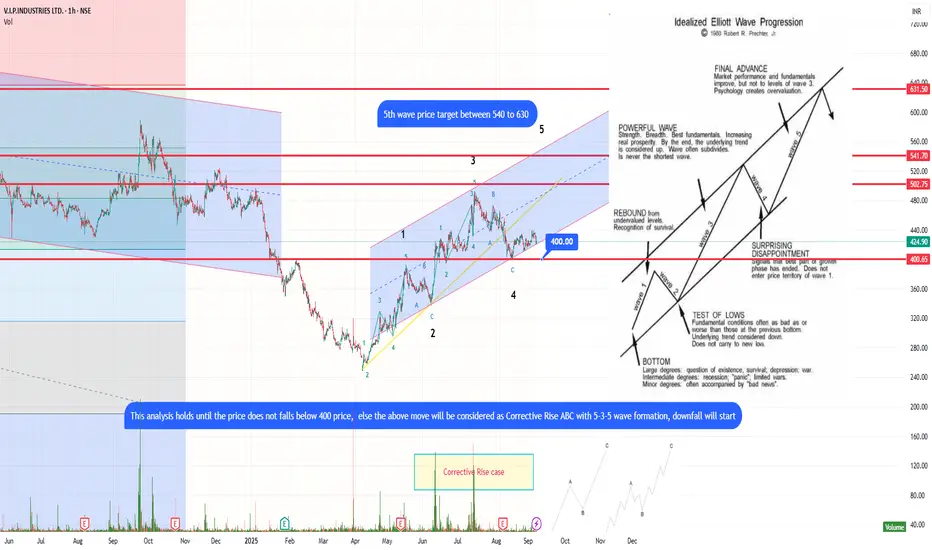
VIPIND UPMOVE Classic Elliott wave VIPIND UPMOVE Classic Elliott wave
Idealised Elliott wave in progression Wave 4 completed, 5th wave projected target between 540 to 630 price.
This analysis holds valid till price does not fall below price 400, else the move will be considered as corrective rise ABC with 5-3-5 wave formation, further correction will come prices will fall.
Let's wait and watch.
Trade with due deligence.
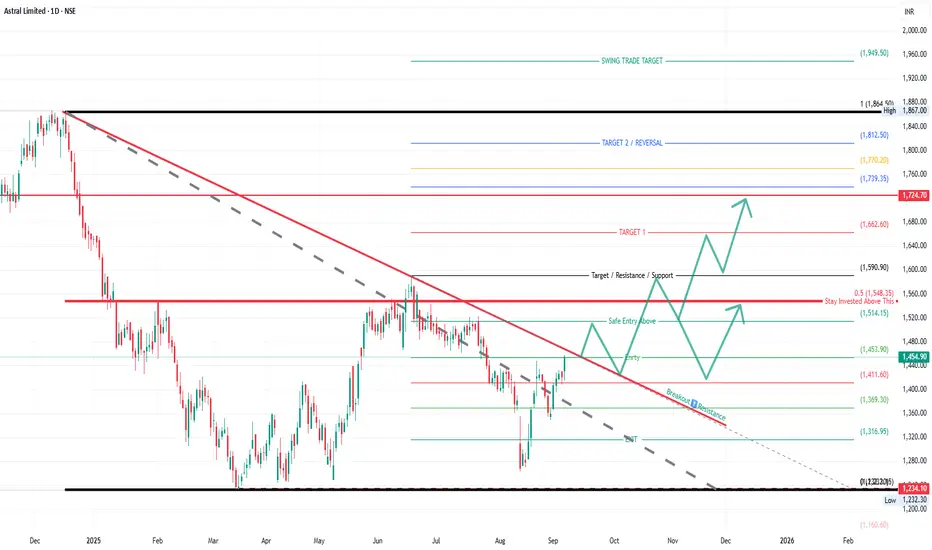
Astral Ltd – Trendline Breakout & Upside TargetsAstral Ltd has broken out of a long-term falling trendline, indicating a potential shift from bearish to bullish momentum. Price is trading above the safe entry level of ₹1,453 and holding strong. Sustaining above ₹1,514 may confirm further upside targets.
📌 Key Technical Highlights:
Pattern: Downtrend Breakout
Safe Entry: Above ₹1,453
Stay Invested Above: ₹1,514
Resistance turned Support: ₹1,590
Volume strength will be key for confirmation
🎯 Upside Target Levels:
Target 1: ₹1,662
Target 2: ₹1,724
Target 3 (Reversal Zone): ₹1,770 – ₹1,812
Swing Target: ₹1,949
⚠️ Downside Risk Levels (if breakout fails):
₹1,411
₹1,369
₹1,316
₹1,234
📈 Strategy Outlook:
A positional buying opportunity emerges above the breakout zone. Traders may consider entering above ₹1,453 with a stop-loss below ₹1,411. Holding above ₹1,514 adds confidence for higher upside targets.
Disclaimer:
This analysis is for educational purposes only and not financial advice. Do your own research before trading or investing.
Motherson Sumi Wiring - Double Bottom & Head & Shoulder PatternMotherson Sumi Wiring is looking for a 50% jump from current price. Following are the factors:
Technical Analysis:
1. On weekly time frame, it is making a Double Bottom Pattern
2. On Weekly time frame it is making a Head & Shoulder Pattern
3. A confluence point along with strong weekly candle will take this price upwards
Fundamental Analysis:
1. Strong player in harness wiring
2. Supplying in top 10 automobile models - auto sector is in strong uptrend
3. New factories - Haryana, Pune and Gujarat - already clocked 200cr from these green field projects
A must in your portfolio.
Keep following @Cleaneasycharts as we provide "Right Stocks at Right Time at Right Price"
Cheers!!

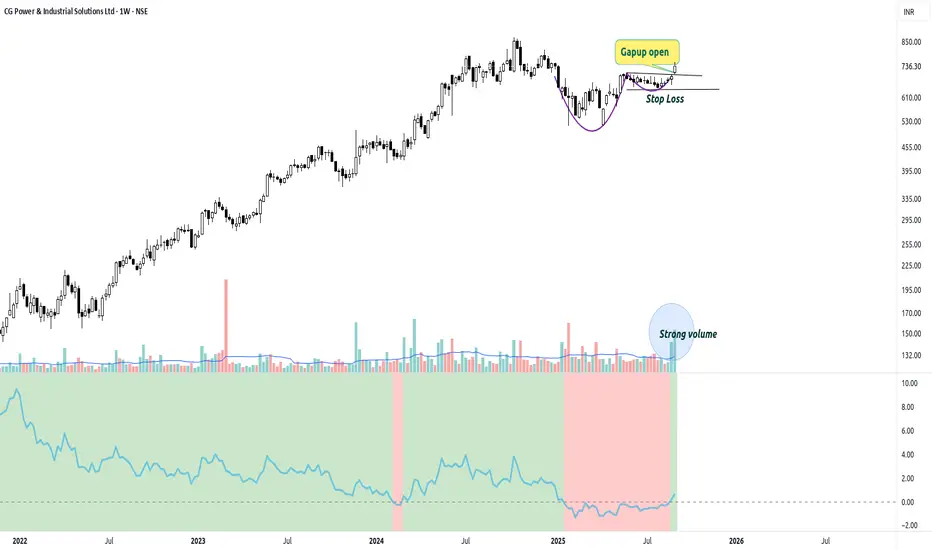
G Power – Weekly Breakout with Gap-Up and Strong VolumeTechnical View:
Stock has given a decisive breakout on the weekly chart, accompanied by a gap-up opening, which adds conviction.
Volume spike indicates strong institutional demand backing the move.
Relative strength vs Nifty has turned positive, showing clear outperformance compared to the broader market.
The chart also shows a rounded base formation before the breakout, signaling accumulation.
Immediate support zone can be considered around ₹610 (stop-loss reference), while sustaining above ₹700–720 keeps momentum intact.
Market Context:
Power and industrial stocks are seeing strong inflows as capex and infrastructure cycles accelerate in India.
CG Power’s strong breakout highlights it as one of the sector leaders to watch.
Conclusion:
CG Power is displaying technical strength with volume confirmation. If momentum sustains, the stock has potential to deliver strong returns in the medium term.
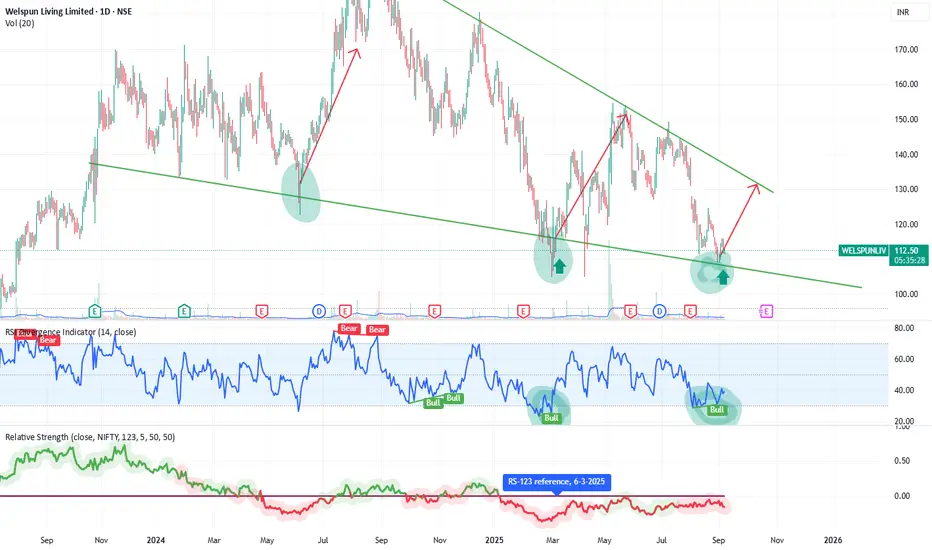
Welspun Living – Bullish Reversal | Swing Trade SetupWelspun Living (NSE: WELSPUNLIV) is showing a potential bullish reversal after bouncing off a long-term descending trendline support. This level has previously triggered strong upward swings.
The chart also shows a bullish RSI divergence, indicating waning selling momentum. A breakout above immediate resistance (~₹115–₹117) could lead to a swing move towards ₹125–₹130.
Key support lies at ₹105. Watch for volume confirmation and RSI strength for entry validation. 📈
Please note : This chart reflects my analysis only—not a trading recommendation. Always conduct your own research before acting and consider your risk tolerance. You’re responsible for your own investment decisions.
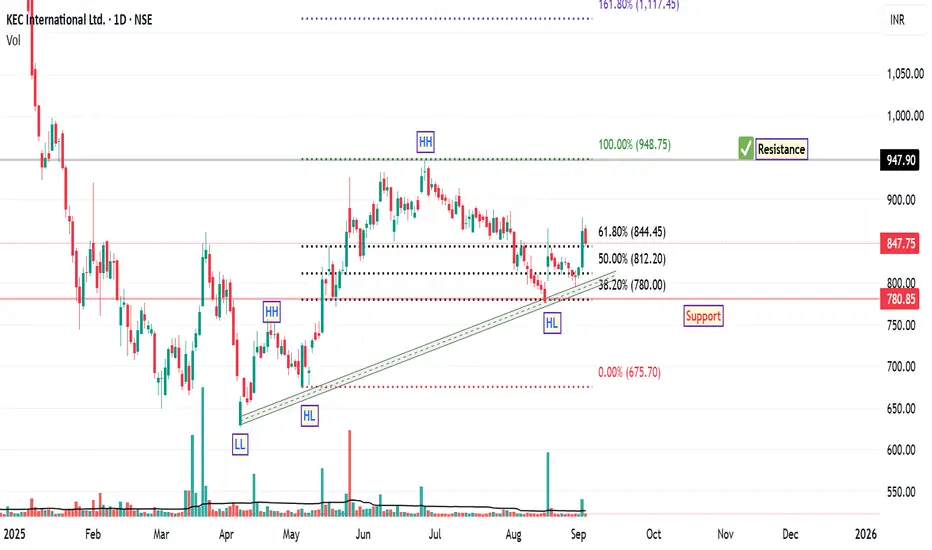
KEC International: Bullish Structure with StrengthSince April 7th, the price structure of KEC International has demonstrated a notable bullish trend reversal, characterized by the formation of higher highs and higher lows along an ascending trendline. This pattern is often interpreted by technical analysts as a sign of strengthening upward momentum.
A recent Fibonacci retracement, drawn from the swing low to the swing high of the current rally, revealed a pullback to the 38.2% level—a zone commonly viewed as a potential support area within a prevailing uptrend. The stock responded positively to this level, rebounding and subsequently closing above the 61.8% retracement level, which is another key technical threshold.
Interestingly, the price has retested the 61.8% level and held firm, suggesting that this area may be acting as a support base. Additionally, the stock has managed to close above its 200-day EMA, a long-term trend indicator that many market participants use to assess broader directional bias. A sustained position above the 200 EMA is generally considered constructive from a trend-following perspective.
From a structural standpoint, based on current chart dynamics, the next potential resistance zone appears to be near ₹948, while the suggested support level is around ₹780 . These levels are derived from historical price action and technical confluence zones, and may serve as reference points for monitoring future price behaviour.
Disclaimer: This analysis is intended solely for educational and informational purposes. It does not constitute investment advice or a recommendation to buy, sell, or hold any financial instrument. Market conditions are subject to change, and trading decisions should be made based on individual research, risk assessment, and consultation with a licensed financial advisor.
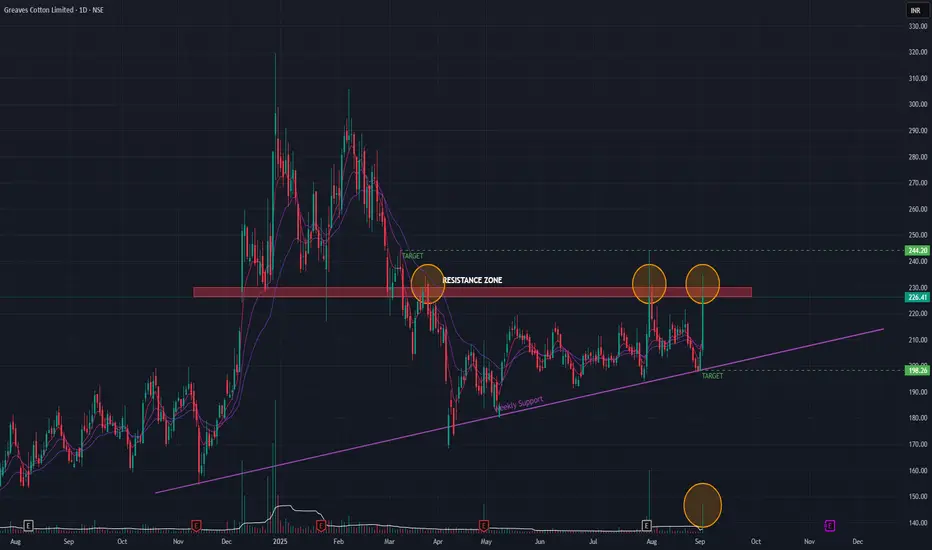
Greaves Cotton (Daily Timeframe) - Will it BreakOut or Not?Greaves Cotton since it's Double-Top formation has been in a downtrend. A key support level has become a resistance zone, which it's been trying to BreakOut few times. The stock has been forming Higher Lows for a while now. Few attempts to BreakOut has been futile. The recent BreakOut attempts been with huge volume spikes. Short-term EMAs are in positive cross-over state.
If it's able to BreakOut then the possible upside target is around 244. If not, we can expect the stock to go down to 198 levels.
Keep monitoring.
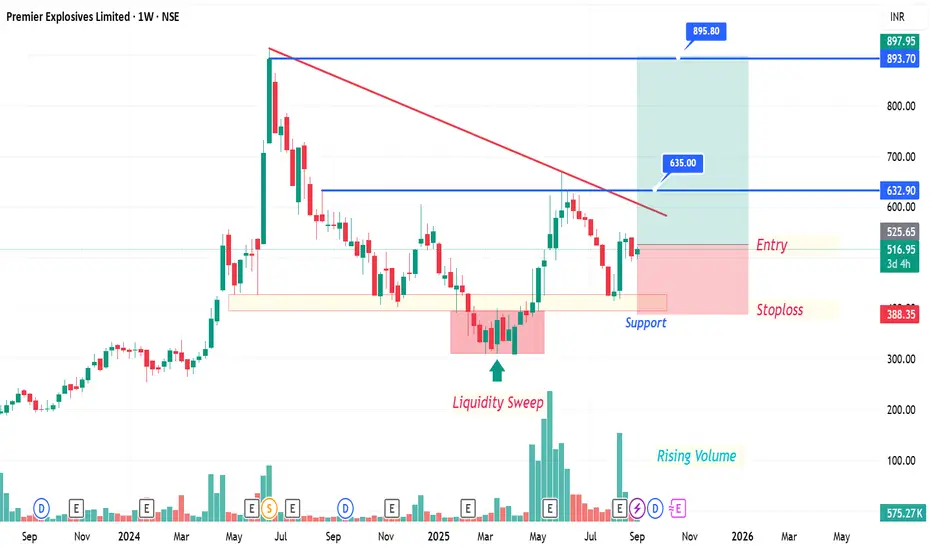
Premier Explosives Limited (NSE: PREMIER) Analysis -1WWeekly Chart Analysis
✅ Support Zone: Strong base around ₹388–400 held well with a liquidity sweep.
📈 Rising Volumes: Indicating accumulation and strong buying interest.
🔻 Downtrend Line: Stock approaching breakout zone near ₹632–635.
📌 Entry Zone: Around ₹517–525 (current levels).
⛔ Stoploss: ₹388 (below liquidity sweep & support).
🎯 Targets:
Target 1: ₹635 (trendline breakout + resistance zone)
Target 2: ₹895 (major upside potential once breakout sustains)
⚖️ Risk-Reward: Favorable setup with strong upside vs limited downside.
📌 Trading Plan
Enter near current levels or on dips to ₹510–520.
Keep SL at ₹388 (weekly closing basis).
First profit booking at ₹635, ride further towards ₹895 if momentum sustains.
#PremierExplosives #SwingTrade #WeeklyChart #BreakoutSetup #VolumeAnalysis #TrendlineBreak #LongSetup #RiskReward #NSEStocks #TradingView
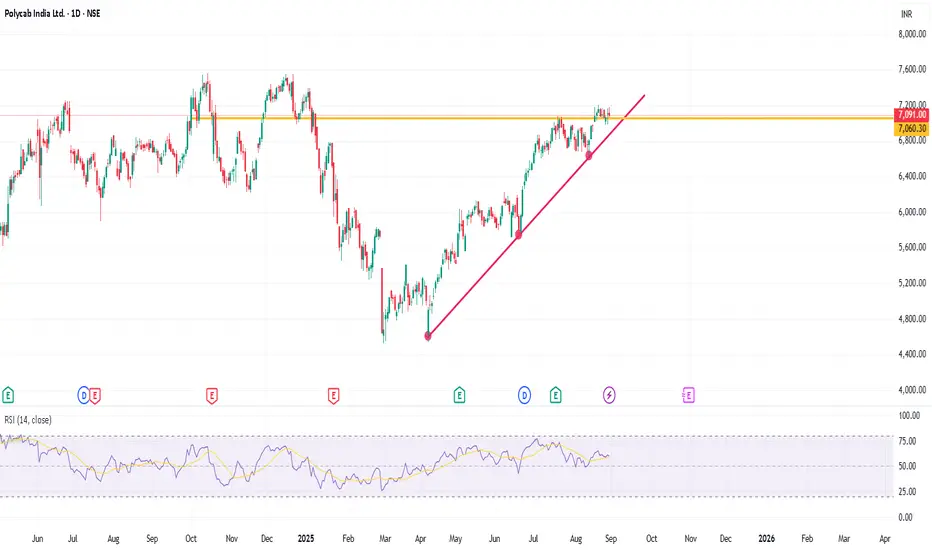
POLYCABThis analysis is intended solely for educational purposes and does not constitute financial advice.
Polycab is showing gradual bullish momentum, supported by a trendline reversal and trading above a key support level. The stock is currently in a minor consolidation phase, which may signal accumulation before a potential breakout.
Given the technical setup, there's a high probability of continued upward movement. However, to manage risk effectively, it's essential to use a stop-loss strategy.