Analysis of Eigen / Tether (EIGEN/USDT) 1-Day ChartHistorical Trend: The chart shows the price movement of Eigen / Tether (EIGEN/USDT) on a 1-day timeframe from November 2024 to June 2025. The price followed a prolonged downtrend, defined by a descending trendline, from late 2024 until a recent reversal.
Key Levels:
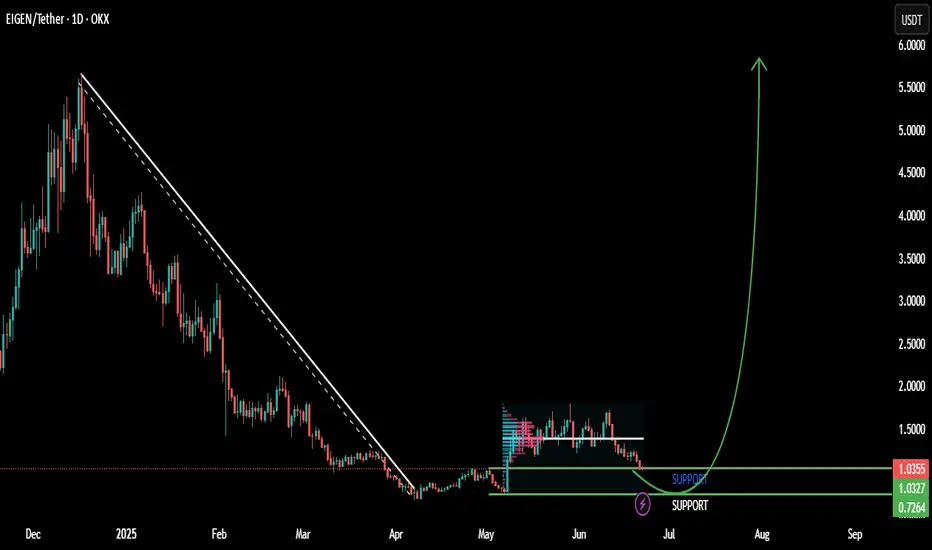
Support: The $1.034 and $0.761 levels (green lines) have acted as significant support zones. The price recently bounced from around $0.761, indicating strong buying interest at this level.
Resistance: The upward projection (green arrow) suggests potential resistance around $6,000, though no specific resistance line is marked yet.
Recent Price Action: After hitting a low near $0.761 in mid-2025, the price broke above the downtrend line, signaling a potential trend reversal. This breakout was followed by a sharp upward move, suggesting a shift to bullish momentum.
Projected Movement: The upward projection indicates the price could target levels as high as $6,000 if the bullish trend continues. The initial support at $1.034 and $0.761 will be critical to hold to sustain this momentum.
Volume and Indicators: The chart includes Bollinger Bands (O1.0362 H1.0591 L1.014 C1.0304) with a -0.0047 (-0.45%) change, indicating low volatility at the recent low. The breakout suggests increasing buying volume, though specific volume data is not detailed.
Outlook: The trend line breakout and sharp upward move indicate a strong bullish reversal. Maintaining above $1.034 is key for the uptrend to continue. A failure to hold this level could see the price retest $0.761 support. Watch for confirmation of sustained momentum toward higher resistance levels.