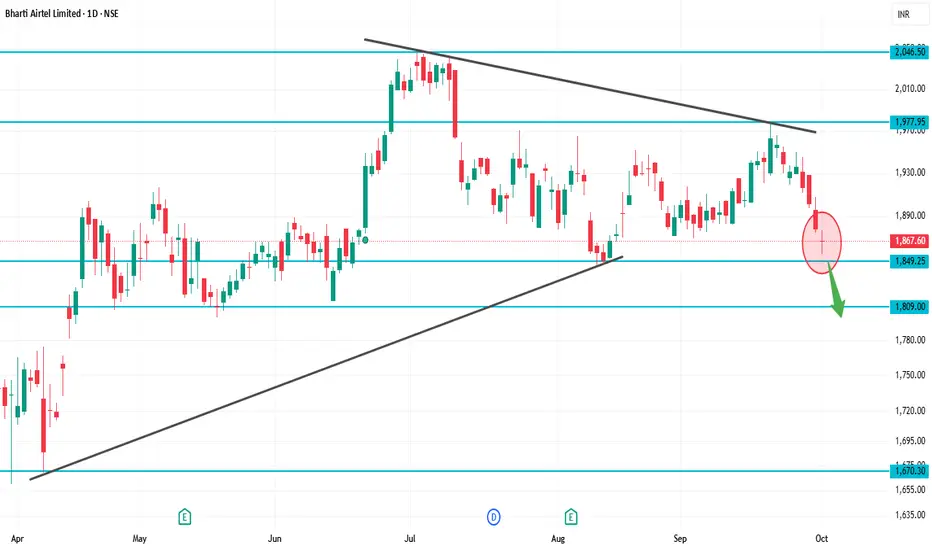
BHARTIARTL 1D Time frameCurrent Price: ~₹1,867
52-Week High: ~₹2,045
52-Week Low: ~₹1,511
Explanation
At ₹1,867, Airtel is just above immediate support (₹1,840–1,850).
If buyers hold this support, stock may bounce back toward ₹1,900+.
But if ₹1,840 breaks, then downside may open toward ₹1,800–1,750.
For bulls, a clean breakout above ₹1,920–2,000 is needed for fresh rally.
Electricvehicles
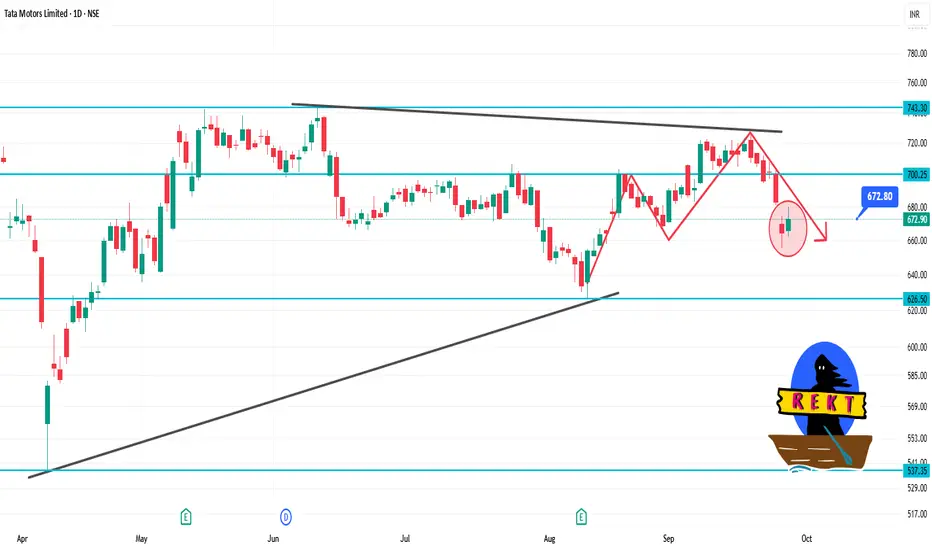
TATAMOTORS 1D Time frameCurrent Price: ₹673.00
Day's Range: ₹662.35 – ₹680.35
Previous Close: ₹664.30
Volume: 15,780,434 shares traded
Market Cap: ₹247,780 crore
52-Week High: ₹1,000.40
52-Week Low: ₹535.75
Face Value: ₹2.00
Beta: 1.30
🧾 Financial Highlights
P/E Ratio (TTM): 11.69
P/B Ratio: 0.00
EPS (TTM): ₹57.54
Dividend Yield: 0.89%
ROE: 28.1%
Book Value: ₹315
📈 Technical Insights
Trend: The stock has shown resilience with strong long-term performance over three years, despite recent challenges compared to the Sensex.
Support Levels: ₹662.35, ₹650.00
Resistance Levels: ₹680.35, ₹700.00
📌 Key Takeaways
Recent Performance: Tata Motors' shares rose over 2% today, snapping a two-day decline, following the announcement that Jaguar Land Rover (JLR) had commenced a phased restart of its operations after a cyberattack.
Analyst Sentiment: Despite recent volatility, Tata Motors remains a top pick among analysts for long-term investment.
SENSEX 1D Time frame📉 Current Market Snapshot
Closing Price: ₹81,904.70
Day's Range: ₹81,641.38 – ₹81,992.85
52-Week High: ₹85,978.25
52-Week Low: ₹71,425.01
Previous Close: ₹81,548.73
Market Cap: ₹1,63,02,221 crore
P/E Ratio: 22.7
Dividend Yield: 1.18%
Price-to-Book Ratio: 4.35
1-Year Return: +0.47%
5-Year Return: +16.1%
10-Year Return: +12.2%
All-Time High: ₹85,978.25 (Sep 2024)
VWAP: ₹81,758.95
Volume: 12,856,963 shares
ATR (14): ₹5.72

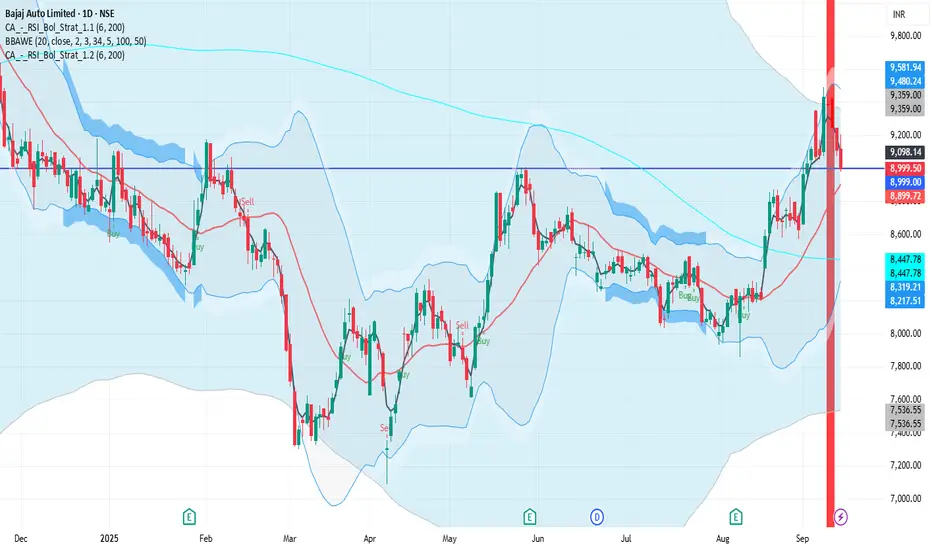
BAJAJ_AUTO 1D Time frame📉 Current Market Snapshot
Previous Close: ₹9,113.50
Today's Range: ₹8,979.50 – ₹9,205.00
Current Price: ₹8,999.50
Market Cap: ₹2,51,318 crore
P/E Ratio: 33.1
Dividend Yield: 2.33%
52-Week High: ₹12,774
52-Week Low: ₹7,089.35
ASIANPAINT 1D Time frame📍 Current Price
₹2,546.30 (closing price)
Short-Term Outlook
Bullish Scenario: A sustained move above ₹2,587.40 could lead to a test of the 52-week high around ₹3,394.90.
Bearish Scenario: A drop below ₹2,505.00 may signal a potential pullback toward ₹2,400.

OLA Baloon is BrustLast 2 Days rally of the Ola Share Today is brust the price is going to up because of the strong PR and company is giving the strong guidense of the Upcoming days, but as per the fundamental of company and result is not showing this, this company is currently in the loss making, company is loss market share and high competition this share is major concern,
Now but this all things is discount in the price, if you are sure this company us survive this situation you can buy for the long term, But short term this give pain for the portfolio

BYD Company Limited (BYDDY) AnalysisCompany Overview:
BYD Company Limited OTC:BYDDY is a Chinese EV and battery manufacturing leader, investing CNY 100B to dominate the intelligent EV market with AI-driven systems and advanced driver assistance—offered at no extra cost to consumers.
Key Catalysts:
Product Expansion & Global Reach 🌍
2024 saw the launch of flagship EV models across multiple segments.
New market entries in Colombia and Oman are accelerating international sales.
Vertical Integration Advantage 🏭
BYD’s fully integrated supply chain covers everything from battery production to final assembly.
This enables cost control, rapid innovation, and resilience against supply chain disruptions.
AI & Smart Mobility Leadership 🤖
Intelligent vehicle systems enhance driving experience and safety.
Strategic investment positions BYD as a global disruptor in next-gen mobility.
Investment Outlook:
Bullish Case: We are bullish on BYDDY above $12.00–$13.00, supported by global expansion, vertical integration, and AI-driven innovation.
Upside Potential: Price target: $20.00–$22.00, reflecting market share gains and technological leadership.
📢 BYD—Driving the Future with AI, Global Reach, and Vertical Strength. #BYD #EVs #ElectricVehicles #AI #Batteries

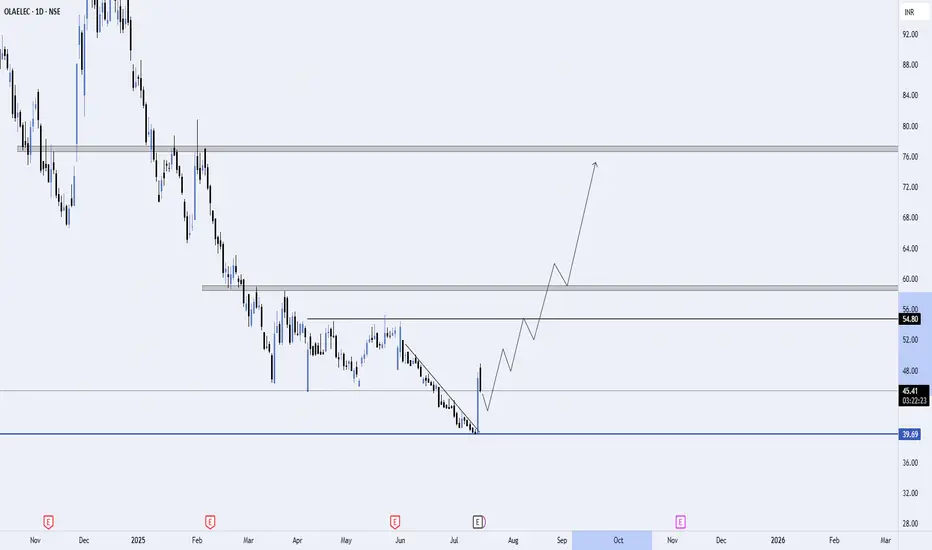
Potential 30% Upside on OLA – Breakout from Downtrend📈 Analysis Overview:
After an extended downtrend, OLA has finally broken out of the descending resistance line with strong bullish momentum. Price action has respected the major support zone around ₹39.69, which has acted as a key demand area in the past.
✅ Key Levels to Watch:
Support: ₹39.69 (strong base)
Intermediate Resistance: ₹45.44 (current retest area)
Targets: ₹54.80 and ₹58.36
Potential Upside: ~31% from current levels
📊 Trade Plan:
Entry Zone: Around current price action, ideally after a minor pullback/retest of the breakout trendline.
First Target: ₹54.80
Final Target: ₹58.36
Stop Loss: Below ₹39.00 to maintain good risk-reward
📈 Rationale:
Clear breakout after prolonged selling pressure
Strong support confirmation near ₹39.69
Volume expansion signals possible accumulation phase
Technical projection shows a potential ~30% upside within the next 3–4 weeks
📝 Note:
This is a swing trade idea based on technical structure. Always manage risk and adapt to market conditions.
Tesla (Tsla) Long Swing Idea Weekly timeframe is bullish
Daily timeframe is bullish
4HR timeframe is bullish
50ema is adding confluence

Aether, the new era EV stockAether's recent incident was very unhuman and tragic. The incident dragged the stock to 778 i.e. around 25% down. A bad news of a good company is an opportunity for the value investors to buy the stock at attractive valuation and so is with Aether. Nothing wrong with company and strong demand and quarter to come. RSI also has reversed from 24.
CMP 794
Target 880/940/1050/1120/ATH
Can be accumulated till 750 with SL of 730 for ST and 704-700 for long term investors.
Kindly note that I am not a SEBI registered analyst. Perform your own analysis before taking any trade.

OLECTRAOLECTRA is in a small range and currently moving for a POLE & FLAG pattern. Expect another rally in coming months.
NOTE: I'm not a SEBI REG. Study before you make investment.

Hero motors-Green days ahead?Hero motors stock has formed a cup and handle pattern from past 4 years.
A breakout of this pattern will unlock new highs for the stock.
From investment POV, stock offers attractive dividend yield of more than 3% at CMP.
Some ratios from fundamental analysis are:
D/E is almost 0
ROCE>20%
ROE>15%
PE is 20 at CMP
For trading purposes, stock is risky considering broader markets are at lifetime high.
Best buy level is anywhere close to 2930-2950 with SL of 2700 DCB.
Targets are 3300 and above that stock can fly to ATH if market supports.
IDEA SHARED ONLY FOR EDUCATIONAL PURPOSES.

Greaves Cotton ready for the uptrend!🤩💸🔥Buy Greaves Cotton for Positional Trading as well as Investment.💸🔥💸
Comment your views‼️😄
.
💡Key triggers for future price-performance:
1) Transformation strategy to increase E-mobility and new-initiatives business share to drive long term growth and help transform and de-risk its business.
2) Consolidation of manufacturing operations into Megasites to bring higher operational efficiencies and reduced fixed costs in the long run.
.
✔️ Technically & Fundamentally Strong💪💪
The company recently posted a Good Q3 Result.
.
💎@technofunda_trader
Few Important rules from my Trading Philosophy:
1. Don't compromise on the quality of stock.
2. Buy right, Sit tight- Only sell in loss if the fundamentals deteriorate, problems arise in management or any other similar issues.
3. Don't invest more than 5-7% in any stock & more than 25% in any particular or related sector. If stock is risky don't invest more than 2-3%.
4. Build position gradually as the stock rises.
5. Trade in the direction of the bigger trend.
6. Ride the trend, don't sell your winners early.
.
Like, Comment & Share 😄😄😄

EXIDE INDUSTRIES - A stock for long termEvery long term perspective needs a fundamental reason. For Exide Industries, the emergence of EVs can be the driver. Do some research and you will know ;)


Carborundum on resistance area#carboruniv
#carborundum
Keep an eye on weekly closing.
Any good green candle on weekly close will trigger long entry.
Stock is beneficiary of EV theme.
#vr

Olectra greenrtech strong moves#olectra
#olectragreentech
A strong bull run and now accumulation going on.
Volumes falling below average!!
Took support at 20DEMA
Safe can enter at breakout.
Risky can add now or 750.
If 750 breaks, 700 is a strong support.
#vr
Kindly DYOR

JBMA - Rounding Bottom EV in demand!!
JBMA majorly in to bus manufacturing which is constantly getting orders from Govt. this transition shall help this stock to reach higher Revenues and higher stock price.
Target : 1000++

Tata Motors - Daily Chart Analysis - 01.12.2021TATA MOTORS as per daily chart analysis has come back to its consolidation zone and as such its ADR NYSE showing 5.11% up is good news for the stock to move up tomorrow. So i think the bulls are doing their best to keep the momentum up. So lets see how the expiry day ends.

Tata Motors - Daily Chart Analysis - 25.11.2021Tata Motors as per daily chart analysis today it had formed an inside bar candle and the market on the expiry day did well and the momentum should continue tomorrow. The stock is expected to move up.And once it breaks 525 level expected target 550-600.

Tata Motors - Daily Chart Analysis - 23.11.2021Tata Motors as per the chart patten analysis is in brief consolidation and once the resistance 525 level is broken then target 550 is achievable. So far the stock had tried to break this level twice and there might be a third attempt and if it sustains above 525 level then its a consolidation break out or it might retrace and in the 4th attempt it can break. More the stock consolidates and tries to hit the resistance level the more the chances the stock will touch 600 level too. Iam already holding the stocks and wish you all a very happy trading.

TATA MOTORS- Buy after the breakoutTata motors is showing a good flag pattern and I'm long on the share. I've been holding it since October with enough profits already. And I'm still very optimistic on the share. However, for people wanting to enter now I would say they should not rush. Wait for a clear break out of the highest line shown on my chart. This is where the price is on right now. But as you can see this has been an area of resistance in the past. So to make sure you are not entering into a whipsaw, please wait for a clear breakout with good volume from this point. And let it trade there for sometime. Once you get that breakout, I would say a target of 650 would seem pretty modest. And if this proves to be a whipsaw, just buy at 500 and then at 475 if it falls further and then sit back and wait for that wonderful breakout. As shown in the chart, 475 is a very good support.
Thank you, hope this was helpful.

MARUTI SUZUKI INDIA LIMITED-THE POTENTIAL BEAST TO RISE?India's largest automobile manufacturer is seen to have factored in all sorts of negative news inflows relating to low production volumes ,semi conductor shortage, global rise in raw material prices, sky rocketing fuel prices and lots more.The beast had given a breakout from a triangle pattern with a successful retest and looks as it would continue the upside rally. Maruti is seen approaching its multi time tested strong hurdle zone of 7700-7900, a closing above 8000 on a weekly timeframe will make the people square off their short positions in the markets and will bring in fresh buyers in the system. Aggressive traders can enter after the weekly closing of 8000 with strict suitable stop losses and the set of defensive traders can enter after 8250 is taken off and after an analysis of the option chain, not exactly but it is forming a structure similar to an inverted head and shoulders, targets to be expected in the medium to long run are 8675-9300-9900. the reason i always say to maintain a strict stop loss is that ;to stay in the game you need your capital and your first aim must be to protect your capital, NEVER RUSH INTO ANY TRADE,WAIT FOR THE ENTRY TO TRIGGER AND THEN RIDE THE TRADE WITH PATIENCE AND CONVICTION
