Wave 4 Trap Complete as Bitcoin Prepares for Final Flush6 Days Ago
3 Days Ago
1 December 2025 :
BTC moved into the expected corrective zone last week but stayed inside the falling channel, showing that wave 4 was only a temporary bounce. Buyers failed to break any key resistance, and momentum kept fading. This kept the broader outlook bearish and hinted that wave 5 was still pending.
BTC has now broken below the short-term rising structure, confirming that wave 4 topped out near the 0.786 retracement. The rejection from that zone triggered a clean shift back into the main downtrend, with price sliding toward the key 86,280 support. As long as BTC holds below the upper channel boundary, the market remains positioned for further downside, with the 1.618 extension around 79,650 emerging as the next probable target for wave 5 completion.
Note:
The rejection from the 0.786–resistance zone shows buyers failed to take control.
Wave B at 86,280 is the immediate pivot level; staying below it keeps downside pressure intact.
The next major target for wave 5 sits near the 1.618 extension around 79,650.
Stay Tuned :)
@Money_Dictators
Eliottwavetheory

Dow Jones Crash - 2026 Analysis (Elliott Wave)DJI Indices crash possible up to minimum 50 to 61.8% starts on Feb - mar 2026 forming leading diagonal pattern 5th wave completed soon last up move around 1000 points only then stars correction so traders and investors go short don't try long at this time

Bitcoin - Elliott Wave Analysis - weekly TFHallo crypto traders bitcoin completed Expanding leading diagonal pattern in grand super cycle degree now in correction phase so wait for long fib ret 61.8% level then big move starts (wave 3)

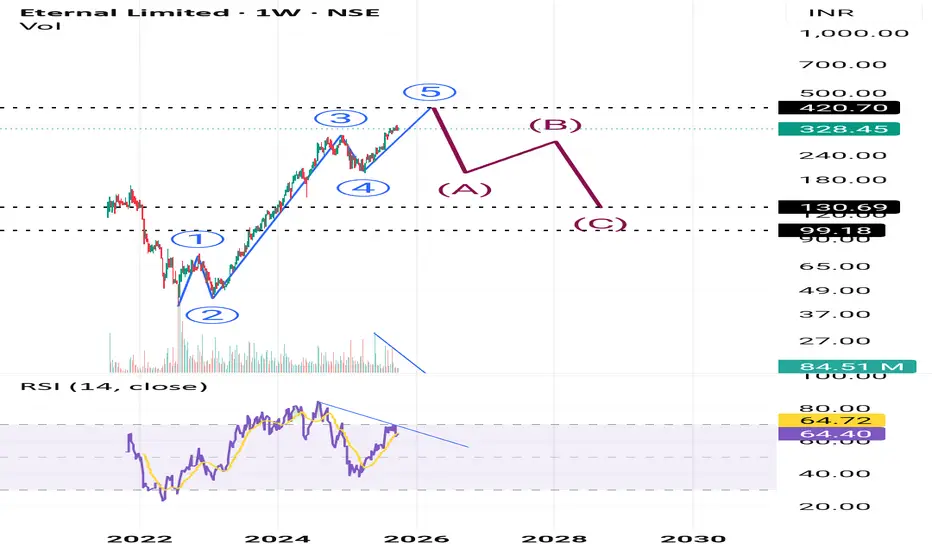
Eternal on weekly time frameAs per Eliott wave theory eternal is going to complete 5 waves impuse move at 420.70 on weekly time frame after that we can expect 70-75% crash as it's going to degree correction on higher frame to the lower mentioned levels.
Nifty 50: Genuine Rally or Selloff Setup?The Nifty 50 Index went up, but this upward move was likely just a temporary correction, not the start of a new, long-term rise.
Bottom (Wave W): The index first hit a low around 24,377
Bounce (Wave X): It then went up to a high near 25,448 . This rise was a clear, three-part corrective move (like an ABC pattern) that stayed inside a rising channel .
Clue: Because the move from the bottom (W) to the peak (X) was corrective, it suggests the overall trend is still bearish (downward).
Points to look at:
1. Reversal: The index is currently around 24,836 and is starting to turn down from the top of that rising channel. This suggests the temporary rise is over.
2. Projected Drop (Wave Y): The main prediction is a significant drop (Wave Y) that will likely break the previous low of 24,377 .
3. Target: This decline is expected to head toward the lower blue trendline on the chart, completing a larger WXY corrective pattern.
4. Projection: Ending point of wave (Y) can act as the ride for the new impulse cycle.
5. Bearish Stance: Traders should be cautiously bearish (expecting the price to fall).
6. Price action perspective: Previous swing is bearish, better to look at short positions for safe entry.
7. Selling Opportunities: Any small upward movements (retracements) are seen as good selling opportunities (betting on the price going down), as long as the price doesn't break above the recent highs or the channel ceiling.24,300 is indeed a strong demand zone.
Stay tuned!
Money Dictators :)

Perfect example of Higher highs and higher lows STRUCTURE -Chennai petro chem. Weekly analysis
Price is near about very Strong support
HH & HL formation l

$MONG USDT looking moon MEXC:MONGUSDT looking juicy like $OMNOM which did 100x is $MONG another 100-1000x inti the horizon?


Nifty 50 chartNifty 50 chart. IN this chart we clearly see that market is completed 4th wave .
Last wave is about to complete in some days after that we can see some Bearish move..

Elliott Wave Corrective Wave Theory- DYDX to $28 soon! Hi traders, pl. refer to the above chart for knowing how Elliott Wave Correction Theory is currently forming up on DYDX. Some pointers-
* DYDX has stopped forming new lows rather forming equivalent lows which shows end of an impulse downside move.
* We see huge volume expansion showing the interest of people
* We see RSI bullish exaggerated divergence meaning the Price is forming flatter bottoms but the RSI looks bullish as it forms lower highs.
* We have entered wave A
HODL

Ultratech Cement On final push then fall aheadUltratech Cement had stellar rally from 2900 to 8000+ looks to be heading max 8532 which is max possible upside for it as wave 5.
Then a corrective wave will start towards 6300 which is 0.382 fibonacci levels.
Notice MACD Negative Divergence price making higher high and MACD higher lows.
DISCLAIMER:There is no guarantee of profits nor exceptions from losses.
Technical analysis provided on the chart is solely the personal views of my research.
You are advised to rely on your own judgments while taking any investing/Trading decisions.
Past performance is not an indicator of future returns. Investment/trading is subject to market risks.
Seek help of your financial advisors before investing/trading.
Not recommended to take FnO positions based on this analysis
I may or may not trade this analysis.

NSE Eicher motors price will drive upward moreIntraday traders and short-term investors can buy nearby sub-wave 4 of wave (3). NSE Eicher motors are making waves ((5)). We may see the following targets soon: 3005 - 3146 - 3223 - 3292
Invalidation: Wave 4 can never Exceed the starting point of wave 1.
Sub-wave 4 can't touch sub-wave 1 of wave (3).
If you have any queries or concerns, don't hesitate to ask me using below comment box or DM me.


Reliance Level AnalysisReliance is moving short...Target zones are marked based on eliott wave analysis


Bank nifty Intraday Update for 03-01-2021As you can see on chart we have completed wave (3)
After that we are in correction zone of wave (4), in which we are going from point A to Point B
Most like point B or wave B is near completion after that you will see a sideways move which i represent on chart as point C

Bank Nifty daily viewThis is the daliy chart of bank nifty
Currently we have finished (3) wave and playing in wave (4)
after this you will see an another movement till failure of that wave

Nifty 50 Levels for 24-Dec-20Nifty Eliott Wave analysis but being it an expiry expect some more volatility. Time may vary but support and Resistance levels are valid

NIFTY: Very near to the endIf the level of 10800 was a wave 4 , then nifty should not cross the level of 13800. As per the elliottwave principle wave 3 cannot not be the shortest among wave 1, wave 3 and wave 5. One should start shorting nifty near that zone keeping sl of 13900

ELLIOT WAVE ANALYSIS!!DOWNTREND is started,it will make three waves, 2 waves up & medial wave down as a correction !
Then it has chances to follow the down trend!
This analysis is for EDUCATIONAL & INTELLIGENCE pourpose,trade at your own risk!

Voltas: Bullish as long as it holds 617Buy Voltas on the dips with stoploss of 617 for the targets of 670/690/710

USDCAD- case of Ending diagonalVery soon there will be a trend reversal in the pair USDCAD. The current price structure is forming an ending diagonal which is going to complete the long term corrective wave A-B-C started in the month of march. The another reason for expecting a trend reversal is the bottom formation of dollar index, which clearly suggests that major reversal going to take place. Important levels are 1.30800 as the last & Above: 1.32400 reversal confirmation.
