Bank Nifty – Head & Shoulders Breakdown AnalysisPattern: Head & Shoulders
Status: Neckline breakdown confirmed
Elliott Wave Position: End of Wave 5, beginning corrective wave.
Indicators: Bearish RSI + MACD divergence
Indicators Supporting the Breakdown
🟣 RSI Divergence
Clear bearish divergence between price (higher highs) and RSI (lower highs).
RSI now breaking mid-level (50), confirming shift from bullish → neutral → bearish momentum.
🔵 MACD Structure
MACD shows multiple negative divergences during right shoulder formation.
Bearish crossover already done.
Histogram contracting further indicates strengthening downside momentum.
Expected corrective move → ABC decline to at least Wave 4 price territory.
Wave 4 region sits around 57,500 – 58,000, matching H&S target
Trend Bias: Short-term bearish until retest of neckline or completion of A-wave drop.
Elliottwaveanalyis

Elliott Wave Analysis of Auto Sector CNXAutoIn (ii) of 3rd
(ii) almost complete
(iii) up should follow after this
On monthly chart, this is 5th wave

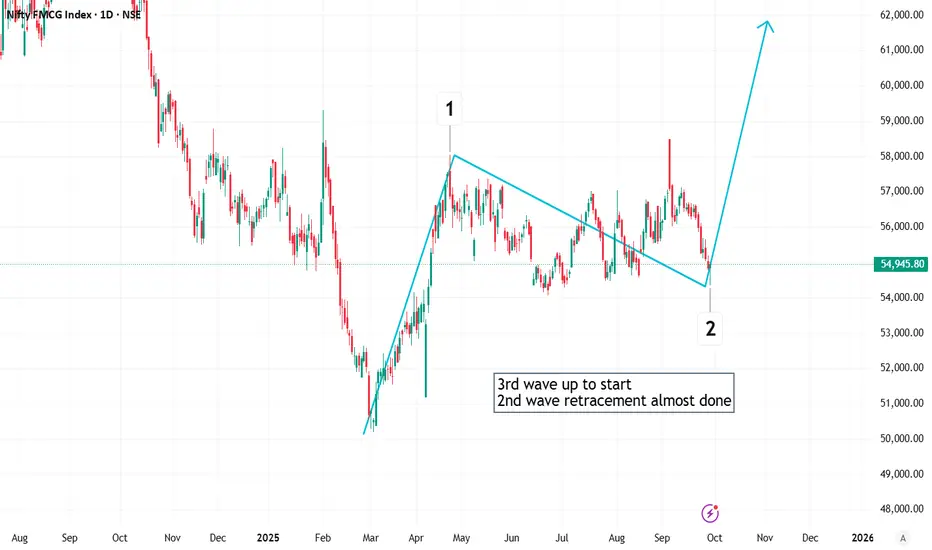
Elliott Wave Analysis of FMCG Sector CNXFMCG3rd wave up to start
2nd wave retracement almost done
This might be one of the sectors leading the next bull run.
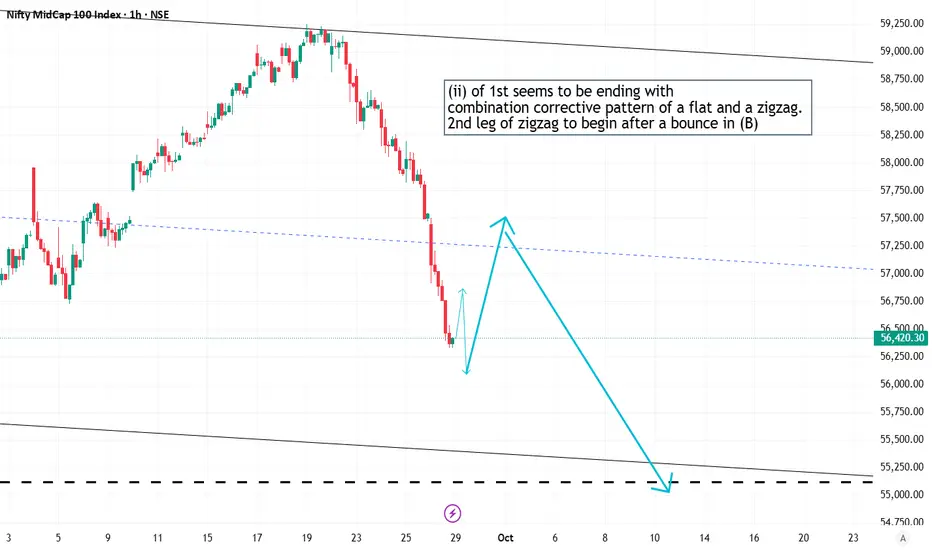
Elliott Wave Analysis Nifty Midcap 100 _ CNXMIDCAP100(ii) of 1st seems to be ending with
combination corrective pattern of a flat and a zigzag.
2nd leg of zigzag to begin after a bounce in (B)
That means the meeting/decision on rate cut might lead to "Buy the rumour and sell the news" incident for the markets.
Elliott Wave Analysis of POWERGRIDApparently, (ii) wave formed a triangle corrective pattern and touched 50% retracement level.
This might be followed by a wave (iii). 3rd waves in early stages are usually difficult to confirm, so needs to be followed up.

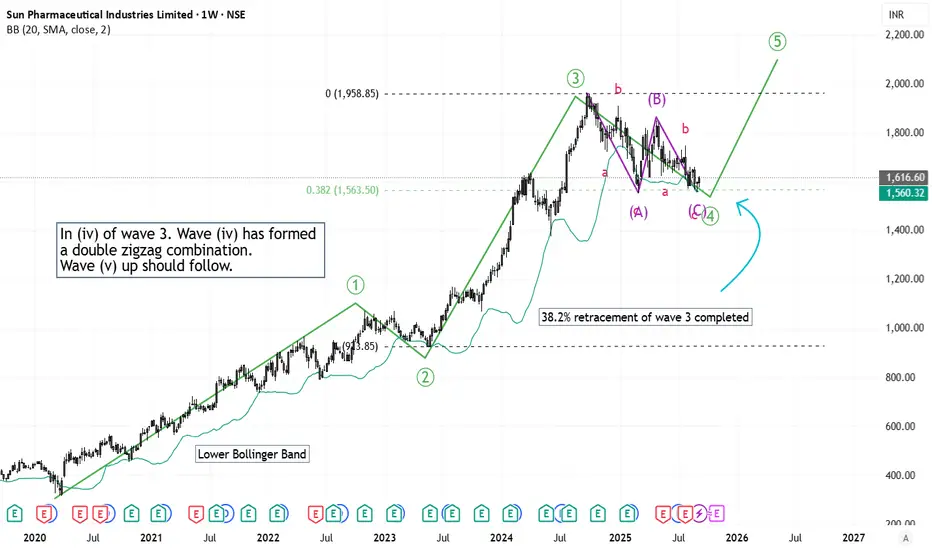
Elliott Wave Analysis of SUNPHARMAIn (iv) of wave 3. Wave (iv) has formed a double zigzag combination retracement pattern. The 38.2% retracement level has been completed. The script is bullish now for many months, upto a year or so.
Elliott Wave Analysis of Bharat Electronics BELThis is 15 15-minute chart. That means, wave (v) can be completed within a few days. The script is in wave (iv) on 15 min chart.

Elliott Wave Analysis of Ashapura Minechem ASHAPURMINThe script is currently in wave (iv) on 15 min chart. 5th wave should in place on 10th of September to complete 3rd wave of a V on daily chart.

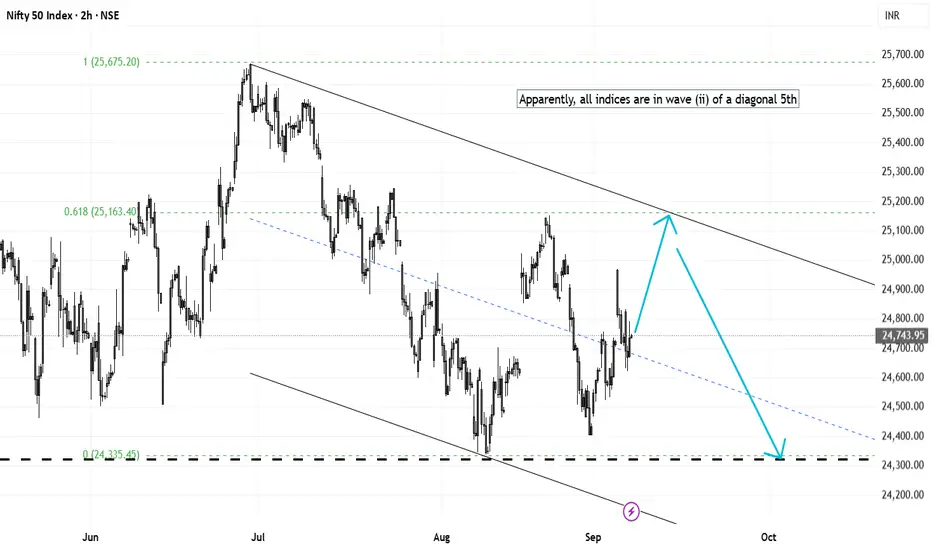
Elliott Wave Analysis of NIFTY 50 IndexThis is to be tracked on daily basis and the counts may change. But for now, for all the indices to be in (ii) wave retracement of a diagonal 5th is a good possibility.
Elliott Wave Analysis of NIFTY Midcap 100 CNXMIDCAPThis is to be tracked on daily basis and the counts may change. But for now, for all the indices to be in (ii) wave retracement of a diagonal 5th is a good possibility.

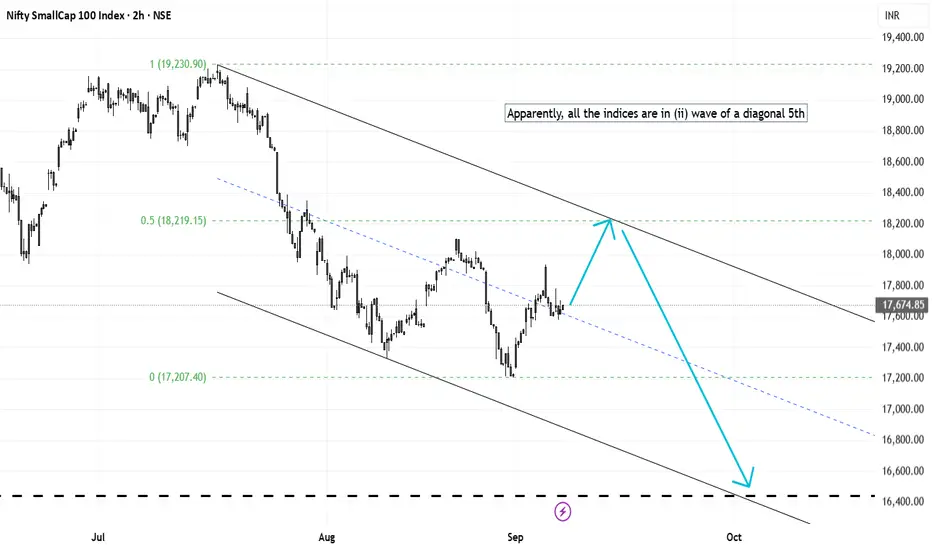
Elliott Wave Analysis of NIFTY Small Cap 100 CNXSMALLCAPThis is to be tracked on daily basis and the counts may change. But for now, for all the indices to be in (ii) wave retracement of a diagonal 5th is a good possibility.
Elliott Wave Analysis of Bharat Electronics BELThe script is currently completing its wave 4 on daily chart and retracement level of 38.2% has been achieved. Wave 5 up should follow next.

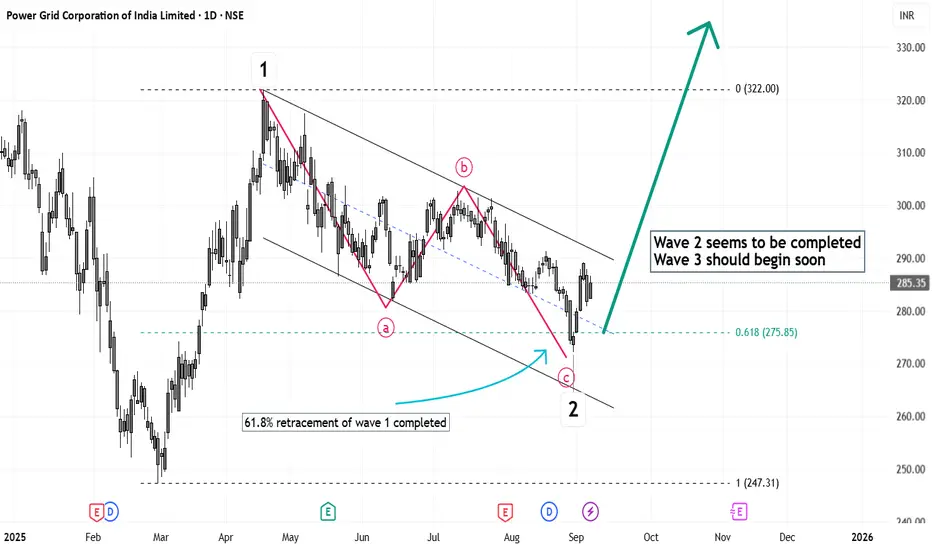
Elliott Wave Analysis of Power Grid Corporation POWERGRIDThe script has completed ABC correction of wave 1 on the daily chart, and apparently beginning wave 3 up from here on.
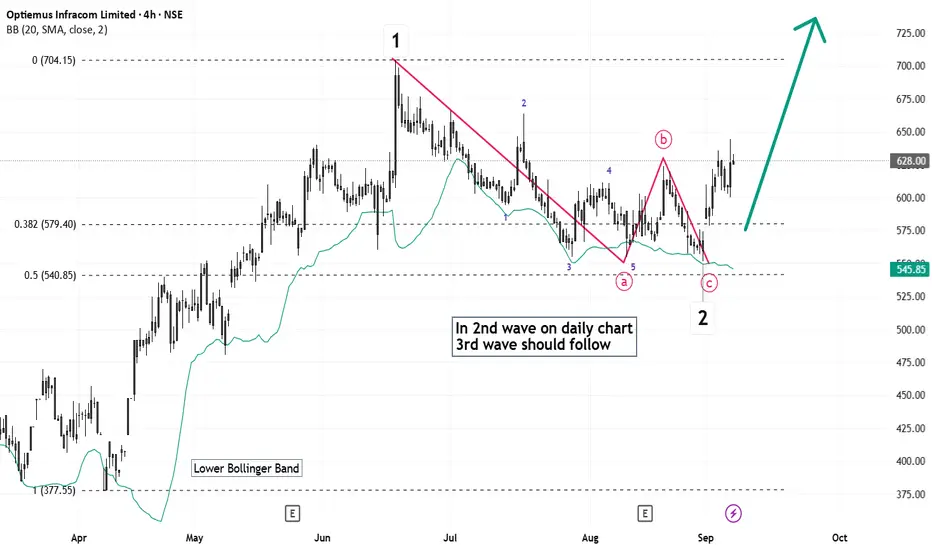
Elliott Wave Analysis of Optiemus Infracom OPTIEMUSThe script is completing 2nd wave on daily chart, at around 0.5% retracement level. This should be followed by 3rd wave. Wave (i) of 3rd wave seems to be ongoing.
Elliott Wave Analysis of Eveready Industries EVEREADYThe script has completed 2nd wave on weekly chart and is advancing in (i) of 3rd wave.
The 2nd wave appears to be a complex correction of a combination of triangle and flat corrective patterns.

Elliott Wave Analysis of Jai Corp JAICORPLTDThe script appears to be in wave 4 of C wave, and the 5th wave up should complete this part of impulse soon.

Elliott Wave Analysis of Western Carriers WCILThe 5 waves impulse in 1st is about to complete. This may be followed by a retracement before 3rd wave starts.

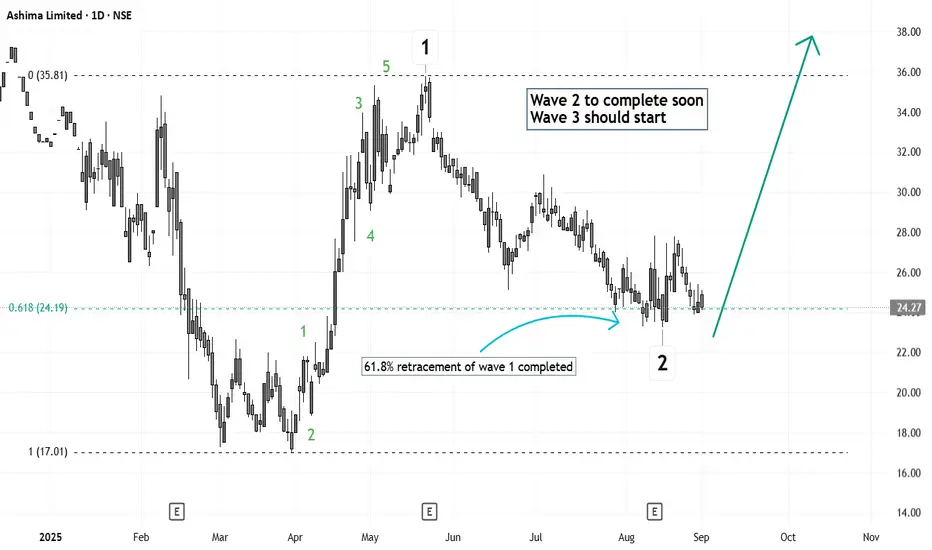
Elliott Wave Analysis of Ashima Ltd ASHIMASYNThe script is probably in a corrective wave which is about to complete soon and an impulse wave up might be the next. The retracement has completed 61.8% retracement.
Elliott Wave Analysis of Raghav Productivity Enhancers RPEL The script appears to be in currently wave 2 on daily chart which is almost complete and wave 3 up should follow from here.

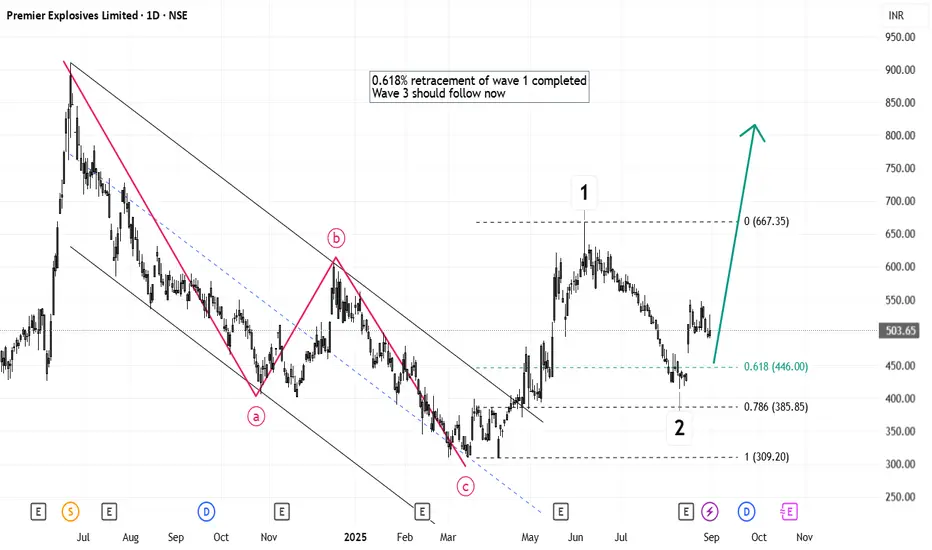
Elliott Wave Analysis of Premier Explosives PREMEXPLNThe script seems to have completed the wave 2 retracement with around 0.618% retracement and the 3rd wave up should follow from here.
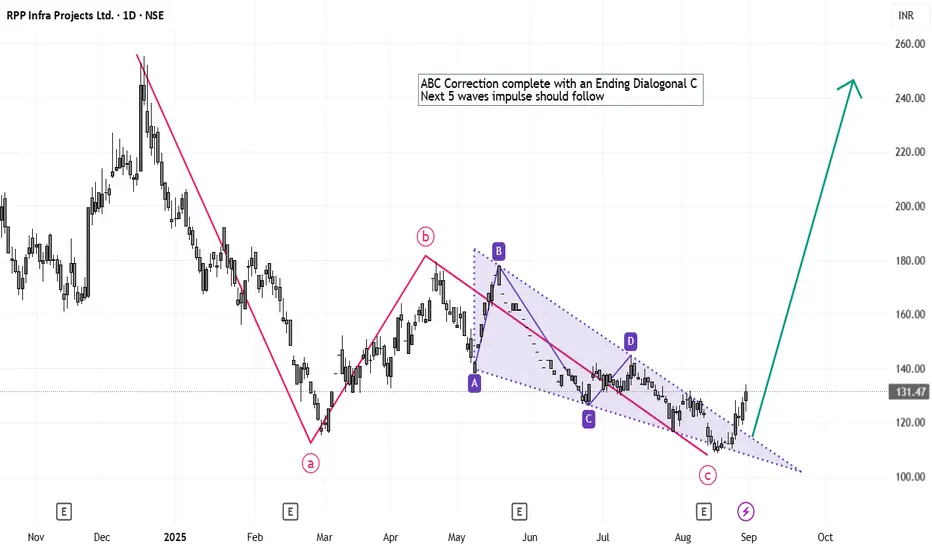
Elliott Wave Analysis of RPP Infra Projects RPPINFRAThe script appears to have completed ABC correction on weekly chart and the next 5 waves should follow after this.
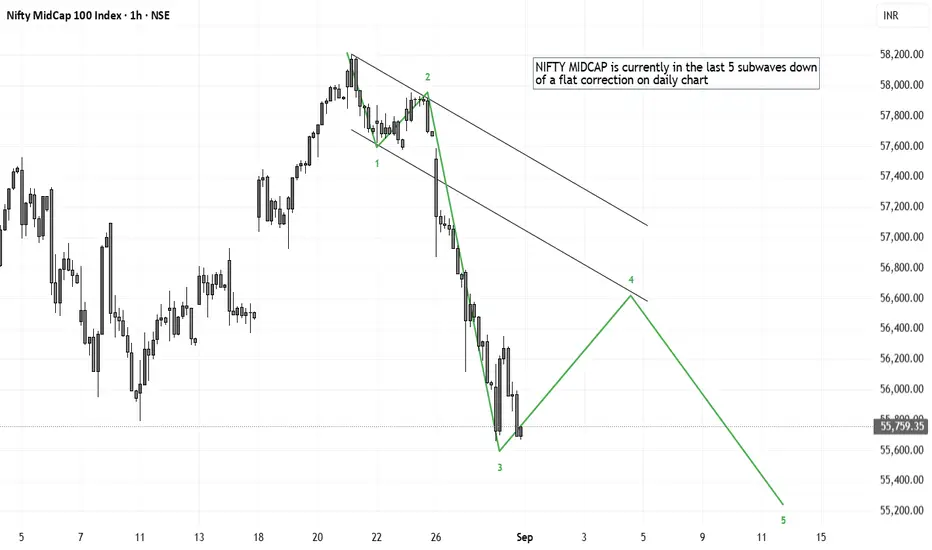
Elliott Wave Analysis of NIFTY MIDCAP 100 CNXMIDCAPThe waves marked on the chart are only indicative of direction and not prediction of targets or timelines.
Currently, NIFTY MIDCAP 100 seems to be in 3rd of C wave down. This should complete the correction after all these 5 sub-waves are done.
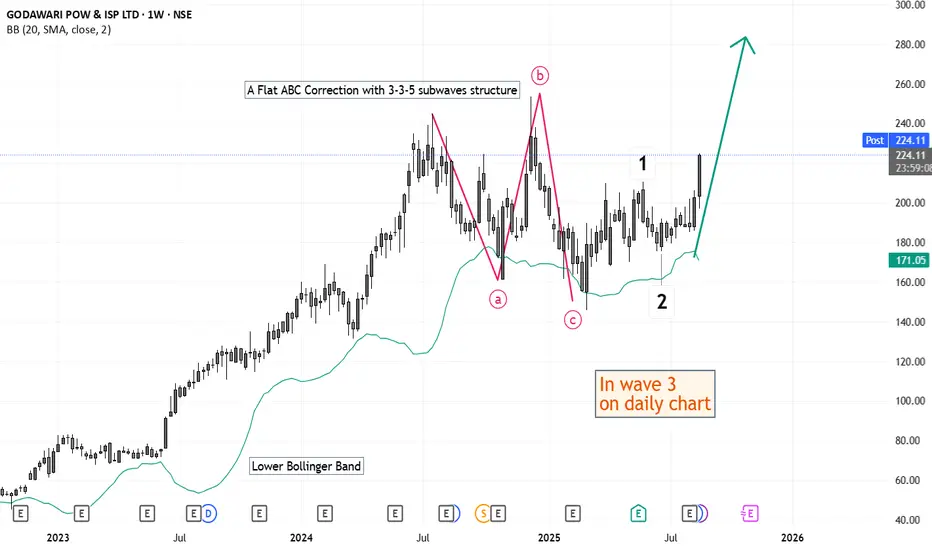
Elliott Wave Analysis of Godawari Power And Ispat GPILThe script is currently in a 5 wave impulse upside after completing a flat 3-3-5 correction. This impulse is supposed to make a higher high. On daily chart, in a 3rd wave.