BPCL - #LongSide => Series Of Ones & Twos. . . Be Ready !!!Great Setup With Great Risk To Reward Ratio. . . NSE:BPCL
Elliottwaveprojection

GBPUSD: long for corrective wave 2Analysis mentioned on the chart. As long as the support holds , the pair should move up for a corrective move as wave 2 .

Nifty- Channel Support At 11085 (Bounce Expected)Last Price- 11050 / 11:27 Hrs / 22nd Sep 2020
Hope You Enjoyed The Last Crack from the Tops of 11600 to 11085 . Some relief can be expected until it holds the channel support at 11085 -day low so far.
Stops Below 11085
Target - 11190 / 11250 / 11325
-------------------------------------------------------------------------------------------------------------------------
Last Nifty Idea - Catching The Tops at 11600
-------------------------------------------------------------------------------------------------------------------------
---------------------------------------------------------------------------------------------------------------------------

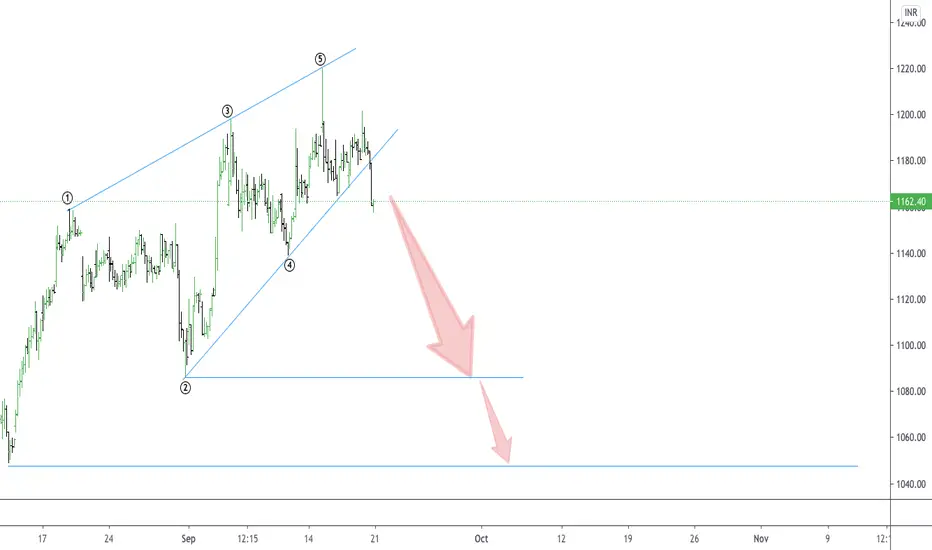
TITAN : CASE OF ENDING DIAGONALThis is the most common diagonal that can be found out at the ending of a main trend or main correction. It consists of all the waves 1-2-3-4-5 in a single or multiple zigzags. They can be found placed at 5th wave of an impulse wave or can been seen as a wave ‘C’ of a corrective waves zigzags or flat. After the termination of the ending diagonal, a swift & a sharp reversal takes place which bring the prices back to the level from where the diagonal began.
Here in the stock of TITAN, this ending diagonal is placed as a wave-C of a corrective move.
As you can see in the chart, this pattern looks like an ending diagonal having wave-1 wave-2 wave-3 wave-4 & wave-5 . Each of these five waves are having an internal structure of three waves. So as per the wave analysis we can say the stock price of TITAN are going to fall . It has been seen that the target level of ending diagonal wave is the origin of the diagonal or the wave 2. So one should see a selling opportunity in this stock & look for the target zone as mentioned in the chart.
XAGUSD - Silver is Ready To Boom !!! :)Currently it is incomplete converging triangle (abcde) and completed combined (wxy) correction. . .

Banknifty final leg of downmove or there is more?DISCLAIMER:There is no guarantee of profits or no exceptions from losses.
Technical analysis provided on the chart is solely the personal views of my research.
You are advised to rely on your own judgments while investing/Trading decisions.
Past performance is not an indicator of future returns. Investment is subject to market risks.
Seek help of your financial advisors before investing/trading.
--------------------------(((((LIKE)))))-------------------------------
Downward impulse wave four iv was sideways double three correction which looks to be completed.
The next move of Banknifty about to be witnessed as wave five v.
This move can take it towards 0.5 Fibonacci retracement 21168 or as per support zone 21404-21027
SL/Invalidation level 22370
Confirmation: Dotted blue line has been broken which was important support line,
Broken down heavily from range 22670-22080

ELLIOT FORECAST FOR 18 SEP 20Analysis based on technical parameters (No Noise)
Nifty is under correction and expect it may continue for next few more sessions as well. For tomorrow what i analyse nifty will be bullish in the first half and subsequently go for correction...
Watch out for important levels...
Assessment only for educational purpose.
Trade as per own risk appetite.

Reliance Elliot Waves, Gap analysis, Head and Shoulders PatternDisclaimer: Just for Study purpose, trading/investing not recommended on this analysis it can be wrong.
Reliance gives classic examples where it shows similar targets with help price action and Elliot waves.
Inverse Head and shoulders breakout target seems to reached
As 3rd Elliot wave is extended 5th Wave should be normal (not extended)
During Run up it created Breakaway Gap, Runaway Gap, Exhaustion Gap

TataSteel LongSide - Fifth is Ready To Go #NSEAfter Long Waiting Period Wave 3rd Of 3rd is Over . . . NSE:TATASTEEL


Hindalco Wave Review (Recent High @ 203) - Final Wave E-ExpectedVideo Idea Shall Have Quick Review
Hindalco
BankNifty
Nifty
----------------------------
Disclaimer
-----------------------------
All investments involve risk, and the past performance of a security, industry, sector, market, financial product, trading strategy, or individual’s trading does not guarantee future results or returns. Investors are fully responsible for any investment decisions they make. Such decisions should be based solely on an evaluation of their financial circumstances, investment objectives, risk tolerance, and liquidity needs.
---------------------------------------------------------------------------------------------------------------------------
Note
For Educational Purpose- not to be considered a buy or sell idea.
---------------------------------------------------------------------------------------------------------------------------

Maruti Suzuki Wave 4 sideways correctionDISCLAIMER:There is no guarantee of profits or no exceptions from losses.
Technical analysis provided on the chart is solely the personal views of my research.
You are advised to rely on your own judgments while investing/Trading decisions.
Past performance is not an indicator of future returns. Investment is subject to market risks.
Seek help of your financial advisors before investing/trading.
--------------------------(((((LIKE)))))-------------------------------
Maruti Suzuki has broken out of Weekly parallel in 17th Aug 2020 week which it formed since 18th Dec 2017 after hitting lifetime high
From march lows we are in ABC correction to weekly parallel channel and We look to have finished wave C or iii.
Wave iv going to be sideways correction till fib 0.236=6700 or 0.382=6300. In case deep correction 0.5=6000.
Stop Loss 7350 which is recent high


ELLIOT FORECAST FOR 15 SEP 20Analysis based on technical parameters(No Noise)
Expecting bearish temperament to continue for tomorrow...Watch out for important levels
Assessment only for educational purpose.
Trade as per own risk appetite.


MGL: case of ending diagonalAs per the current structure it seems the prior correction is going to be completed in 1 0r 2 days. There is a formation of ending diagonal. One should buy the stock in the range of 860-65 keeping the stop loss at 845 for the target of 950 & if it hold then 995.


ALEMBIC: BULLISH Third of third wave has been completed. The stock is ready to give upside rally again after the 4th of 3rd wave completion that can lead the stock to travel into four digits price territory.

