GBP/AUD: Corrective Rally, Downtrend IntactGBP/AUD is trading in a clear bearish Elliott Wave structure on the 4H timeframe. The market has already completed a strong impulsive decline and is currently moving in a Wave 4 corrective pullback, which is happening inside a downward channel and near key Fibonacci retracement levels. This correction looks weak and corrective, suggesting sellers are still in control. As long as price remains below the invalidation level around 2.0050 , the bearish bias stays valid. The expectation is for the correction to finish soon, followed by Wave 5 to the downside, targeting the lower channel area and the 1.96–1.95 zone. Overall, the trend remains bearish, and any short-term bounce is likely a selling opportunity before the next leg lower.
Stay tuned!
@Money_Dictators
Thank you :)
Elliottwaveretracement

USD/CHF Approaching Breakdown from RangeUSD/CHF is moving in a sideways corrective pattern, not a strong trend. The price is forming an A-B-C-D-E structure, which usually happens before the market makes a bigger move. Right now, price is in the last part of this pattern (wave E) and is sitting near a resistance area, where it has failed to move higher and has started to turn down. This behavior often means sellers are becoming stronger. As long as the price stays below 0.795–0.798 , the outlook remains bearish, and the market is expected to move lower toward the 0.782–0.775 support area. If this move happens, it would complete the corrective pattern after a short pause, and then the market can decide its next big direction.
Stay tuned!
@Money_Dictators
Thank you :)

ETHUSD - Are Bears Ready for the Fall?ETHUSD on the 4H timeframe is clearly in a corrective downtrend, not a healthy bullish structure. The price action fits an Elliott Wave decline where wave 3 already completed near 2620 , followed by a weak and overlapping recovery that looks like wave 4. That recovery stayed inside a falling channel and never showed impulsive strength, which already tells you buyers are weak. More importantly, wave 4 is flirting with wave 1 territory, which puts the entire bullish hope on thin ice.
Right now, ETH is at a make or break zone. If this move is just a fake breakdown, price must quickly reclaim the channel and hold above recent highs. If not, then this is likely wave 5 of C, and downside continuation becomes the dominant scenario. The structure favors a final flush toward the 2380 to 2350 area, where wave 5 projection and channel support align. Anyone blindly bullish here is ignoring structure. This is not a buy the dip market, it is a wait for confirmation or respect the downtrend market.

Wave 4 Trap Complete as Bitcoin Prepares for Final Flush6 Days Ago
3 Days Ago
1 December 2025 :
BTC moved into the expected corrective zone last week but stayed inside the falling channel, showing that wave 4 was only a temporary bounce. Buyers failed to break any key resistance, and momentum kept fading. This kept the broader outlook bearish and hinted that wave 5 was still pending.
BTC has now broken below the short-term rising structure, confirming that wave 4 topped out near the 0.786 retracement. The rejection from that zone triggered a clean shift back into the main downtrend, with price sliding toward the key 86,280 support. As long as BTC holds below the upper channel boundary, the market remains positioned for further downside, with the 1.618 extension around 79,650 emerging as the next probable target for wave 5 completion.
Note:
The rejection from the 0.786–resistance zone shows buyers failed to take control.
Wave B at 86,280 is the immediate pivot level; staying below it keeps downside pressure intact.
The next major target for wave 5 sits near the 1.618 extension around 79,650.
Stay Tuned :)
@Money_Dictators

USDCAD - Breakout Will Flip the Trend BullishUSDCAD has been sliding inside a well-defined descending channel, completing a full five-wave drop toward the support zone. The structure from the top looks corrective rather than impulsive. That means the downtrend is weakening as it reaches its final leg.
Your count shows Wave 3 finishing at the dashed red line zone, followed by a small Wave 4 bounce, and now the market is pushing into the last Wave 5. This final drop is expected to target the Fibonacci levels near 1.3915 and 1.3895 . Nothing suggests strength until those levels are tested.
The price is still trapped inside the downward channel, and every bounce has been getting sold. That confirms sellers are still in control for now. Wave (C) is close to completion, but buyers haven’t proven anything yet.
The bullish outlook only becomes valid after a clean breakout above the channel. Without that break, any upside move is just noise inside a bearish structure. The breakout must hold with a higher low to confirm a trend reversal.
If the channel breaks decisively, a strong bullish reversal toward 1.40+ becomes possible. The entire structure suggests the downtrend is aging, so a major upside swing is likely once sellers exhaust. Until then, downside targets remain open and caution is necessary.
Stay Tuned!
@Money_Dictators

BTCUSD - Wave 5 Decline Still Likely AheadPrevious Analysis:
BTC is approaching a critical reaction zone where the current rise looks more like a corrective push than the start of a new trend. Price is moving toward the highlighted supply region, which aligns with a potential wave 4 completion inside the descending channel. The structure from the recent low shows an internal a–b–c formation, suggesting this bounce could run into exhaustion as it enters the red zone. Unless BTC breaks out of the channel with conviction, the broader momentum still leans bearish. A rejection from this region would likely trigger the final wave 5 leg, driving price toward deeper Fibonacci levels and completing the corrective cycle before any meaningful recovery attempt can begin.
Stay Tuned!
@Money_Dictators

BTC Wave 4 Bounce Looks Like a Trap! Is it?BTC is still moving inside a clear corrective channel, with the current bounce likely forming wave 4 before one final drop toward the 1.618 extension near 79,650 . The highlighted red zone shows a potential trap area where price may lure traders into thinking a reversal has started. Until BTC breaks above the channel convincingly, the broader structure still favors a wave 5 decline. The wave count from 1–2–3 supports this final leg down before any major recovery.
Stay Tuned!
@Money_Dictators

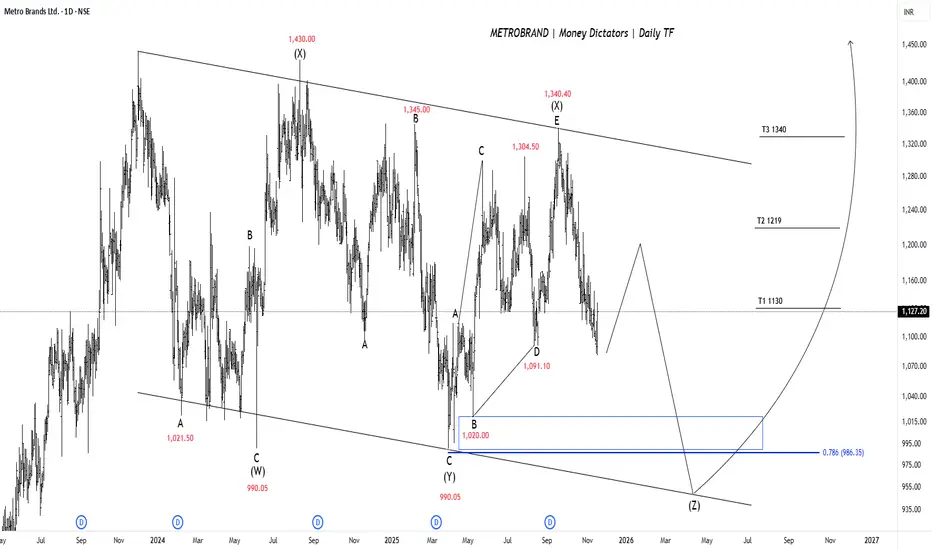
METROBRAND - An Important Case of Final Correction & ImpulseMetrobrand has been trading inside a broad downward-sloping channel for a long time, repeatedly getting rejected from the upper trendline. Each corrective structure appears as part of a complex W-X-Y-X-Z pattern, and currently, the price seems to be completing the final leg (Z). The earlier lows around 990 were tested twice, showing strong support, and now price is recovering from that zone. The recent rise indicates that sellers are losing strength and buyers are slowly stepping in again.
The ideal accumulation range lies between 1,020 and 986 (0.786 retracement), and as long as the stock holds above this zone, the downside risk remains limited. A minor dip or consolidation is still possible in the coming weeks before a stronger uptrend kicks in. Once the price stabilizes and confirms reversal with higher highs and higher lows, we may see momentum building toward the upper resistance.
If the stock sustains above 1,125 and later breaks out of the channel resistance, it has the potential to travel toward 1,245 initially. A successful breakout with volume can trigger a major upside move, extending toward 1,460 or even higher levels. Overall, the risk–reward now tilts in favor of long-term buyers, provided the stock respects the lower support zone near 986 .
Stay Tuned!
@Money_Dictators
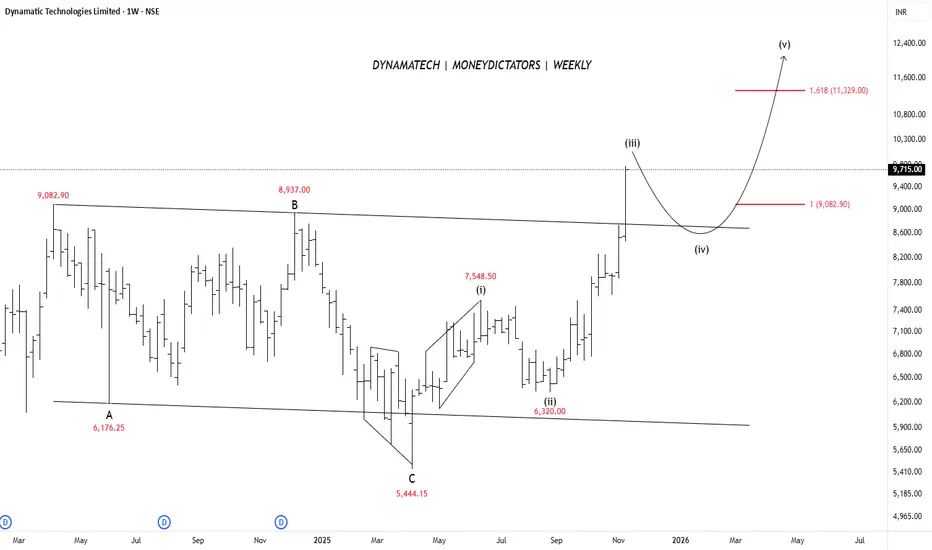
Dynamatech Has Given a Clean Wave Map to the ₹11,300 ZoneDynamatic Technologies has already completed its big A-B-C correction, meaning the downtrend is over. After this, the stock started a fresh upward Elliott Wave cycle, and waves (i), (ii), and (iii) are already complete. This confirms that the stock has entered a new bullish phase.
Right now, the price is moving inside wave (iv), which is a normal and healthy pullback. This corrective move is shallow and smooth, showing that buyers are still in control. The important support for this pullback sits near 9,082 , where the chart also shows a Fibonacci level. Once wave (iv) ends, the chart suggests a strong rise toward wave (v).
Wave (v) usually extends upward, and based on Fibonacci projections, the next major target is around 11,300 . This level is marked by the 1.618 extension, a common ending point for final impulse waves.
Overall, the stock structure looks bullish and clean. The trendline breakout and wave count both suggest the next move is upward. If the price holds above 9,082, the chances of reaching the 11,300 wave (v) target remain strong.
Stay Tuned! :)
@Money_Dictators

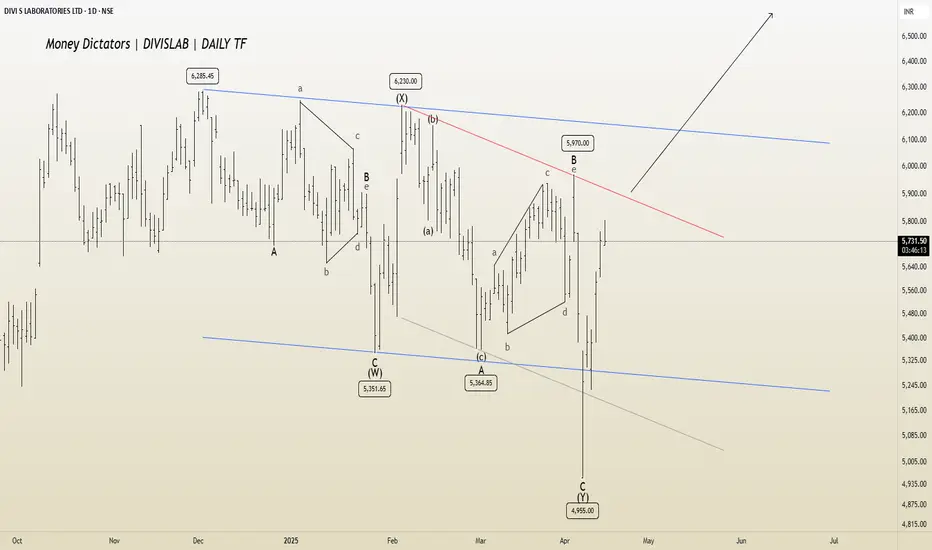
DIVISLAB: Eyeing Breakout from A-B-C Channel Daily TF
DIVISLAB is nearing the completion of a complex W-X-Y corrective pattern. A long position could be considered after a breakout from the A-B-C channel, with potential targets in the 6100–6400 range.
I will update more information soon.
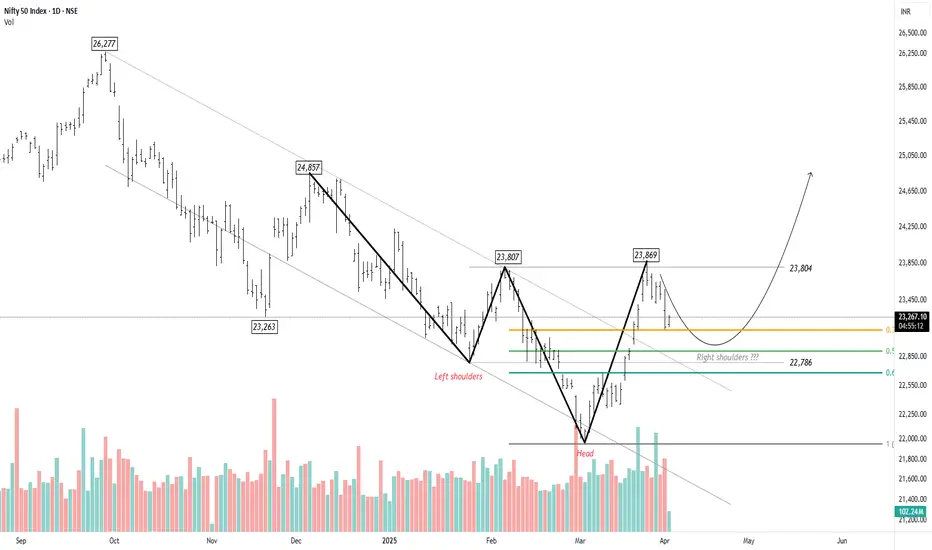
Nifty - Awaiting the Fifth Wave for a BreakoutNifty recently hit a low of 21,905 , marking a key reversal point in the trend. A well-defined Head and Shoulders pattern is emerging, with the right shoulder currently forming. The ongoing pullback has retraced to the 38.2% level, but there is potential for it to extend towards the 50% mark at 22,906 . However, the upward move appears to be losing momentum, with buying interest remaining subdued.
Based on the chart, the head of the pattern signifies the beginning of a new impulse wave. This appears to be the fourth wave within the larger first wave. Once Nifty completes this corrective phase, the fifth wave is expected to present a trading opportunity. If wave equality holds, Nifty could potentially rise to 24,857 .
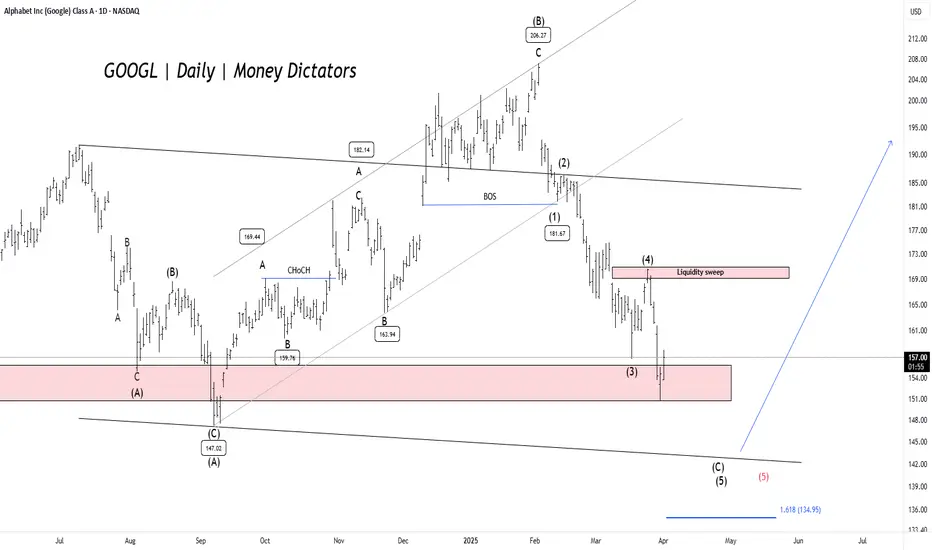
GOOGL - Elliott Wave Final ShowdownGOOGL has dropped over 27.28% , reaching a minor profit-booking zone. The $150 level serves as a key demand zone, where a potential price reversal could occur. The formation is either expanded flat or a running flat on the daily timeframe chart.
Confirmation is best observed near the lower trendline of the parallel channel. If bearish momentum persists, prices may decline further to the $142-$140 range before a strong rebound. Once the correction ends, the upside targets are $168, $180, and $195.
A new low will form if the previous low is breached. Further research will be uploaded soon.
NSE LINDEINDIA – Elliott Wave ProjectionTimeframe: Daily
NSE LINDEINDIA is currently trading below both the 100 and 200 EMAs, indicating a bearish trend. The ATR stands at 232, reflecting low volatility while supporting the ongoing downward movement. The price action has formed a descending channel, with a clear corrective pattern visible within this structure.
The price has completed wave 5 of wave (C) and begun moving upward. A downward value area is visible near the lower band of the descending channel. The price has reached 100% of wave (A), suggesting it has hit the anticipated Fibonacci ratio, indicating a potential correction. To confirm this assumption, the price must break above wave 4 of wave (C) at 6800 . If this breakout occurs, traders can look for the following targets in a long setup: 7500 – 8198 – 8660+.
We will update further information soon.

GUARGUM51! - Key Trends and Price PredictionsOn the NCDEX, guar gum has formed an Elliott Wave cycle, with the final Wave E of Wave (4) approaching completion. A confirmation above Wave D could shift the entire outlook in favor of buyers. From a price action perspective, 9830 serves as a strong support level, while 13,650 acts as a supply zone, both of which have remained significant for over four years. Wave D represents a critical midpoint, ensuring a push toward the upper supply zone once the price sustains above this level or Wave D.
If the price has completed Wave (4) and has broken above Wave D, it is likely to reach the upper boundary of the value area, around 13,650 . However, with the ADX (Average Directional Index) at 17, this suggests a weak trend, indicating that the current price movement lacks strength. If the price closes below the demand zone at 9,830 , it could delay the expected bullish move. Traders should wait for confirmation before entering a long position to ensure a stronger trend.

What's happening in ITC?ITC daily chart: After completion of Normal or Trending Impulse, the price falls.
We can see clearly that the first leg of this fall looks like an impulse (shown by red 1-2-3-4-5), which is wave A of Zig-zag.
Then price retraced to 38.2% forming wave B.
Currently, wave C is developing in ITC. The minimum fall for this is 61.8% extension, which is near the 459 level.
Remember that this is a minimum fall for any Zig-zag pattern.
If the price breaks 459 and starts trading below it, the target of 100%, which is near 438.85, will be achieved. (This also fulfills the Rule of Equality).
This analysis is based on Elliott Wave theory and Fibonacci.
This analysis is for educational purposes only.

BTCUSD: Key Levels and Projections Based on Elliott WavesBTCUSD has formed a corrective pattern on the daily timeframe, identified as a W-X-Y structure with seven distinct waves. The price found support at the 200 EMA, reaching a low of 49,57 7 before bouncing back. The sub-waves within this structure are clearly visible, with wave (1) and wave (2) completing at 62,729 and 52,546 respectively.
Currently, BTCUSD is encountering strong resistance at the upper boundary of the corrective channel, posing a significant challenge for bullish momentum. Although wave (3) has managed to rise above wave (1), it has not yet confirmed a strong bullish breakout. To establish a decisive upward move, wave (3) needs to hold above wave B and breach the upper boundary of the channel. The breakout can help the price to get 100% of the whole correction.
Failure to break out of this resistance zone could result in the corrective structure extending into an X-Z formation, leading to a prolonged consolidation phase. This would suggest more time is needed for the pattern to play out, causing frustration for traders looking for a clear bullish trend.
We will provide further updates to our followers soon.
- Trade technique by KP

SULA BULLISH UPTREND SULA BULLISH, UPTREND may start
After forming impulsive move bigger wave1, having 5th wave extended and has retraced 61.8%.
Thrice tested support at around 61.8%
May rise again for bigger move 3 if there is increase in volume
Elliott wave analysis

Elliot wave analysis of Ashok Leyland.#elliotwaveanalysis #ashokleyland #elliotwave
Based on elliot wave principle , I have done analysis of Ashok Leyland.
Current view : If Stock breaks current resistance it will go till 0.618 level of wave 5 retracement.
Alternate view : IF stock finds resistance at current level then stock may continue consolidation.

JAY SHREE TEA IND Stock is forming head and shoulder, We can see breakout of this stock in upcoming days and stock will try to complete its wave pattern as per corrective ABC pattern we might see 200 and 270 levels in upcoming days. I have make a route of this chart it will try to complete in this form like this
Thanks

ULTRACEMCO - ELLIOT WAVE 5 IN MAKINGHi All,
This idea is about Ultratech Cement
Mkt Cap - 3L Cr
ROE - 12%
ROCE 15.3%
P/BV - 5.56
MktCap/Sales - 4.7
FCF - 2k Cr
Technicals
Price action being published is on a 1 hour TF. As can be seen by the pattern, Elliot waves are in motion. Wave 1 was an impulsive wave followed by Correction wave (Wave 2).
Ideally Wave 2 should correct to 50-60% as per Elliot theory & that is what happened during Wave 2 formation.
Wave 4 corrected again by 30% and point 4 above point 1 which all points to the validation of Elliot theory.
Wave 5 is about to commence which is as per the theory strongest impulse wave.
Cement Sector as a whole is doing well due to boost in infra sector.
Happy Trading,
Thanks,
Stock-n-Shine

SHOPPER STOP 1000 ?Shopper stop is forming a upside wedge pattern with a good consolidation of second wave we can see a good breakout in upcoming days. Price will must need to go above 888 to form this upside wedge pattern
Thanks

Gold H1- Elliot Wave CountingH1 already complete it wave now it looking for correction wave A-B C my target it will hit area 2073 at Fibonacci level 2.16
