Is that an ending diagonal?Can you spot an ending diagonal trying to finish the ABC Zigzag move? If correctly labelled, Nifty may again see a fresh low.
**This is an educational market outlook, not investment advice. Please consult a SEBI-registered advisor before taking any investment decisions.**
Elliott Wave
Nifty - Elliot Wave Counts - Update (Neutral)In our last post we discussed that in short term 25700 is the target and if we cross that, then Leading diagonal gets invalidated and hence we look for much higher levels.
Last post:
Thankfully, we didn't get out in shakeouts and rode the entire move till +25600
Now, unfortunately we did not cross 25700 and hence the chance of Wave 1 or something else ending at 25670 became stronger.
As of now, we are at a place where there is a lot of confusion. I see a 5th up pending in wider indices, but Nifty seems done.
So, is there a possibility that other indices go up, while Nifty just does a pullback as part of the correction and not make a new swing high?
A few charts for reference:
Nifty Smallcap:
Nifty 500:
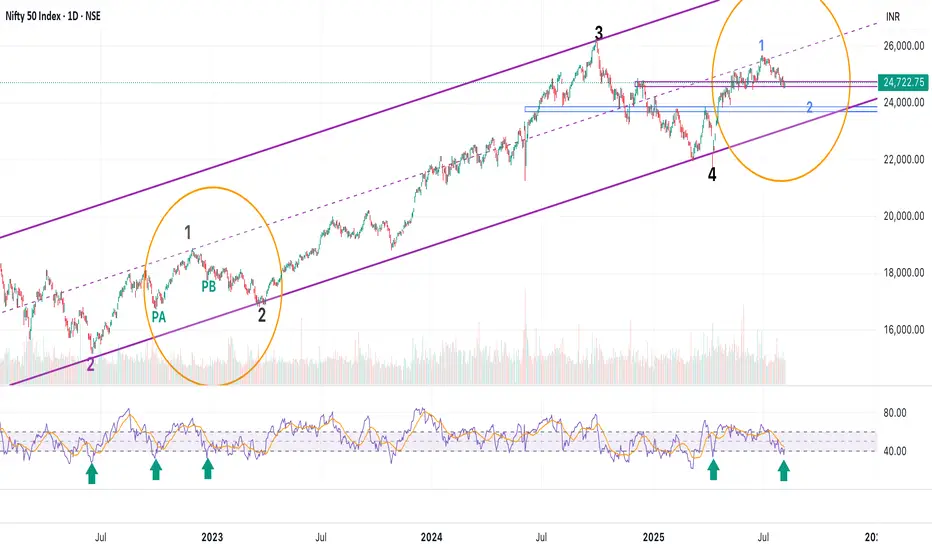
That's about the counts : From other technicals perspective the move looks very similar to Sep 2022 - March 2023 period. But where in that period are we?
PA (point A)Oct 2022 - where one more high till Dec 2022 is left?
or
PB - Feb 2023 - where we just get a pullback and drift lower?
(I have marked green arrows on RSI charts to show the reference)
So, what do we do in such case?
Ditch nifty, play stocks. Lot of stocks looking good - starting 5th up (Just browse through and you'll find many making similar structure as SmallCap index)
(Hint - Defence, Realty, Autos, Metals, Pharma)
All the best!
I will share updates, if I get more clarity on Nifty - till then enjoy the stocks and trade light - remember we are playing seemingly the last leg. :)
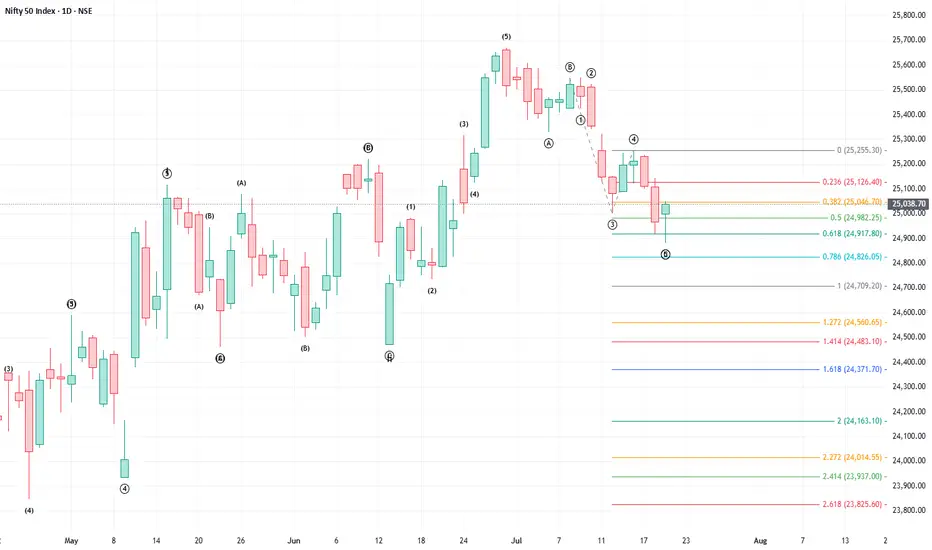
Is Nifty 50 going down and down?What seems to be impulse wave 3, Nifty may see more downfall in the coming week. However, for an alternative count, we may also be in a wave C. But for either scenario, we can observe more downward movement ahead.

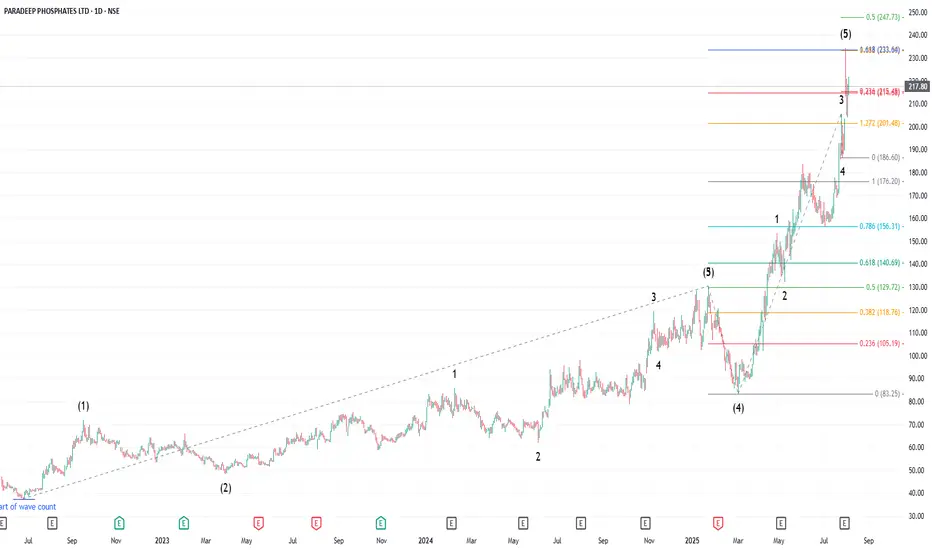
Paradeep Phosphates: Completion of Major Wave (5), Exit
Paradeep Phosphates, part of the Microcap 250, has been a favourite among traders and investors alike. The recent rally has been spectacular—but there are clear signals that this leg may be over.
Wave (4) was completed on March 3, 2025, after which the stock began forming Wave (5).
This final leg saw a classic Wave (5) extension, with sub-wave (1) itself extending—a rare but powerful pattern in Elliott Wave Theory.
From the low of Wave (4), the stock delivered over 180% returns in just 5 months.
Why a Top May Be In
The major wave 5 has now hit the 1.618 Fibonacci extension of wave 0–3 projected from wave 4.
Simultaneously, sub-wave (5) of Wave 5 has also reached the 0.382 fibo extension of wave (0)–(3) to (4).
These dual confluences at key fibo levels increase the probability that a significant top has been formed.
No New Longs – Exit Advised
This is not the time to initiate fresh long positions.
Since the stock is not in the F&O segment, shorting is not an option either.
Traders and investors are advised to exit and wait for a meaningful correction or a new setup to emerge.
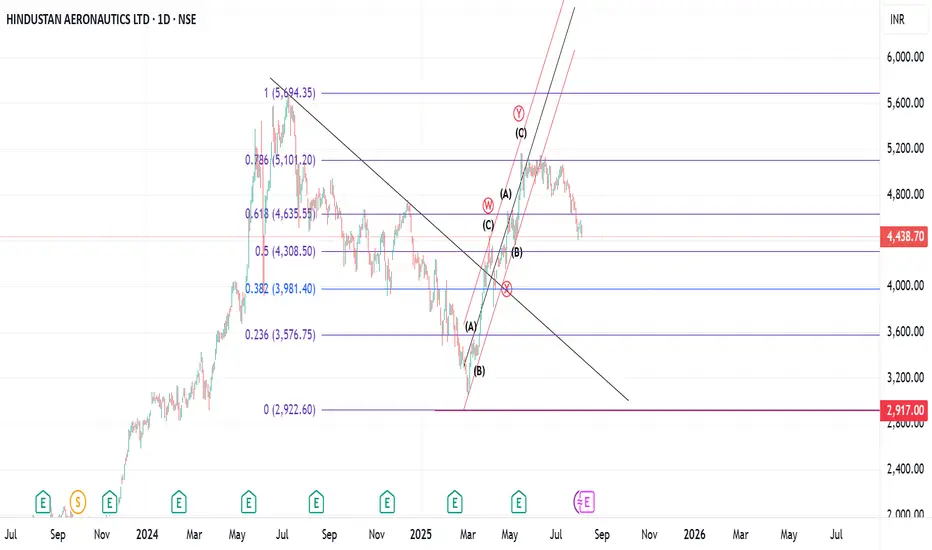
A corrective wave up seems to be overHAL corrected in an ABC fashion . Then a wave up happened again in a corrective formation .So what can it be . ABC-X-ABC . Is it possible . Yes it is . But what is more possible . A triangle which will consolidate and consolidate . For very long term guys just hold . For short term guys its and exit . For traders we can always tread on thin ice of life , as Pink Floyd said .Regards
EUR/USD Elliott Wave Count Signals Downside TargetsThe EUR/USD chart is displaying a completed 5-wave Elliott impulse structure, suggesting the potential start of a larger corrective move to the downside. Wave 5 appears to have finished after a classic ending diagonal pattern, with price now breaking below the wave 4 support trendline — a strong confirmation of trend exhaustion.
Currently, price is retracing upward towards the 0.5–0.618 Fibonacci retracement zone of the last impulsive leg, around 1.15912–1.16383, which may serve as the final rejection zone for bears to re-enter. This area aligns perfectly with prior support-turned-resistance and is considered the potential reversal pocket.
If price holds below the 1.17869 invalidation level, the structure supports the beginning of an ABC correction or a larger bearish impulse.
Target 1 (T1): 1.14800
Target 2 (T2): 1.13915
Stop Loss (SL): 1.17869
This scenario remains valid as long as the price does not break above 1.17869. A clean break and close above this level would invalidate the bearish setup and suggest a possible wave extension.

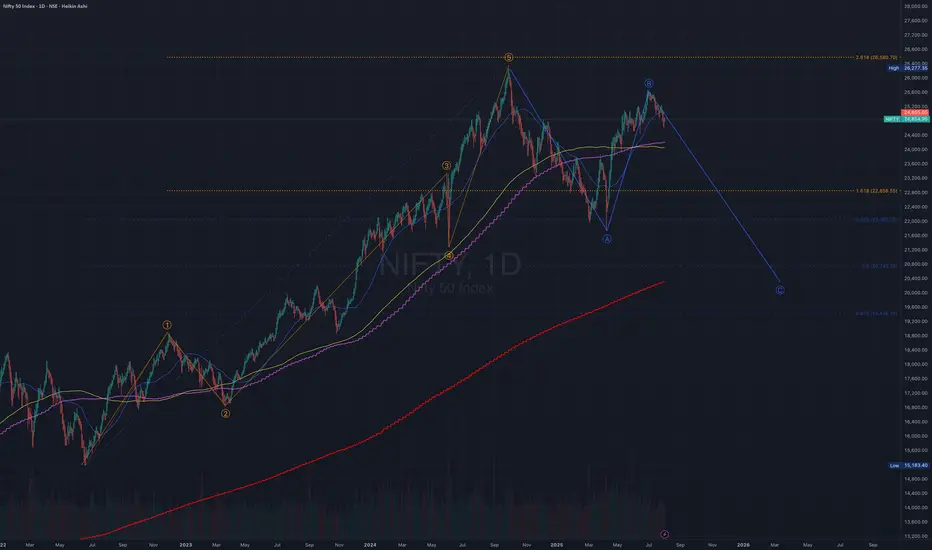
Tough Times ahead for Nifty. 26277 Top for some years?Nifty has been in Bull run for some Years now.
2008 to 2020 - Wave 1 Impulse
2020 Crash - Wave 2 Correction
2020 to 2025 - Wave 3 Impulse
2025 to 2026 - Wave 4 Correction
2026 2027 Onwards - Wave 5 Impulse
Let's Break Wave 4
It may take place in Double or Triple wave Combo.
The Corrective Wave ends in 3 or more Legs.
Wave A - 26k to 22k.
Wave B - 22k to 25.5k
Wave C - 25.5k to 21k
Next Set of Legs - to Follow in New idea.
This would be the 1st of the Corrective Combo that is expected to end around 19k By 2026 2027.
Now could be the Time for Wave C with rejection from 0.854 of Fib retracement of Wave A.
It looks like Wave C is about to begin.. Let's meet at 21k 🫣
RSI - Circled - to be noted.
All The Best🥲
Short Trade Activates below 24750.

BATAINDIA LONGThe Elliott Wave Theory's description of the structure and pattern of price movements in financial markets is known as the Elliott Wave Structure.
The Elliott Wave analysis indicates that the stock has completed waves (i) and (ii), which are shown as blue numbers on the daily chart. Wave (iii) appears to be underway at this time.
Wave (iii), also known as the impulse wave, unfolded into five waves, which are illustrated in red.
Wave levels are depicted on the chart.
An inverted Head and Shoulder Pattern is formed on the chart and the target is shown on the chart. (The Inverted Head and Shoulder Pattern is a bullish reversal pattern).
Level of Invalidation
The invalidation level of 1269 has been identified as the start point of wave (i). If the price falls below this level, it means that the projected Elliott Wave pattern is not as it appears.
I'm not a registered Sebi analyst. My research is done solely for academic purposes.
Please consult your financial advisor before trading or investing. I bear no responsibility for your profits or losses.
Regards,
Dr Vineet

COROMANDEL giving some healthy vibes!COROMANDEL appears to be finishing a multi-leg Flat correction. It's time to keep a good eye on the upcoming price action.

Nifty will fall to its 200 WMA at 20,308Nifty's Impulse Wave started in June 2022 at 15,123 and completed Wave 5 in September 2024 at 26,269 (Orange lines and levels on chart). The chart is perfect with Wave 3 hitting 1.618 fib and Wave 5 hitting 2.618 fib. Note that Wave 4 was exceptionally quick.
It then started an ABC correction wave (Blue on chart). Wave A completed in April at 21,712 (038 fib) and Wave B in June 2025 at 24,854. What's next? Wave C, of course! Wave Cs typically trace back to 0.5 fib to 0.68 fib and the 200 WMA is conveniently sitting right between them at 20,308 (red line) - and that's a solid support for the ABC correction to end.
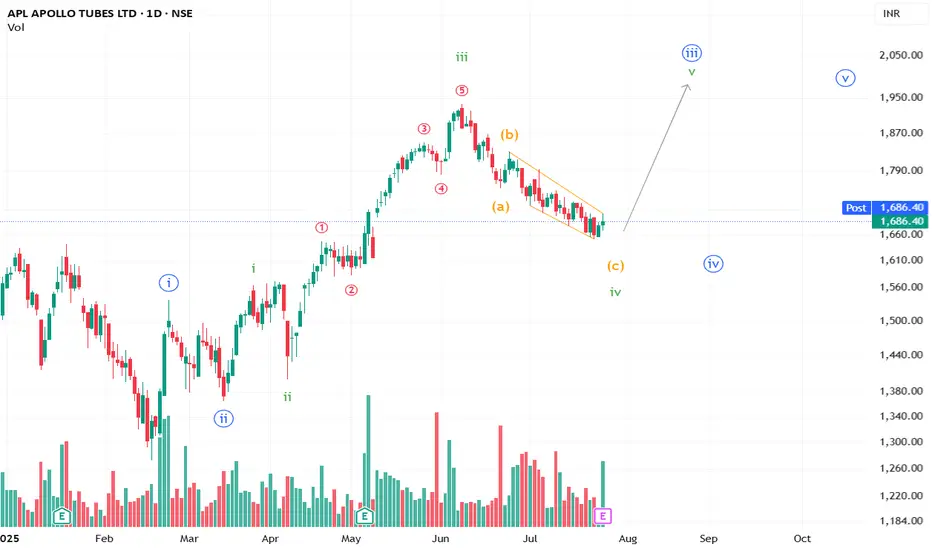
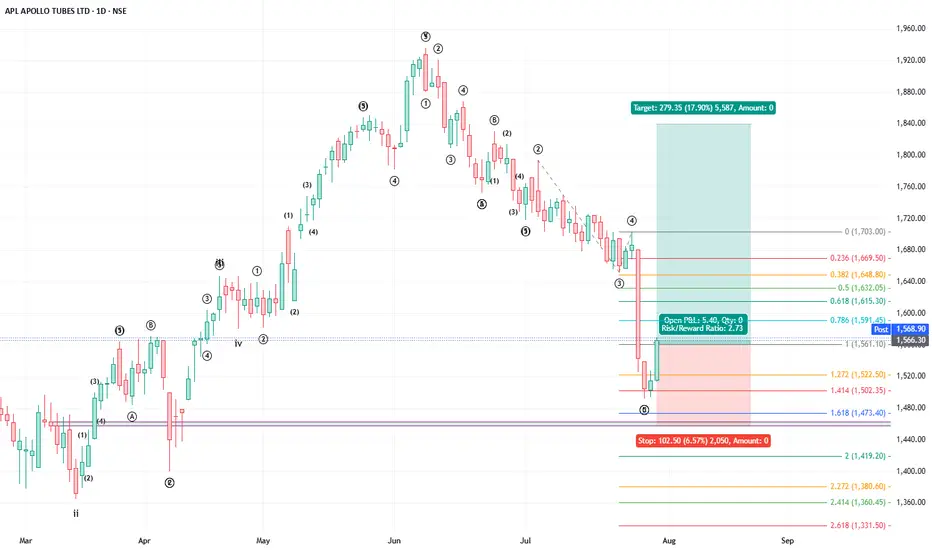
Buy Apollo TubesAPL Apollo Tubes has completed one full motive wave and related corrective wave in the form of a zigzag. All the wave markings are given in the chart.
One may consider going long on the stock with an initial target of 0.786 fibo retracement of the corrective wave. Stop loss is considered below 1.618 fibo retracement of Wave 2-3 to 4 of wave C of the corrective structure providing a risk-reward ratio of over 2.5x.
Will update the further targets as the stock waves unfold.
Happy Trading !!
Sell Laurus Labs Futures, wave iii of new impulse completed
Laurus Labs one of the favourite stocks in pharma and for futures traders.
The stock has completed its wave iii of the new impulse with a sub-wave 5 extension at about 1.618 times of sub-wave 0-3 to 4 of wave iii.
The upside from here will be very limited.
Sell Laurus Labs. Since stock is of high value, trade with a stop loss of 840.
Will update target depending on type of correction as the wave progresses.
Happy Trading!!

PRINCEPIPE LONGThe Elliott Wave Theory's description of the structure and pattern of price movements in financial markets is known as the Elliott Wave Structure.
The Elliott Wave analysis indicates that the stock has completed waves (i) and (ii), which are shown as blue numbers on the daily chart. Journey of Wave (iii) is started.
It is anticipated that wave (iii) will have about five subdivisions shown in red color.
wave i (in red color) of wave (iii) will unfold in five sub waves shown in black circle.
Wave levels of wave i in red color is shown on chart.
I am not a registered Sebi analyst. My research is being done only for academic interests.
Please speak with your financial advisor before trading or making any investments. I take no responsibility whatsoever for your gains or losses.
Regards
Dr Vineet

SPANDANA LONGElliott Wave analysis shows that the stock has completed waves (i), (ii), (iii), (iv) and (v) downside. Currently, the stock is undergoing correction wave (a), (b), and (c) in a daily time frame.
Wave (a) and (b) in blue colour are finished and the stock is currently in wave (c).
Wave (a) unfolded in five sub waves in red colour and Wave (b) is folded in three sub waves (a-b-c) in red colour.
Wave (c) will unfold in five sub-waves shown in red colour on the chart.
Wave levels are shown on the chart.
Level of Invalidation
The starting point of Wave (a) has been identified as the invalidation level at 286.65. Because as per wave rules Wave (b) cannot retrace more than 100% of Wave (a). If the price falls below this level, it can indicate that the expected Elliott Wave pattern is not as it seems.
I am not a registered Sebi analyst. My research is being done only for academic interests.
Please speak with your financial advisor before trading or making any investments. I take no responsibility whatsoever for your gains or losses.
Regards
Dr Vineet

JBMA LONGThe Elliott Wave Theory's description of the structure and pattern of price movements in financial markets is known as the Elliott Wave Structure.
The Elliott Wave analysis indicates that the stock has completed waves (i),(ii),(iii) and (iv), which are shown as blue numbers on the daily chart. Wave (v) appears to be underway at this time.
Wave (v), also known as the impulse wave, unfolding into five waves, which are illustrated in red.
wave i and ii is finished and wave iii ( in red colour) will unfold in sub waves shown in black circle.
Black circle wave 1 and 2 is about to finish and wave 3 (in black circle) will start.
Wave levels are depicted on the chart.
Level of Invalidation
The invalidation level of 1388 has been identified as the start point of wave i of wave (v). If the price falls below this level, it means that the projected Elliott Wave pattern is not as it appears.
I'm not a registered Sebi analyst. My research is done solely for academic purposes.
Please consult your financial advisor before trading or investing. I bear no responsibility for your profits or losses.
Regards,
Dr Vineet

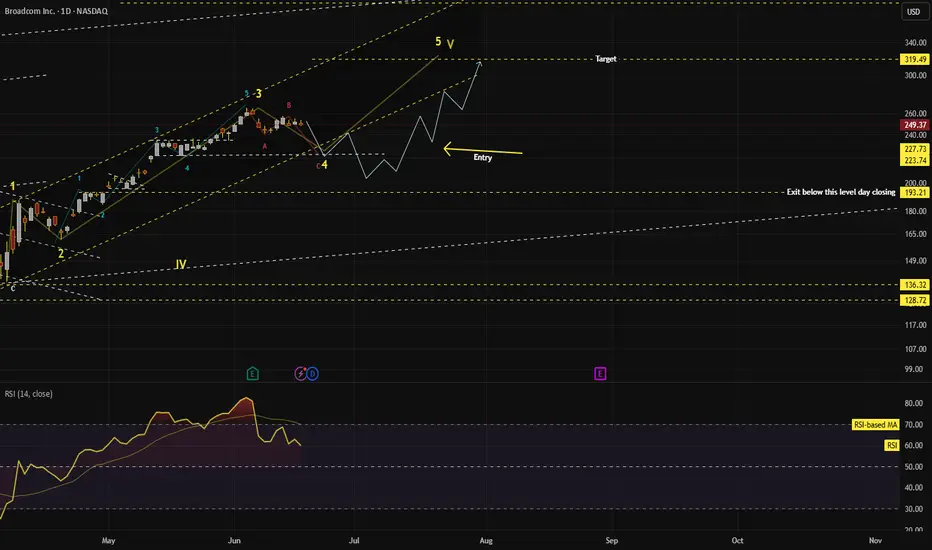
Broadcom (AVGO) can correct till 206, post that a target of 315 AVGO has completed its lower degree 5 waves and higher degree wave-3.
Currently it is correcting in ABC waves.
Blue line depicts probable path it may take correcting and then taking turn up towards a target of 315, which completes its higher degree Wave-5 and mostly larger Wave-5(Wave-V).
How can one enter ?
Wait for price to correct and make a entry pattern(as per Price action and RSI divergence)
Exit will be around 315 or any rule based system.
When this view will be negated:
If daily price closes below 193.25 above view gets negated.
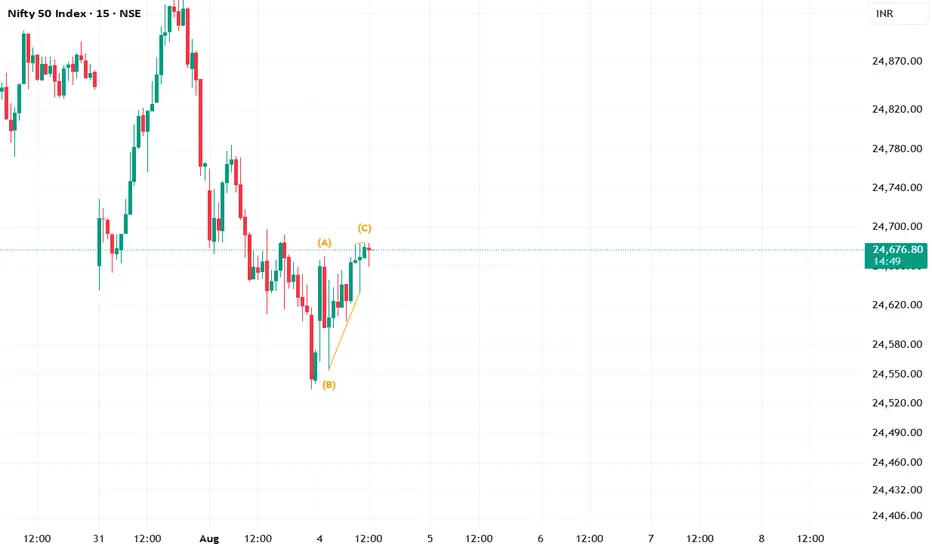
Decoding Nifty’s Correction: What Lies Ahead?Is Nifty poised for a deeper correction? And if so, why? Let’s look at it through the lens of Elliott Wave Theory.
Elliott Wave distinguishes between motive waves, which unfold in 5-wave structures, and corrective waves, which unfold in 3-wave patterns. Within a 5-wave move, waves 2 and 4 act as counter-trend corrections. In a 3-wave correction, wave B typically moves against the prevailing trend.
Corrective patterns can take the form of flats, zigzags, or triangles, each with its own character. There are rules for their formation. Interestingly, in bullish market, corrections often behave like a runaway bride in waves 2 and 4 —where they defy clean textbook expectations.
Now, after every 5-wave advance, a correction typically follows. The depth of this correction depends on whether the preceding 5-wave structure was part of a smaller swing or the completion of a larger trend.
So, what’s happening with Nifty?
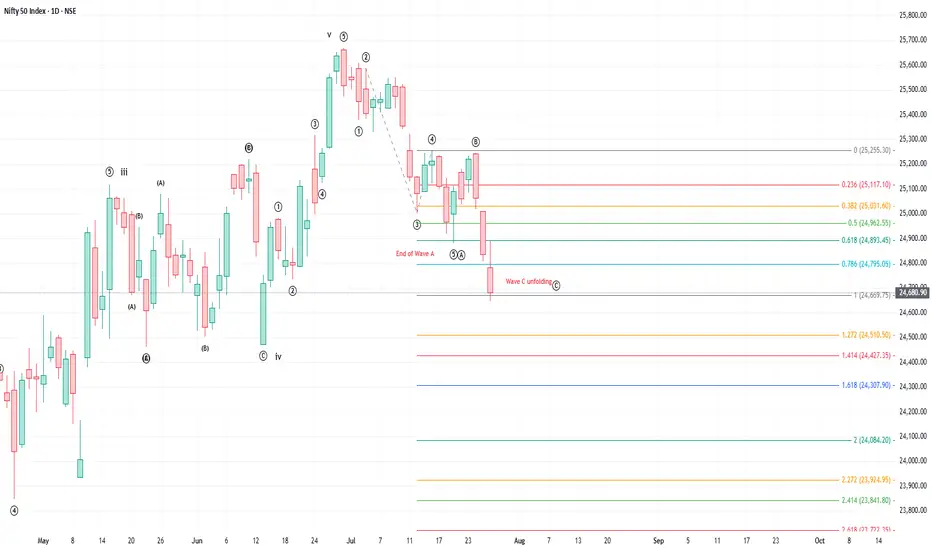
It appears that Nifty has completed a FULL 5-wave advance. The correction from 15 May to 13 June is a flat correction as posted earlier, which followed the end of wave (iii). (I’ll post why it is end of wave (iii) in the comments section.
The next swing up (13 June to 30 June) also unfolded as a clear 5-wave move. If the correction is attributable only to this swing, then it will not go lower than the lower extreme of the swing.
If this upward leg marks end of wave 5 of a larger structure , then what we’re seeing now is a proper 3-wave corrective structure which will bring a decent retracement to the entire up move.
Typically, end points of larger moves can be validated using Fibonacci ratios—like comparing wave 0–3 to 4, or wave 2–3 to 4. In this case, no clear Fibonacci relationship appears, but that sometimes happens.
Now, here's the tricky part: corrective waves are the hardest to decode in Elliott Wave analysis. Markets often react to multiple retracement levels, making early predictions risky unless at least one leg of the correction is fully formed.
Looking at recent action:
The decline from 30 June to 21 July looks like a clean 5-wave down, suggesting a potential wave A. The bounce that followed fits well as a 3-wave move, likely wave B.
And now, Nifty seems to be forming wave C, unfolding rapidly with gap-downs and accelerated moves—a sign that the correction is still in play.
I’ll share more thoughts soon on Wave C as it unfolds in the comments section.
Buy Infosys, stop loss 1546Infosys completed its major correction on 7 April after correcting about 35%. The stock has been forming a new impulse wave ever since.
As given in the charts, the new impulse wave had a iii-wave extension and completed wave iii on 12 May and has been undergoing correction.
Rationale :
As marked in the charts, the structure represents a flat corrective structure under Elliot wave theory which is a 3-3-5 structure. Wave A (divides into three waves), wave B (divides into three waves) and wave C divides into 5-waves. The minimum requirement for wave A to Wave B ratio is >1 (for normal flat).
As given in the chart, the corrective structure complies with all above conditions. Wave C has a 5-wave structure, sub-wave three has an extension (i.e. it has its own 5 waves). At Wave 2-3 to 4 ratio of 0.5 stocked bounced up and in the process completing the minimum requirement of Wave A to Wave B ratio of >1. Given this there is a good possibility for stock to proceed upwards.
Buy with a stop loss of 1546, TP will be updated as waves unfold.

FLAIR LONGThe Elliott Wave analysis indicates that the stock has finished waves (i) and (ii).
Stock is moving in the wave (iii), which are shown by blue numbers on the daily chart.
Wave (iii), also known as the strongest impulse wave, unfolded into five waves, which are illustrated in red.
waves i, ii, iii and iv are finished and shown in red colour on the chart.
Wave v (in red colour) of wave (iii) (in blue colour) will unfold in five waves, as illustrated in the black circle.
Wave levels are depicted on the chart.
Level of Invalidation
The invalidation level of 294 has been identified as the end point for wave i. If the price falls below this level, it means that the projected Elliott Wave pattern is not as it appears.
I'm not a registered Sebi analyst. My research is done solely for academic purposes.
Please consult your financial advisor before trading or investing. I bear no responsibility for your profits or losses.
Regards,
Dr Vineet

Go long on Nifty
Refer to my earlier publication on Nifty Trajectory wherein I had mentioned that Nifty is undergoing a correction in the form of a Flat and had correctly predicted that wave C got completed at little over 1 x of Wave A and that one may consider going long on Nifty (May - June consolidation).
Further to this, Nifty completed its first order impulse wave on 1 July and has been undergoing correction in the form of a zigzag. Wave C in all probability is complete at 0.618 fibo extention of wave 0-3 to 4 as given in the charts.
One may consider long position on Nifty with stop loss below today's low.
IDFCFIRSTB LONGElliott Wave analysis shows that the stock has completed wave i in black circle. Currently, the stock is undergoing correction wave ii shown in black circle. wave (ii) will move in (a), (b), and (c) in a daily time frame in blue color.
Wave (a) in blue colour is completed and the stock is currently in wave (b).
Wave (b) will unfold in three sub-waves (a-b-c) shown in red colour on the chart.
Wave a and b (red colour) of wave (b) is completed and the stock is in wave c of wave (b).
Wave level is shown on the chart.
Level of Invalidation
The starting point of Wave c has been identified as the invalidation level at 62.40. If the price falls below this level, it can indicate that the expected Elliott Wave pattern is not as it seems.
I am not a registered Sebi analyst. My research is being done only for academic interests.
Please speak with your financial advisor before trading or making any investments. I take no responsibility whatsoever for your gains or losses.
Regards
Dr Vineet

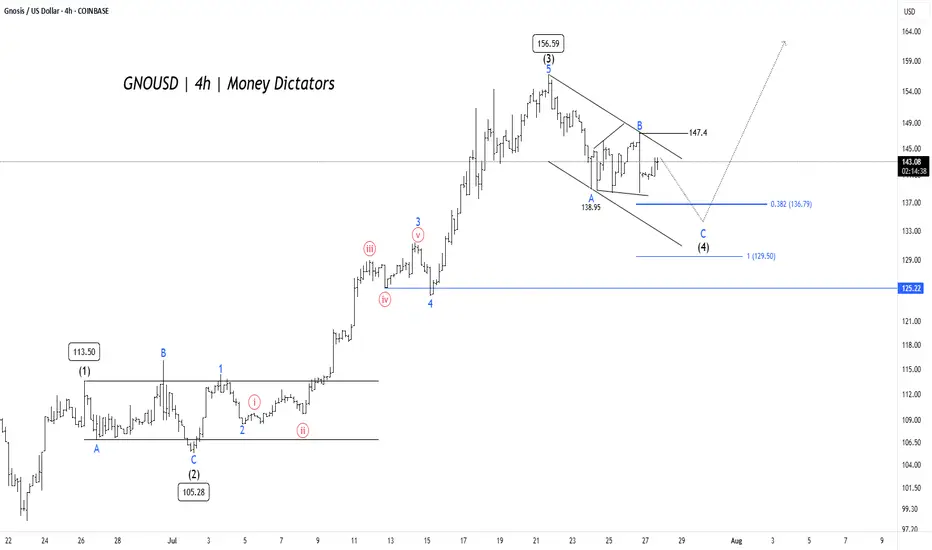
GNO/USD Price Action Aligns for Final Wave 5 PushGNO/USD pair is unfolding a clean Elliott Wave impulse pattern on the 4-hour chart. The rally began with Wave (1) reaching 113.50, followed by a corrective Wave (2) that bottomed near 105.28. This set the stage for a powerful Wave (3) that surged to 156.59 , aligning well with Elliott Wave theory where Wave 3 is typically the strongest and steepest leg in the sequence.
Wave (4) is now in progress, taking the form of an A-B-C correction inside a descending channel. Interim support was found at 138.95 during Wave A, and Wave C could extend toward the 0.382 Fibonacci retracement level at 136.79 or the deeper support zone near 129.5. These levels are crucial, as they often mark the end of a corrective phase and the beginning of the next impulse. A confirmed breakout above 147.4 would signal the start of Wave (5) and the return of bullish momentum.
Short-term targets have the potential to reach 135 – 128 , while 125.22 remains the invalidation level for this bullish setup. After the completion of Wave (4), traders can look for long opportunities targeting 147 – 154 – 172 . As long as the structure holds and price respects key supports, the outlook remains favorable for a fresh push higher in Wave (5).
APL Apollo Tubes Limited Set to Surge?A well-formed ABC correction to the downside appears to be losing steam, and an upward move may take shape.
**This is an educational market outlook, not investment advice. Please consult a SEBI-registered advisor before taking any investment decisions.**