Jio - Short Term Trade - LongJio could have completed correction. But difficult to say.
However, we have 5W down on daily and can look for a pullback to 260.
SL 230.
Elliott Wave

Elliot Wave study EMAMI LTDEmami Ltd., incorporated in the year 1983, is a Mid Cap company (having a market cap of Rs 27,316.17 Crore) operating in FMCG sector.
Emami Ltd. key Products/Revenue Segments include Personal Care and Other Operating Revenue for the year ending 31-Mar-2024.
For the quarter ended 31-12-2024, the company has reported a Consolidated Total Income of Rs 1,064.41 Crore, up 16.69 % from last quarter Total Income of Rs 912.15 Crore and up 5.07 % from last year same quarter Total Income of Rs 1,013.03 Crore. Company has reported net profit after tax of Rs 283.48 Crore in latest quarter.

ABC Correction till .618Those who can understand will understand . There is no alternate count . Regards

Havells India to complete complex correctionHavells India to soon complete complex correction (W-X-Y). right now we are in the last part of the wave Y.
Possibilites:
1) Wave Y can be (A-B-C) correction in which case we are almost done and ready to move to impulsive structure
2) Wave Y can be (1-2-3-4-5) in which case we are in wave 4 and will take some more days to complete and then expect wave 5 to unfold in that case we will be dropping to 1454-1455.
What to do? Its just wait and watch situation before we see any conclusive move.
Disclaimer: I am not SEBI registered member and this idea is only for educational purposes. Please do your own analysis and decide to buy/sell at your own risk

HUL wait for Pull back and then EnterHUL has just completed the downward Impluse and complex correction (W-X-Y). Although today it showed the strength to move upward, however it looks like there is need for one pullback before the upward Journey.
Chart Speaks everything.
Disclaimer: I am not SEBI registered member, these Ideas meant to be only for Educational Purposes.

Fivestar Business Finance, will correction end at 669 rs ?Fivestar Business Finance has started the uptrend, but then it has to go for a small correction before it resumes it upward Journey, I see that we are in the process of completing 2nd wave. Will the correction ends at 669 or goes down a little bit beyond 669 that is the question?
I would prefer to wait and watch and then take the decision when the right time comes. After all tradingview has a great Alert Indicator which indicates when a particular situation occurs.
Disclaimer : This is for educational purpose only. I am not SEBI registered member, I am not authorised to give any buy or sell decision. Please do your own analysis and then take a call.

Colpal - Weekly EW Analysis - Long Set-upWe are completing some form of correction in a triangle - assuming it to be an ED.
Play for 10% and then trail - could give big returns.

MRF - Weekly EW Analysis - Long Set-up5 Wave down in C of 4 seems done.
If not entire 4, maybe a larger W down in 4 done and a larger X to unfold.
Can play for 1,30,000 in X and ATH in 5.

Sarda Energy - Weekly EW Analysis - Long Set-upWave 4 seems over. Play for another 50% in 5 of of 3.
This is just larger wave 3. So long way to go for investors.

#Nifty directions and levels for January 30th:Good Morning, Friends! 🌞
Here are the market directions and levels for January 30th:
Market Overview
There have been no significant changes in the global markets, which continue to maintain a bullish sentiment, as indicated by the Dow Jones. However, our local market is showing a moderately bullish sentiment. Today, the market may open with a neutral to slight gap-down due to the Nifty indicating a negative sign of -4 points.
In the previous session, both Nifty and Bank Nifty maintained a bullish bias, but there haven't been any new developments. If the market starts to pull back, we can expect further continuation with some consolidation. Conversely, if it begins to decline, we might see a range-bound market within the previous day's range. Structurally, a correction appears to have a low probability; however, if it breaks the major zone, we could consider that a correction. Let’s look at the charts.
Nifty Current View
The current view suggests that if the market starts with a pullback, it could reach the 78% mark, which is a key Fibonacci level for predicting market direction. Today, if the market breaks above 78%, we can expect further continuation of the rally with some consolidation. Conversely, if the market gets rejected at this level, we can anticipate a minor correction of 23% to 38% in the current minor swing.
Alternate View
The alternate view indicates that if the market starts to decline, it could consolidate between the previous high and the 38% Fibonacci level. A correction is expected only if it breaks the 38% level. If that happens, we can anticipate a correction of at least 50% to 78% in the current swing. Until the 38% level is broken, the market bias could remain moderately bullish.

#Banknifty directions and levels for January 30th:Bank Nifty Current View
The current view for Bank Nifty is similar to that of Nifty. If the market pulls back, it could reach a minimum of 49,381 to 49,400, which is a rejection zone. If it consolidates or breaks this level, we can expect further continuation. On the other hand, if it gets rejected sharply there, we can expect a correction of at least 50% to 78% in the current swing.
>For reversal confirmation, we can use the EMA20 on the 15-minute chart. In a directional market, this indicator works well, but if the market starts to grind, it may show some false signals.
Alternate View
The alternate view suggests that if the market starts to decline, it could reach a minimum of 48,850 when it breaks the 38% mark. If this happens, the demand zone will act as strong support, and structurally, we can expect a pullback here. However, we should note that if the market reaches this level in a straight line or consolidates without any pullback, the probability of further downside increases.

Buying opportunity in PRESTIGE ESTATE LTDPRESTIGE ESTATE LTD is in Double Correction.
The maximum target for wave (Y) of double correction is 161.8% extension.
We can see that price is near 161.8% so here we can buy this stock with stoploss below 1185.
The target will be minimum 38.2% retracement of entire move i.e. 1528
This analysis is based on Elliott Wave theory and Fibonacci.
This analysis is for educational purpose only.

KPIT Technologies in last leg of wave 5I am closely following KPIT for quite a while. If the label wave counts are correct then expect KPIT to fall further. As per my analysis its in the last leg of correction which is wave 5 of wave Y. Now wave 5 can be a impulse or simply an ending triangle. Once the correction is over expect a quick and sharp move towards 1900.
If it moves sharply above 1570 by mid of next week, my count is wrong and need to revise it.
Note: This information is only for educational purposes . This is not an investment or trading advice. I am not SEBI registered member. please do your own analysis and decide.

TVS Breakout will take it to 2900 plusTVS has completed the Complex corrective Wave W-X-Y, its time for it to move up and continue its Journey towards 2900 Plus in coming days.
Remember the Stock Market Movement is not Linear, so it will take some time. The question to ask ourself is do we have patience to see the price we are looking for.
Disclaimer: I am not SEBI Registered Member. The Idea Posted is for Educational Purpose only

#Nifty directions and levels for January 29th:Good Morning, friends! 🌞
Here are the market directions and levels for January 29th:
Market Overview:
There have been no significant changes in the global markets, which are still maintaining a bullish sentiment based on the Dow Jones. However, our local market is showing a moderately bearish sentiment. Today, the market may open neutral to slightly gap-up, as Nifty indicates a positive move of 40 points.
In the previous session, both Nifty and Bank Nifty had a solid rally, but by the end of the day, they fell slightly. Structurally, the market is still in bearish territory. So, today's session may see some consolidation within the previous day's range. Let's look at the chart.
Both Nifty and Bank Nifty share the same structural sentiment.
Nifty Current View:
Even if the market starts with a gap-up, structurally, it may not sustain. So, if the market declines initially, we can expect a correction towards the 22862–22827 level, which is a major support zone. If the market finds support here, it is likely to bounce back to its opening levels.
> On the other hand, if the market breaks this zone or consolidates around it, the correction will likely continue towards 22776, a minor pullback zone.
Alternate View:
If the gap-up sustains, 23089 will act as strong resistance. If the market gets rejected at this level, we can expect a range-bound session. However, if it consolidates or breaks above this level, the rally will likely continue towards 23185 and the 78% retracement level.

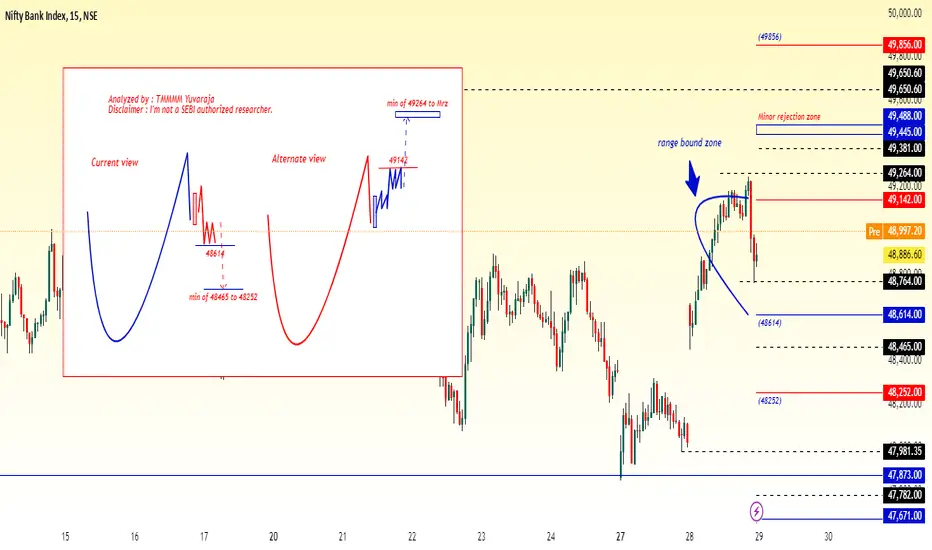
#Banknifty directions and levels for January 29th:Bank Nifty Current View:
The current structure in Bank Nifty is similar to Nifty. If the market declines initially, we can expect a correction towards 48614, which is a major support zone. If the market finds support here, it may bounce back to its opening level with a bullish bias.
> On the other hand, if the market breaks this zone or consolidates around it, the correction will likely continue towards 48465–48252.
Alternate View:
If the gap-up sustains, 49142 will act as strong resistance. If the market gets rejected at this level, we can expect a range-bound session. However, if it consolidates or breaks above this level, the rally will likely continue towards 49264, a minor rejection zone.
LTF - Weekly EW Analysis - Long Set-upEither Wave 4 done or Y in 4 done.
In both cases a good set-up for 15% long trade.

Tata Motors - Weekly EW Analaysis - Long Set-upWave A down is done, and B of Wave B up is done.
Play Wave C up for a +15% trade.

Piramal Enterprises Limited (PEL) !! Ready to ride trend ?? A symmetrical chart pattern on PEL ??
From a broader perspective, the stock has been consolidating at these levels, considering the overall market structure and bearish sentiment in the Indian market and quarterly results show a decline in PEL profits.
Moreover, it raises the question—how many of you have opted for loans from PEL? "KON hain ye log, Kaha se atte hain!!" Compared to other loan providers, PEL doesn’t seem to stand out as a major player in the personal loan space or offer particularly attractive deals to customers.
Technical Analysis:
PEL is forming a symmetrical chart pattern. An early entry could be considered around the ₹900 level.
Stop Loss: 950 Rs
Target : Open/Mentioned on Chart
Strategy: One can take 900 PE FEB month Expiry or Short the Future.
Let me know what you think about this analysis.
Happy Trading!

Nifty FUT Next move in possible SL 1Hr candle close only, Target Trigger Price
All detail for chat. good entry at mark price only. and must stoploss minimum risk and good profit. risk ratio 1:1 to manage modified SL. This is not call, Just my idea. Please understand your risk and take full responsibility of your actions

#Nifty directions and levels for January 27th:Good Morning, friends! 🌞
Here are the market directions and levels for January 27th:
Market Overview:
There have been no significant changes in the global markets, which are still maintaining a bullish sentiment (based on the Dow Jones). However, our local market is showing a bearish sentiment.
> The Nifty is showing a long gap-down start. If this sustains, structurally, we can expect the correction to continue with some minor pullbacks. Based on the wave structure, this long gap-down could extend into the 3rd sub-wave of the correction. Typically, the 3rd wave is the longest leg of an impulse, so we can expect a prolonged correction. This is the structural sentiment.
> On the other hand, the budget announcement is just a few days away, and experts are expecting high volatility. This means there is no clear direction—if the market goes down, it could recover at any point, and if it goes up, it may eventually reverse. Therefore, the sentiment is a bit difficult to predict.
In light of this, we can apply a simple trading method:
> as long as the 38% Fibonacci level in the minor swing holds, the correction is likely to continue in the current direction. If this level breaks, we can expect a reversal.
This is just my opinion based on my limited experience. If you have any better ideas, please share them with me so we can discuss them in this community.
However, all the chart structures are based on Elliott Wave theory and Fibonacci levels that we regularly update, so you can follow them without any doubts. Have a nice day!

#Banknifty directions and levels for January 27th:
> The Nifty is showing a long gap-down start. If this sustains, structurally, we can expect the correction to continue with some minor pullbacks. Based on the wave structure, this long gap-down could extend into the 3rd sub-wave of the correction. Typically, the 3rd wave is the longest leg of an impulse, so we can expect a prolonged correction. This is the structural sentiment.
> On the other hand, the budget announcement is just a few days away, and experts are expecting high volatility. This means there is no clear direction—if the market goes down, it could recover at any point, and if it goes up, it may eventually reverse. Therefore, the sentiment is a bit difficult to predict.
In light of this, we can apply a simple trading method:
> as long as the 38% Fibonacci level in the minor swing holds, the correction is likely to continue in the current direction. If this level breaks, we can expect a reversal.

Possible Wave Counts on Daily Time Frame Chart of DXYMost investors treat trading as a hobby because they have a full-time job doing something else.
However, If you treat trading like a business, it will pay you like a business.
If you treat like a hobby, hobbies don't pay, they cost you...!
In this study we used Elliott Wave Theory & Structures, here we have plotted possible wave counts on daily time frame chart of DXY Dollar Index, it involves multiple possibilities, and the analysis presented focuses on one potential scenario. The provided information is for educational purposes only, not trading advice. There's a risk of being completely wrong.
I am not Sebi registered analyst.
My studies are for educational purpose only.
Please Consult your financial advisor before trading or investing.
I am not responsible for any kinds of your profits and your losses.
Hope this post is helpful to community
Thanks
RK💕
Disclaimer and Risk Warning.
The analysis and discussion provided on in.tradingview.com/u/RK_Charts/ is intended for educational purposes only and should not be relied upon for trading decisions. RK_Charts is not an investment adviser and the information provided here should not be taken as professional investment advice. Before buying or selling any investments, securities, or precious metals, it is recommended that you conduct your own due diligence. RK_Charts does not share in your profits and will not take responsibility for any losses you may incur. So Please Consult your financial advisor before trading or investing.
