Axis Bank Downward Trend is not overAxis Bank has formed a flat correction ABC, currently we are in the last leg of the correction, where wave C is a triangle. we still have wave Z of the triangle to be complete, which I believe will be around 1000 little less.
Once the triangle is over we will get a very sharp and big move in upward direction the reward which you will remember for the months to come.
PS: Someone please remind me around 4th or 5th of Feb about Axis Bank. Let us all benefit from the upcoming trend once the triangle is completed.
Disclaimer: This is for educational purpose only. I am not SEBI registered Member.
Elliott Wave

#Nifty may go much lower than we imagine - ShortGood Morning, friends! 🌞📊
24 Jan 2024 Market View:
🔹 Nifty is currently trading at 23,200.
🔹 It seems likely to find support at the AVWAP of the October low.
🔹 However, if it breaks below this AVWAP level, a bearish trend may emerge.
🔹 In such a scenario, we can adopt a short position with a stop-loss above 23,473.
📉 Short Position Details:
Entry: 23,200
Stop-Loss (SL): Above 23,473
Target: 22,207
Risk-to-Reward Ratio: 2.78
📌 Summary:
This setup provides a favorable Risk-to-Reward ratio, making it an attractive opportunity for those comfortable with the market's direction. Keep a close eye on price action near the AVWAP level and trade cautiously!
📜 Disclaimer:
This analysis is for informational purposes only and should not be considered as financial advice. Trading in financial markets involves significant risk and may not be suitable for all investors. Please do your own research or consult with a professional financial advisor before making any trading decisions. Past performance is not indicative of future results.
Trade safe! 💹✨

#Nifty directions and levels for January 23rd:Good Morning, friends! 🌞
Here are the market directions and levels for January 23rd:
Market Overview:
There have been no significant changes in the global markets, as they are still maintaining a bullish sentiment (based on the Dow Jones). However, our local market shows a bearish sentiment.
In the previous session, both Nifty and Bank Nifty experienced high volatility again, but the two indices reacted differently. My personal opinion is that there is still a noticeable difference between the Nifty and Bank Nifty charts.
For Bank Nifty, it broke the previous low yesterday, which suggests that the correctional bending sub-wave might have ended. Even if it opens with a gap-down today, we can expect some consolidation within the previous day’s range.
However, Nifty still shows correctional sub-waves in progress, which could push it slightly downward. Therefore, we should approach the market cautiously.
Overall, today’s market may remain range-bound. If the market moves in a single direction, trading is easier, but due to differing sentiments, traders may dominate one another, creating a tug-of-war scenario.
Let’s dive into the charts for further details.
Nifty Current View:
According to the current structure, if the gap-down sustains and breaks the 38% mark solidly, we can expect the continuation of the correction. The targets are expected to be between 23022 and 22944 if it breaks the 38% mark.
Alternate View:
The alternate view suggests that if the gap-down does not sustain or if the market finds support around the 38%, we can expect some consolidation between the 38% and the upside 78% mark.

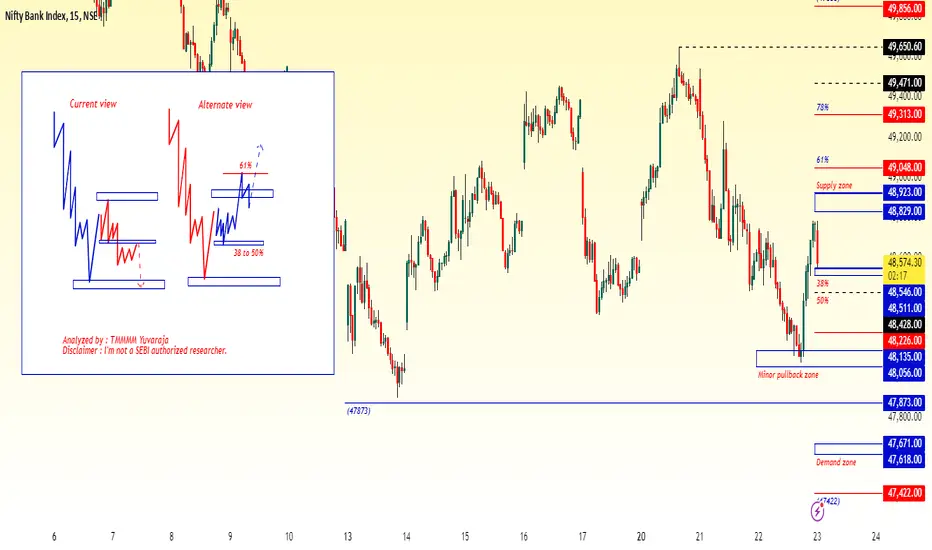
#Banknifty directions and levels for January 23rd:Bank Nifty Current View:
The Bank Nifty current view has two variations:
> First Variation: If the gap-down sustains, it will likely consolidate within the previous day's range. In this sentiment, a correction will only be expected if it breaks the previous bottom, meaning that until the previous bottom is broken, the market bias could remain moderately bullish.
> Second Variation: This is conditional; the initial market should take a solid pullback and could reject around the immediate resistance zone. If this occurs, the market will turn into a correction phase, supported by structural reasons.
Alternate View:
The alternate view is similar to that of Nifty. If the gap-down does not sustain or if the market finds support around the 38%, we can expect some consolidation between the 38% and the upside 61% mark. In this case, the supply zone may not be as effective.
Wave A of ABC Correction - may be a future triangleWave A of ABC correction seems to be over as it has reached wave iv of one higher count . Most important about corrections is their angle has to be lesser than the that of the wave it is correcting (in this case wave iii) , because its distribution slowly , unless it is wave C of a flat . Wave a marked here is almost a cliff , so I I this its wave A only . Sell on any pullback on the levels market on the chart which will be only wave B (pull back) . Note this ABC could only be wave a of a triangle in wave 4 position . It shows a long consolidation . Try to get out of it . Regards

MAXHEALTH Bearish ViewAll higher time frames are bearish.
MACD, RSI Indicators shows bearish view.
C Wave of may start.
Price Action below 100 EMA

Nifty-50 Weekly Technical Analysis 👉Based on the available technical analysis for Nifty 50 in 🕝Weekly Time Frame

#Nifty directions and levels for January 22nd, WednesdayGood Morning, friends! 🌞
Here are the market directions and levels for January 22nd, Wednesday
Market Overview:
The global market is maintaining a bullish sentiment (based on the Dow Jones), while our local market shows a bearish sentiment. Today, the market is likely to open neutral to slightly gap-up, as the Gift Nifty indicates a +50-point positive opening.
In the previous session, both Nifty and Bank Nifty experienced high volatility. Based on the structure, the market is expected to remain range-bound, even if it breaks the previous bottom, especially in Nifty.
> So, if the market sustains the gap-up, we can approach it with a range-bound sentiment with a bearish bias. However, if the market begins a correction, the current correction trend is likely to continue.
Let’s look at the charts for more details.
Nifty Current View:
The current structure suggests that if the gap-up doesn't sustain or if the market breaks the previous low after some consolidation, we can expect the correction to continue toward the levels of 22898 to 22829.
Alternate View:
If the gap-up sustains, we should approach it as a range-bound market. However, avoid taking long positions without confirmation. For a long position, wait for a breakout at specific levels. For example, if the market breaks the 50% level, targets could be set at 61% and 78%.

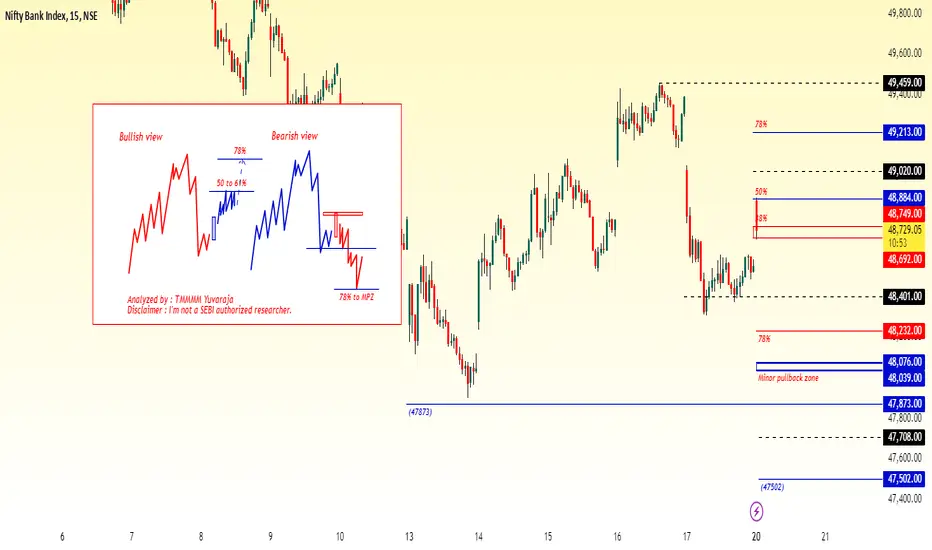
#Banknifty directions and levels for January 22nd, WednesdayBank Nifty Current View:
The current view for Bank Nifty aligns with Nifty. If the gap-up doesn't sustain or the market breaks the previous low with consolidation, we can expect the correction to continue toward the levels of 48309 to MPZ.
Alternate View:
If the gap-up sustains, we can approach Bank Nifty as a range-bound market as well. Traders can look for breakout entries. For instance, if the market breaks 48848, we can anticipate a move toward 49031.

NZDUSD: The Calm Before a Bearish StormNZDUSD has broken below the 50/20 EMA on the 4-hour timeframe chart. The price experienced a sharp decline, followed by a corrective pause that appears to form an expanded flat correction. Wave (C) completed at 0.5692 . The ATR has decreased to 0.00189 , while the ADX has dropped to 22.87 .
The impulsive move is expected to occur downward. If the price breaks below wave B at 0.55870, it may reverse from the following targeted Fibonacci levels : 0.5555 (1.618) and 0.5470 (2.618).
We will update further information soon.

$doge long idea as per elliot wave doge in 5th wave as final wave. as per count it will give 7x profit from here

#Nifty directions and levels for January 21st, TuesdayGood Morning, friends! 🌞
Here are the market directions and levels for January 21st, Tuesday:
Market Overview:
The global market is maintaining a bullish sentiment (based on the Dow Jones), while our local market shows a moderately bullish sentiment. Today, the market is likely to open with a neutral to slightly gap-up start, as the Gift Nifty indicates a +60 point positive opening.
In the previous session, both Nifty and Bank Nifty had a solid pullback. According to the structure, it seems like a "flag pattern." If the market breaks the immediate resistance with a solid candle today, we can expect a further rally continuation. However, if we analyze the wave structure, it could represent the "C" leg, and also its a final leg of the pullback. So, In this scenario, if the market rejects around the immediate resistance, we can initially expect a 23% to 38% correction. A trend reversal (from bullish to bearish) will be considered only if the 38% Fibonacci level is broken. This is the basic structure. Let's look at the chart for more clarity.
Both Nifty and Bank Nifty exhibit similar structural sentiments.
Current View:
The current view, based on Elliott Wave analysis, suggests that if the gap-up doesn't sustain or if the market faces rejection around the immediate resistance, we can expect a minimum correction of 23% to 38% in the minor swing. This is a major support level, so until the 38% mark is broken, the trend remains bullish. Conversely, if it breaks the 38%, we can consider that a trend reversal.
Alternate View:
The alternate view suggests that if the gap-up sustains and consolidates or breaks the immediate resistance level, then the rally will likely continue. In this case, we can consider that a flag pattern or the third wave of the new impulse.

#Banknifty directions and levels for January 21st, Tuesday:Current View:
The current view, based on Elliott Wave analysis, suggests that if the gap-up doesn't sustain or if the market faces rejection around the immediate resistance, we can expect a minimum correction of 23% to 38% in the minor swing. This is a major support level, so until the 38% mark is broken, the trend remains bullish. Conversely, if it breaks the 38%, we can consider that a trend reversal.
Alternate View:
The alternate view suggests that if the gap-up sustains and consolidates or breaks the immediate resistance level, then the rally will likely continue. In this case, we can consider that a flag pattern or the third wave of the new impulse.

MCX Gold: Elliott Wave Insights on Ascending ChannelTimeframe: Daily
MCX Gold has been trading within an ascending parallel channel for over 65 weeks . The value area highlights zones of supply and demand, with the control line exerting a gravitational pull on the current price. Within this structure, there are four zones of no trading activity and two neutral zones.
A triangle pattern is forming around the control price, indicating a potential price movement. If the price closes above the control line, it could potentially reach the following targets: 77660 – 78560 – 79600+ . On the other hand, if the price breaks and closes below the strong support level, we may witness a short decline, possibly reaching the lower band of the parallel channel.
We will update further information soon.

HAL 5000 Plus by end of March 2025Are we late to catch the HAL move, May be little bit, however after checking the recent correction we still can Join the upward movement, need to keep patience till March end if you want good returns.
Disclaimer : I am not SEBI registered member, this is just for educational purpose only.

Cipla correction will be over by 31st of JanCipla is in last leg of correction of expanding triangle, where it will complete wave e and so thus the Wave C of the Zig-zag at 1372-1371
Possibilities:
1) Cipla's correction will be over by 31st Jan if it completes leg e (1372-1371)
2) Chances are there might be wave e truncation and we will start seeing the trend change, which will be uptrend
3)wave e might slightly overthrow beyond the lower support of the triangle. (around 1365-1368 max to max)
All in all its a wait and watch situation for few more days how the wave e unfolds.
Disclaimer. I am not the SEBI registered member. This idea is only for educational purposes, if you want to take a trade do your own analysis and decide.

#Nifty directions and levels for January 20th, Tuesday:Good Morning, friends! 🌞
Here are the market directions and levels for January 20th, Tuesday:
Market Overview:
The global market is showing moderately bullish sentiment (based on the Dow Jones), while our local market reflects a bearish sentiment. Today, the market is likely to open with a neutral to slightly gap-up start, as the Gift Nifty indicates a +50-point positive opening.
In the previous session, our markets closed negatively, while the US market performed very well. Everyone is closely watching Donald Trump’s inauguration. Some expect the market to maintain its bearish sentiment for another one or two days. However, if there is any positive trigger, a bounce-back can be anticipated. Otherwise, the correction is likely to continue.
Structurally, my expectation is that if the market takes a pullback, we can expect a range-bound market with a bullish bias. If the pullback sustains, the market could break out and move higher. On the other hand, if the gap-up doesn’t sustain, we can expect the correction to continue. This forms the basic structure for today.
Both Nifty and Bank Nifty exhibit similar structural sentiments.
Nifty Current View:
The current view suggests we are in a range market. If the pullback sustains, we can expect a minimum target of 23330 to 23360. After that, if it breaks with some consolidation, it could continue to reach 23387 to 23431. However, after this rally, the market may experience some rejection around that range; this is the basic structure.
In this scenario, if the rally sustains without any rejection, it may form a long bullish candle at the market’s opening.
Alternate View:
The alternate view suggests that if the gap-up doesn’t sustain, we can initially expect a minor correction that could reach 23121 to 23087. This is also a range market target. After that, if it finds support there, the range market may continue. On the other hand, if it breaks below, the correction will likely continue.
Note: A notable point is that we are in a range-bound market, so approach the charts with this context in mind.

#Banknifty directions and levels for January 20th, Tuesday:Bank Nifty Current View:
The structure seems similar to Nifty. If the market sustains the gap-up, we can expect a minimum pullback of 50% to 61% initially. After that, if it consolidates, the rally will likely continue. Structurally, we can expect the continuation of the rally; however, we should approach this properly, as we can expect the rally only if it breaks the 61% mark.
Alternate View:
The alternate view suggests that if the gap-up doesn’t sustain, we can expect a correction of 78% to the minor pullback zone. This is a major support level, so if it finds support there, we can expect a minimum pullback of 23% to 38% in the minor swing. On the other hand, if it breaks the minor pullback zone, we can expect the continuation of the correction, targeting a minimum of 47873 to 47708.
Reliance Industries ltd - Finally sign of reversal!The current price action suggests that the market has reached a potential bottom, characterized by a reversal from a previous downtrend. This shift is confirmed as the price breaks upwards, moving decisively past a phase of consolidation or uncertainty.
The Diamond Bottom pattern , a notable reversal formation, typically emerges after a sustained downtrend. Initially, the price action expands, forming higher highs and lower lows, creating a broad, widening shape. This phase indicates increased volatility and uncertainty in the market. As the pattern progresses, the trading range begins to contract, signifying a shift in market sentiment. The highs cease to climb, peaking out, while the lows start to rise, indicating a potential buildup of bullish momentum.
The critical point in this pattern is the breakout above the narrowing boundary lines of the diamond. This upward breakout serves as a strong signal of a trend reversal, marking the transition from a downtrend to a new upward trajectory. Such a breakout often leads to a sustained bullish trend, supported by renewed buying interest and positive market sentiment. This reversal can be a significant opportunity for traders to capitalize on the shift in market direction.
Other Positive Things
[ b]ABC pattern seems to be complete as there is divergence in MACD , after which price to move at-least min 38.2% to 61.8% of Fibo levels
DMI in verge of moving positive direction
PLEASE NOTE THAT:
This chart analysis is only for reference purpose.
This is not buying or selling recommendations.
I am not SEBI registered.
Please consult your financial advisor before taking any trade.

Trent!! Zudio, bas ab kitne dukan khologe?Trent Ltd is engaged in retailing a wide range of products including apparels, footwear, accessories, toys, games, food, grocery, and non-food items through various retail formats and concepts.
Technical Analysis: A bearish pattern has been identified in Trent Ltd's stock. The trend has shifted from Higher Highs and Higher Lows (HH-HL) to Lower Lows (LL) and Higher Lows (HL) on the weekly time frame, indicating a potential change in trend. This suggests a possible significant decline from the current levels.
Entry : 6935
Target : Mentioned
Stop Loss : 7576
Let me know your thoughts on my analysis and follow for more chart insights.

Bank Nifty - Is this A Rising Wedge from 47898 As discussed early morning .... 49000 was our key & psychological level ... Index dropped & came close to 48500-48600 zone
Falling From 49000 Level
Support Zone 48500-48600
Makar Sankranti marks the Sun's transition into Capricorn and the beginning of an auspicious period. Historically, equity markets turn optimistic post-Makar Sankranti, driven by cultural sentiment and Budget expectations. Will Budget 2025 keep the trend alive? 🌞
This comes after a 26-day fall in major benchmark indices, which started on 5th Dec 2024.
In the last two days, the index surged from 47,898 to 49,000. However, during the first half of today's session (15th Jan 2025), it fell below 49,000, hitting a low of 48,522 as shown in the snapshots

#Nifty directions and levels for January 14th, Tuesday:Good Morning, friends! 🌞
Here are the market directions and levels for January 14th, Tuesday:
Market Overview:
The global market is showing bearish sentiment (based on the Dow Jones), and our local market is reflecting a similar outlook. Today, the market is likely to open with a gap-up start, as the Gift Nifty indicates a +130 point positive opening.
> In the previous session, the market moved violently, but the evening session in the US market saw a solid pullback. Structurally, this happened in a bearish market, so it still seems to be in a bearish trend. However, this pullback may reduce the momentum. So, my opinion is:
> If the gap-up sustains, we can expect a 50% to 61% pullback in the minor swing.
On the other hand, if it doesn’t sustain, then it could consolidate between the previous low and today’s opening price.
This is the basic structure. Let’s look at the chart.
Both Nifty and Bank Nifty have the same structural sentiment.
Current View:
The current view, based on the structure, is that as per the long correction, this kind of gap-up might not sustain.
> If the initial market declines, it could consolidate between the previous low and today’s opening price, or to the 38% resistance level.
> After that, if it breaks the previous low, then the correction will likely continue.
Alternate View:
The alternate view says:
> If the gap-up sustains or if it breaks the major resistance at 38% with a solid candle, then it could reach a minimum of 50% to 61% in the minor swing.

#Banknifty directions and levels for January 14th, Tuesday:Current View:
The current view, based on the structure, is that as per the long correction, this kind of gap-up might not sustain.
> If the initial market declines, it could consolidate between the previous low and today’s opening price, or to the 38% resistance level.
> After that, if it breaks the previous low, then the correction will likely continue.
Alternate View:
The alternate view says:
> If the gap-up sustains or if it breaks the major resistance at 38% with a solid candle, then it could reach a minimum of 50% to 61% in the minor swing.
