Leading Diagonal to Double Zigzag – Jio Financial’s Full CycleFrom the lows of ₹198.65 , the stock kicked off with a classic leading diagonal — an overlapping structure, exactly how impulsive moves often begin when sentiment is still uncertain. This marked the start of a larger impulsive advance.
Post the Wave 2 low at ₹203.10 , price surged into a powerful Wave 3 rally toward ₹338.30 . Momentum confirmed the strength of this move, with RSI overshooting well into the overbought zone , validating the impulsive nature of the advance.
The rally ended with Wave 5 topping marginally above Wave 3 , but momentum failed to confirm the new high. A clear bearish RSI divergence signaled exhaustion near the top.
Since then, price has transitioned into a W–X–Y double zigzag correction , unfolding neatly within a well-aligned descending channel . Typically, such structures resolve with an upside breakout, but markets don’t always follow the textbook.
Instead, price has broken below the channel and is now sitting exactly at the 0.618 Fibonacci retracement of the entire impulse near ₹252 .
From a momentum perspective, RSI is deeply stretched and hints at a possible relief bounce . If that bounce materializes, it is likely to be corrective in nature — potentially a retest of the broken channel — before one final leg lower.
The ideal structural path would be:
A short-term bounce to cool off RSI
Followed by a final Wave (v) decline below ₹252.25
Ideally accompanied by bullish RSI divergence or a clear bullish reversal candlestick
Such a move would complete Wave (c) of Y , thereby finishing the broader W–X–Y corrective structure . The correction is expected to terminate near the major pivot support zone between ₹236 and ₹228 , just above the 0.786 Fibonacci retracement .
For now, this remains a wait-and-watch setup .
Patience is key rather than bottom fishing . Let price action confirm strength — meaningful reversals usually come with clear signals, not guesses.
Disclaimer:
This analysis is for educational purposes only and does not constitute investment advice. Please do your own research (DYOR) before making any trading decisions.
Elliott Wave

BEL in a Contracting Triangle — Wave 5 Loading?From the ₹240.25 low , Bharat Electronics Limited delivered a powerful upside rally , completing a higher-degree Wave 3 near ₹436 . The advance was strong, extended, and impulsive , clearly establishing the larger bullish trend.
Post the Wave 3 peak, price did not reverse impulsively . Instead, it shifted into sideways consolidation , suggesting a time-wise correction rather than price-wise damage . This behavior fits well with a Wave 4 contracting triangle , a common pause before the final leg of an impulse.
Structurally, the consolidation aligns with an A–B–C–D–E triangle , with price now appearing to be in the final leg — Wave (E) . This leg is expected to unfold as a 3-wave corrective decline (A–B–C) , terminating near the rising A–C–E trendline . A brief throw-under below this trendline remains structurally acceptable and should not be mistaken for a breakdown.
Trade Structure (Execution Focus)
The preferred entry lies near the A–C–E trendline , only if price prints a bullish candlestick pattern , indicating completion of Wave (E).
Invalidation is clearly defined below the low of Wave (C) .
If the triangle resolves as expected, a breakout would signal the start of a higher-degree Wave 5 , with upside potential beyond the Wave 3 high near ₹436 .
Fundamentally, recent order inflows support the broader bullish context , but this remains a structure-led setup , where price confirmation matters more than headlines .
In summary , Wave 3 is complete , Wave 4 is maturing , and Wave (E) completion is the final checkpoint before the next directional move.
Disclaimer: This analysis is for educational purposes only and does not constitute investment advice. Please do your own research (DYOR) before making any trading decisions.

NIFTY 50 – Elliott Wave Update (Daily) - 23 Jan 26Following the September 2024 – April 2025 corrective phase, NIFTY began forming a new impulsive structure on 7 Apr 25.
There is a high probability that Wave 5 of this new impulse has completed, based on the following observations:
Wave 1 unfolded as a brief two-candle advance, followed by Wave 2, which retraced approximately 35%, maintaining impulsive characteristics.
Wave 3 developed as an extended five-wave structure and ended on 30 June 2025, reaching 3.414× the length of Wave 1.
The subsequent Wave 4 formed a zigzag correction, retracing nearly 40% of Wave 3, and concluded on 29 August 2025.
Presumed Wave 5 again unfolded as a five-wave sequence and terminated on 5 January 2026, at 50% length of the entire Wave (1–3).
Incidentally, the new impulse wave has peaked at similar levels of previous impulse. With the completion of this impulse, NIFTY has entered a corrective phase, the exact structure of which is yet to be identified.
Importantly, the current setup coincides with:
an uncertain global / geopolitical environment, and
corrective phases underway in key NIFTY heavyweights, including Reliance Industries, HDFC Bank, and ICICI Bank.
Conclusion:
Until the ongoing correction resolves and a clearer structure emerges, it may be prudent to avoid long positions in NIFTY.

Reliance Industries – Elliott Wave Perspective (Daily)Reliance Industries continues to trade within its higher-degree Wave 3 (Cycle / Primary degree).
Intermediate degree Wave (3) of this larger degree Wave 3 was completed on 8 July 2024, followed by a corrective Wave (4) that ended on 7 April 2025. Since then, the stock has been unfolding a new impulsive structure, which now shows signs of completion.
There is a high probability that Wave 5 of this new impulse has ended, based on the following observations:
Wave 1 unfolded as a simple two-candle sequence, followed by Wave 2, which retraced approximately 35%.
Wave 3 was an extended five-wave structure and concluded on 9 July 2025, reaching 4.414× the length of Wave 1.
The subsequent Wave 4 formed a zigzag correction, retracing nearly 50% of Wave 3, and ended on 1 September 2025.
Wave 5 again unfolded as a five-wave structure and terminated on 5 January 2026, precisely near the 61.8% retracement of the entire Wave (1–3).
Notably, this impulse has peaked at levels similar to the 8 July 2024 high (Intermediate degree Wave 3). Additionally, the stock has now achieved roughly 2× the length of Intermediate Wave 1, further supporting the possibility of intermediate-degree Wave 3 exhaustion.
With the stock now undergoing a correction — the exact structure of which is yet to be identified — risk remains elevated. Also, stock has not met earnings estimates for last 2 quarters.
Conclusion:
Until the ongoing correction completes and a clearer structure emerges, it may be prudent to avoid initiating fresh positions.

NSE FINNIFTY - Price Action BreakdownNSE FINIFTY is trading in the value area for more than 43 weeks. The price has overall three excesses at the upper band and three excesses at the lower band. This signals bull dominance. The control line validates itself with 11 touches.
Traders must look at the following scenario:
1. Price is at the control line, and 200 EMa has worked as crucial support. This is a powerful hurdle and can change the trend. This can reach up to 27500 - 28100 .
2. If sellers outnumber buyers by closing below the control line and EMAs, the next support level would be around 25,926.
We will update further information soon.

BPCL (1H) – Counter-Trend Bounce, Bigger Downside Still OpenPrice action in Bharat Petroleum Corporation Limited (BPCL) is currently unfolding inside a falling channel, suggesting the ongoing move is corrective rather than impulsive.
This channel could allow a short-term upside breakout, potentially completing a W–X–Y corrective structure. However, any such bounce is still viewed as counter-trend and not the start of a fresh bullish sequence.
The key level to watch is 361.30. As long as price remains below 361.30, it does not enter Wave (i) territory, keeping the current bearish Elliott Wave structure valid.
A decisive breakout and close above 361.30 would force a re-evaluation of the wave count.
For now, the bias stays on the short side, with expectations that once the corrective bounce exhausts, price could resume lower to complete Wave (v).
Level that decides everything: 361.30
Until then → rallies look like selling opportunities, not reversals.
Disclaimer: This analysis is for educational purposes only and does not constitute investment advice. Please do your own research (DYOR) before making any trading decisions.

Bank Nifty – Still a Sell-on-RiseStructure remains bearish . The current bounce looks corrective , not a trend change. As long as price stays below 59,594, downside risk toward Wave (C) remains open .
Only a close above 59,594 changes the view.
Disclaimer: This analysis is for educational purposes only and does not constitute investment advice. Please do your own research (DYOR) before making any trading decisions.

IRB: Leading Diagonal ?LD didn't quite make it to the Upper Trendline.
Wave C in progress.
Likely to bottom near 20.
Non-log chart.
Always open to a different perspective.

A Completed Impulse Now Gives Way to Correction in VoltasFrom its inception low near ₹2.60 , Voltas has unfolded a clear long-term 5-wave impulsive advance on the monthly timeframe , culminating near ₹1,994.90 . The structure of this move aligns well with classical Elliott Wave principles, suggesting that a larger-degree impulse cycle has likely concluded .
Following this structural completion, price action has transitioned into a corrective phase . The initial decline fits well as Wave W , unfolding in a zigzag structure . This has been followed by a rebound that appears corrective in nature and can be interpreted as the connector Wave X .
If this interpretation holds, the broader correction may continue with one more leg lower in Wave Y , potentially drawing price toward the 50% Fibonacci retracement zone of the entire impulse. Such behavior would be consistent with a higher-degree corrective process , rather than a trend reversal.
Until the corrective structure is fully resolved, any interim rallies are more likely to be corrective in nature and may be viewed as potential selling opportunities , rather than the start of a new impulsive advance.
At this stage, the focus remains on structure and price behavior , as corrective phases tend to be overlapping and time-consuming . The larger trend remains intact, but patience is required before expecting trend resumption.
Disclaimer: This analysis is for educational purposes only and does not constitute investment advice. Please do your own research (DYOR) before making any trading decisions.

Nifty Analysis for Jan 22, 2026Wrap up:-
Nifty has made corrective abc in last leg and thereafter, breakout above 38.2% is confirmed as Nifty is sustaining above 25193.
What I’m Watching for 22nd Jan, 2026 🔍
Buy Nifty @25168 sl 24919 for a target of 25613.
Disclaimer: Sharing my personal market view — only for educational purpose not financial advice.
"Don't predict the market. Decode them."

Bajaj Finance: When Structure, Liquidity & Catalysts Line UpStructure
The rally from ₹849 to ₹1,102.50 unfolded as a clean 5-wave impulse , clearly establishing the move as directional and non-corrective .
Post the impulse high, price transitioned into a corrective phase , drifting lower within a well-defined descending channel . From an Elliott Wave perspective, the decline fits well into a W–X–Y double zigzag structure, with the current leg likely unfolding as Wave Y — suggesting a mature correction rather than trend damage.
Liquidity
Crucially, Wave Y is now approaching an unfilled gap that aligns closely with the 0.786 Fibonacci retracement of the prior impulse. This convergence marks a potential liquidity zone , where downside momentum may begin to exhaust and responsive buying interest could emerge.
This area warrants close observation for bullish reversal candlestick patterns and/or bullish divergence on RSI , which would strengthen the case for a constructive reaction from this zone.
Catalysts
Adding further context, earnings are scheduled for Feb 3rd , with the Union Budget on Feb 1st — two near-term events that could act as timing catalysts. A positive price response around this liquidity pocket could help transition the structure from corrective to impulsive, setting up a high-quality trade opportunity with a favorable reward-to-risk profile .
Risk Management
Importantly, bullish invalidation lies below ₹849 . As long as this level holds, the impulsive base remains intact, keeping risk clearly defined and asymmetric.
Conclusion
This is a high-context, high-clarity zone where structure is mature, liquidity is in focus, and catalysts are lined up . Upside confirmation from here could unlock a meaningful move, making patience and disciplined observation key.
Disclaimer: This analysis is for educational purposes only and does not constitute investment advice. Please do your own research (DYOR) before making any trading decisions.

Bajaj Finance: Impulse Complete, Correction in ControlBajaj Finance completed a clean five-wave impulsive advance , topping out near ₹1,102.5 , followed by a clear loss of momentum. Since that peak, price action has shifted from trend to overlap , signaling a corrective phase rather than continuation.
Structurally, the decline is unfolding within a descending channel , fitting well with a W–X–Y corrective structure . The internal swings remain choppy and overlapping — classic correction behavior — with price respecting the channel boundaries so far.
During the impulsive rally ( Waves 1–5 ), the 50 DMA acted as dynamic support , confirming strong upside momentum. Post the top, price has slipped below the 50 DMA and is now oscillating around it, indicating momentum fatigue . A sustained hold below the 50 DMA, combined with a rollover in the average , would reinforce the short-term bearish / corrective bias , with the average potentially flipping into dynamic resistance .
From a price projection perspective, the ongoing Wave Y is favoring a move toward key Fibonacci retracement levels . The 0.618 retracement near ₹945 stands out as a high-probability reaction zone , while a deeper flush could extend toward the 0.786 retracement near ₹903 if downside pressure accelerates.
Risk is clearly defined. A sustained break above the upper boundary of the corrective channel would invalidate the W–X–Y interpretation and signal a structural shift back toward strength . Until then, the path of least resistance remains corrective .
Bottom line:
The impulsive phase is done. The market is digesting gains. Structure — not emotion — favors patience and respect for the corrective channel.
Disclaimer:
This analysis is for educational purposes only and does not constitute investment advice. Please do your own research (DYOR) before making any trading decisions.

XAUUSD Beginning Big Elliot Wave 3based on elliot waves counting on the daily timeframe we are currently in wave 2 pullback.
if we have seen the bottom of wave 2 already, the next wave is going to be the big impulse wave 3, with target marked on the chart below.
TLD: Long

XAUUSD (H4) – Liam PlanMacro tailwinds remain, but price is extended | Trade reactions, not emotions
Quick summary
Gold remains supported by a strong macro backdrop:
📌 Fed hold probability in January: 95% → USD/yields capped.
📌 Geopolitical tension (Kremlin praising Trump over Greenland, NATO cracks) adds safe-haven demand.
Technically, price has pushed aggressively into upper expansion territory. At this stage, the edge is reaction trading at key levels, not chasing strength.
Macro context (why volatility stays elevated)
With the Fed very likely holding rates in January, markets are highly sensitive to USD and yield shifts.
Rising geopolitical noise keeps gold bid, but also increases the risk of headline-driven spikes and liquidity sweeps.
➡️ Conclusion: directional bias is secondary to execution quality. Trade levels + confirmation only.
Technical view (H4 – based on the chart)
Gold is trading inside a rising channel, currently extended toward the upper Fibonacci expansion.
Key levels to focus on:
✅ Major sell Fibonacci / wave top: 4950 – 4960
✅ Sell wave B / reaction zone: 4825 – 4835
✅ Buy entry / structure support: 4730 – 4740
✅ Sell-side liquidity: 4520 – 4550 (below structure)
Price is stretched above the mid-channel — conditions where pullbacks and rotations are statistically more likely than clean continuation.
Trading scenarios (Liam style: trade the level) 1️⃣ SELL scenarios (priority – reaction trading)
A. SELL at Fibonacci extension (primary idea) ✅ Sell zone: 4950 – 4960 SL: above the high / fib extension TP1: 4830 TP2: 4740 TP3: 4550 (if momentum accelerates)
Logic: This is an exhaustion area aligned with wave completion and fib extension — ideal for profit-taking and mean rotation, not trend chasing.
B. SELL wave B reaction ✅ Sell: 4825 – 4835 Condition: clear rejection / bearish structure on M15–H1 TP: 4740 → 4550
Logic: Classic corrective wave zone. Good for tactical shorts within a broader volatile structure.
2️⃣ BUY scenario (secondary – only on reaction)
BUY at structural support ✅ Buy zone: 4730 – 4740 Condition: hold + bullish reaction (HL / rejection / MSS on lower TF) TP: 4825 → 4950 (scale out)
Logic: This is a key flip zone inside the rising channel. BUY only if price proves acceptance — no blind dip buying.
Key notes (risk control)
Market is extended → expect fake breaks and sharp pullbacks.
Avoid mid-range entries between levels.
Reduce size during geopolitical headlines.
Confirmation > prediction.
What’s your play: selling the 4950 fib extension, or waiting for a clean reaction at 4730–4740 before reassessing?
— Liam

Buy Dixon, W4 of Primary degree completionDixon completed W3 of Primary degree on 17 Dec 24 and ever since has been undergoing correction / forming W4 of Primary degree. The original thought was it was forming zigzag.
It completed Wave A on 7 Apr 25 and had a very good retracement of over 90% for Wave B (hence a flat) and completed same on 25 Sep 25 and started forming Wave C.
As per wave markings given in the chart, it is likely that stock has completed W5/Wave C at 50% of the overall length of W1-3 and took support at subwave iv of W3 region of the original impulse. This is also a general guideline under wave theory. (W4 tend to register their maximum retracement within the span of travel of the previous fourth wave of one lesser degree, most commonly near the level of its terminus).
Wave C has formed lower low than Wave A of the zigzag
RSI has formed clear divergence
Good support zone.
Buy with a stop loss below of 10,600. Target previous highs (medium term target).

Kalyan Jewellers: Wave Y Still at Play?Disclaimer: This analysis is for educational purposes only and does not constitute investment advice. Please do your own research (DYOR) before making any trading decisions.
Bigger Picture
Kalyan Jewellers topped near 795.40 and has been in a prolonged corrective phase. The structure since then is not impulsive but rather corrective — pointing toward a Double Combo (W–X–Y) correction.
Wave Structure Breakdown
Wave W: A clean zigzag down into 399.40 , completing the first corrective leg.
Wave X: Extended choppy consolidation into 616.00 , best interpreted as a connector.
Wave Y: Currently unfolding as an A–B–C decline . If the pattern holds, another leg lower could complete the structure.
Technical Confluence
Support Zone: 399.40 remains a major demand area , historically respected by price. If retested, it could become the potential accumulation zone .
Projected Trendline Resistance: The descending line from 795.40 to 616.00 may evolve into a key resistance barrier on the next test.
RSI: Recent bounce came from oversold territory — a technical relief rally, not yet a trend change .
Alternate Possibility
If the 442.25 low already marked the end of Wave Y, the current rally could evolve into the start of a new impulsive sequence . Confirmation requires RSI strength above midline (50) and sustained closes beyond the projected descending trendline.
Takeaway
Kalyan Jewellers is most likely unfolding a Double Combo correction (W–X–Y) with Wave Y still in progress. Traders should watch the 399.40 demand zone as a decisive level. Holding it could set up the next bullish cycle, while a breakdown risks a deeper correction toward 336.05.

Tata Consumer Products Ltd – Rising Wedge: Trap or Topping?Price is grinding higher inside a rising wedge , marked by converging trendlines and overlapping structure. This is not impulsive behavior — it fits better as a corrective Wave X , typically seen before the next leg of decline.
Rising wedges often signal distribution, not accumulation. As long as price stays inside the wedge, upside is suspect and slow, not a trend resumption.
The only actionable trigger here is a decisive break below the lower trendline . Until that happens, this remains a waiting game — no hero trades, no early shorts.
If the wedge fails, odds favor a Wave Y decline unfolding next. If price reclaims strength and invalidates the wedge, step aside and reassess.
Patience > prediction. Structure decides.
Disclaimer: This analysis is for educational purposes only and does not constitute investment advice. Please do your own research (DYOR) before making any trading decisions.

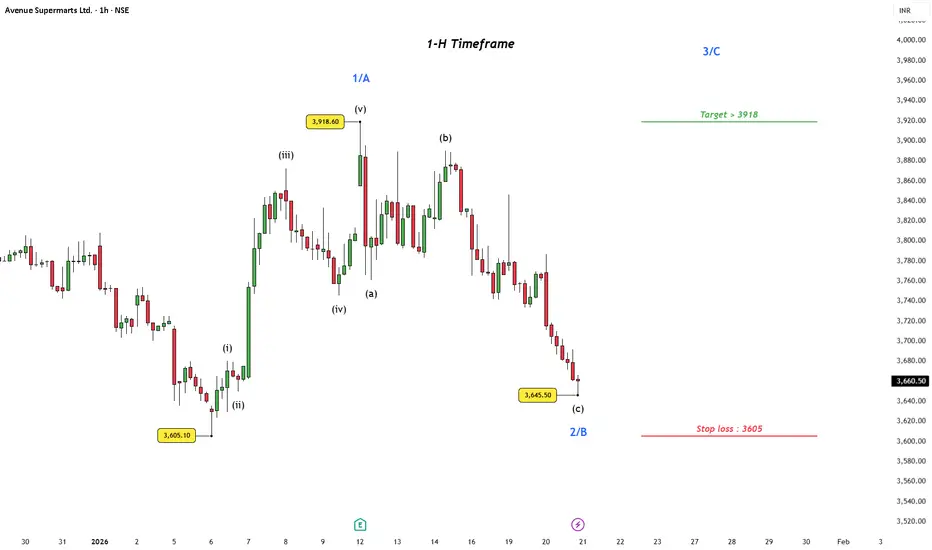
Avenue Supermarts(1-H): Structure Over NoiseToday’s price action was rough across Nifty and the broader market. But beneath the volatility, some charts are quietly holding their structure — and that’s worth paying attention to.
In Avenue Supermarts Ltd , price has unfolded a clean 5-wave advance on the 1-hour timeframe from the 3605.10 low to 3918.60 , allowing the move to be labeled as Wave 1 / A .
The subsequent decline shows a corrective ABC structure , with overlapping price action and weakening momentum — characteristics typical of a correction. The drop into 3645.50 fits well as wave b
, potentially completing Wave 2 / B .
At this point, confirmation of Wave 2 / B completion is still awaited . The bullish structure remains valid only if price continues to hold above 3605.10 on a closing basis . As long as this level is respected, the setup keeps the door open for a potential Wave 3 / C advance , with scope for a retest and possible extension beyond 3918 , offering a favorable reward-to-risk profile .
A decisive close below 3605.10 would invalidate this count and warrant a reassessment.
Disclaimer: This analysis is for educational purposes only and does not constitute investment advice. Please do your own research (DYOR) before making any trading decisions.
Very Short Term View for NiftyWrap up:-
Currently, Nifty is in final wave 5 which was started from 24337 on 08.08.2025. In the pattern of wave 5, Nifty is forming a wxy pattern. Wave w has been completed at 25448 and wave x at 25318 and wave y is expected to be completed in the range of 26630-26868.
In wave y, wave a is completed at 26325 and b is expected to be completed in the range of 25740- 25591; once Nifty breaks and sustains above 25909. Thereafter, Nifty will head towards wave c.
What I’m Watching for 🔍
Buy Nifty in the range of 25740-25591 or on safer side Buy Nifty when it breaks and sustains above 25909 sl 25508 (daily closing basis) for a target of 26630-26868.
Disclaimer: Sharing my personal market view — only for educational purpose not financial advice.
"Don't predict the market. Decode them."

Nifty Analysis for Jan 13-16, 2026Wrap up:-
Wave b of y has been treated as completed at 25473 once Nifty breaks and sustains above 25817. Thereafter, Nifty will head towards wave c of y.
What I’m Watching for 13th to 16th Jan, 2026 🔍
Buy Nifty if it sustains above @25817 sl 25473 for a target of 26029-26103-26263-26373.
Disclaimer: Sharing my personal market view — only for educational purpose not financial advice.
"Don't predict the market. Decode them."

Nifty Analysis for Jan 14 and 16, 2026Wrap up:-
Today, Nifty after breakout above 38.2% level i.e. 25817 retested the breakout and take support at 25636-25601 level and buying is activated in this support zone.
Nifty is currently heading towards wave c of y of 5. In wave C, Wave 1 of c was completed at 25899 and wave 2 at 25603 and now, wave 3 is in progress.
What I’m Watching for Jan 14 and 16, 2026 🔍
Buy Nifty 25636-25601 sl 25473 for a target of 26029-26103-26293.
Disclaimer: Sharing my personal market view — only for educational purpose not financial advice.
"Don't predict the market. Decode them."

Nifty Analysis for Jan 19, 20 and 21, 2026Wrap up:-
Nifty after breakout above 38.2% level i.e. 25817 consolidating in the range 25500-25800. Nifty is currently heading towards wave c of y of 5. In wave C, Wave 1 of c was completed at 25899 and wave 2 at 25494 and now, wave 3 is in progress.
What I’m Watching for Jan 19, 20 and 21, 2026 🔍
Buy Nifty 25507-25577 sl 25473 for a target of 26029-26184-26293.
Disclaimer: Sharing my personal market view — only for educational purpose not financial advice.
"Don't predict the market. Decode them."

Impulse or Correction? One Line DecidesOne of the most common challenges in Elliott Wave analysis is deciding whether a strong rally is an impulse or just a corrective move . This chart of Bharat Forge serves as a practical example of how Elliott Wave rules help remove that ambiguity.
From the ₹919.10 low, price staged a sharp rally that appears to be unfolding as five waves advance. At first glance, this can easily be mistaken for the start of a new impulsive trend. However, Elliott Wave analysis is not based on appearances — it is based on rules .
The key rule illustrated here is straightforward:
In an impulse, Wave 4 must not overlap Wave 1 .
To apply this rule objectively, the chart highlights a Trend Qualification Line at ₹1362.10 . This level represents the termination of the initial advance from the lows to form Wave (1/A) at 1362.10 and acts as a structural divider.
If price moves below ₹1362.10, the overlap rule is violated. In that case, the entire advance from ₹919.10 should be treated as a corrective ABC structure, rather than an impulse. This would imply that the market is still in a broader corrective phase.
If, instead, price holds above ₹1362.10 and later moves above ₹1506.50, the overlap rule remains intact. This keeps the impulsive interpretation valid and allows the move from ₹919.10 to be viewed as a complete five-wave advance, potentially of a higher degree.
Momentum indicators provide useful context but do not define structure. In this case, the RSI dropping below 50 leans toward a corrective interpretation, but it does not override Elliott Wave rules.
Momentum can hint. Structure decides.
This example highlights why clearly defined levels like the Trend Qualification Line are so valuable in Elliott Wave analysis. They shift the focus from prediction to qualification, helping analysts stay aligned with price behavior rather than bias.
