LiamTrading – GOLD: Risk of ABC Correction Wave..LiamTrading – GOLD: Risk of ABC Correction Wave, Short-term Sell at 4028
Hello traders,
Gold has had an impressive growth week, but as prices hit new highs, the risk of correction always increases. Let's examine this week's Gold scenario based on wave analysis and market liquidity.
📊 Technical Analysis (Chart H4 – XAUUSD)
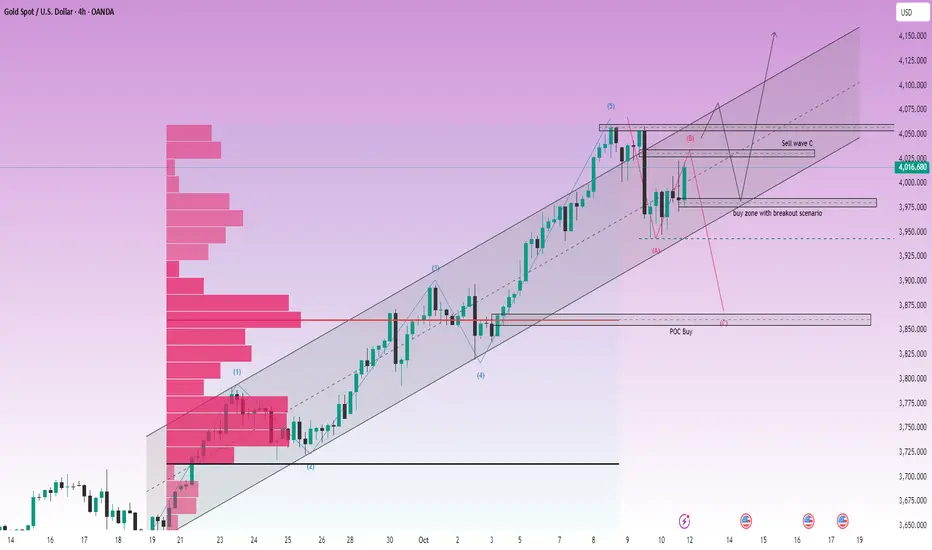
Based on the H4 chart, Gold (GOLD) seems to have completed the Push Wave 5 (Elliott Wave 5) in the current uptrend cycle, reaching strong resistance around 4050–4060.
Current Structure:
The price is within a sustainable Uptrend Channel.
The 4050–4060 range is a significant resistance where selling pressure may emerge.
An ABC correction wave scenario appears after completing Wave 5.
Key Liquidity Zones:
Potential Resistance Zone (Sell Wave C): Around 4028–4033 (Price area to watch for the reaction of the final Wave C).
Confirmed Drop Support Zone: 3972 (Critical price area confirming if selling pressure is strong enough).
Attractive Buy Zone: 3976 (Temporary liquidity if price corrects, waiting for Breakout confirmation).
Long-term Buy Zone (POC Buy): ~3850 (Price area with a huge Volume Profile, ideal for long-term buy orders).
🎯 New Week Trading Scenario
📉 Short-term Sell
This scenario is based on the expectation of an ABC correction wave starting from the resistance zone.
📍 Entry: 4033
🛑 SL: 4040 (Very tight SL, suitable for short-term Sell strategy at the wave peak)
🎯 TP: 3976 → 3943 → POC (~3850)
📈 Long-term Buy
This setup waits for a correction to lower liquidity zones to enter Buy orders with optimal R:R ratio.
📍 Entry: 3976 (Temporary liquidity buy zone)
🛑 SL: 3970
🎯 TP: 4040 → 4090 → 4150
🛑 Failure Scenario (Wait for Breakout Confirmation)
If the price breaks the 4060 peak and creates a new ATH (All-Time High), the ABC wave scenario will fail.
Action: Continue to prioritize Buying. The best entry is to wait for the price to retest the broken liquidity zone (Breakout Retest) around 3976.
🧭 Fundamental & Long-term Analysis
Macroeconomic Sentiment: The Royal Bank of Canada (RBC) forecasts Gold to rise to $4,500 in the next two years, bolstered by long-term inflation concerns. This confirms the long-term uptrend of Gold remains intact.
US Dollar Impact (USD): The traditional view is that USD rises as investors seek liquidity during market stress. However, Gold's rise alongside USD shows the market prioritizes gold as an inflation hedge rather than just a safe haven.
Long-term Strategy: The buy zone at POC (~3850) according to Volume Profile is extremely suitable. Large liquidity here will help traders enter optimal orders and hold long-term, leveraging the pressure from the Seller's Liquidity to push prices up.
📌 Conclusion
Gold is at a critical crossroads. Although the long-term trend is up, the short-term correction risk (ABC Wave) at the 4028–4033 zone is very high.
Priority: Watch for short-term sells at the resistance zone with a tight SL.
Safe strategy: Wait to Buy at liquidity support zones like 3976 or POC (~3850) to optimize risk/reward (R:R).
I will continue to update Gold scenarios daily with insights from 8 years of trading experience.
👉 Follow me to not miss important updates!
Elliotwaveanalysis
CHF/JPY Builds Momentum for Next Wave HigherThe CHF/JPY 1-hour chart shows a completed wave (1) near the 191.17 level, confirming a strong bullish impulse after a previous decline. The pair is now entering a wave (2) corrective phase, which is likely to retrace toward the 188.7–189.0 support zone before resuming the next upward move. This pullback appears to be a healthy correction within the broader uptrend. Once the correction is complete, wave (3) is expected to begin, targeting levels above 193.0 . The overall market structure remains bullish, suggesting that any short-term dips could offer potential buying opportunities for traders waiting for the next impulsive rally
Stay tuned
@Money_Dictators
Thank you.

LiamTrading – Gold: Wave 5 isn't over yet...Gold: Wave 5 isn't over yet, awaiting ABC corrective wave
According to Elliott Wave perspective, gold is currently in wave 5 and no clear reversal signals have appeared. Once wave 5 is completed, a reasonable scenario would be entering the ABC corrective phase.
Technical Analysis
The current price range remains in an uptrend, supported by the medium-term trendline.
Key resistance – support zones are identified based on Fibonacci, Volume Profile, and strong psychological levels.
RSI indicates gold is approaching the overbought region, hence short-term Sell orders (scalping) around the peak area might offer an advantage.
Trading Plan Reference
Sell: 3840 – 3842, SL 3846. This is a strong resistance zone, prioritise scalping if the downward reaction lacks strength.
Buy: 3783 – 3785, SL 3779, TP 3800 – 3818 – 3838.
Large liquidity Buy: 3740, SL 3733, expecting a strong reaction from this area due to previous accumulation volume.
Important Note
Early in the week, there are often numerous political – economic news causing noise, which might unexpectedly push gold up.
The resistance zones 3840–3850 are strong psychological levels, observe reactions before making decisions.
For short-term trading, adhere closely to the plan, while flexibly adjusting when price paths change to maintain an advantage.
In summary, wave 5 is still developing and trading opportunities mainly focus on key resistance – support zones. Traders need to manage risks well, patiently wait for confirmation, and remain flexible to adapt to fluctuations.
The DXY index fell around 97.95 on Monday, extending the decline into the second session as the risk of a US government shutdown weakens market sentiment and investors await a series of important economic data to be released this week.
Wishing you successful trading, follow me and the trading community!

LiamTrading – XAUUSD H1LiamTrading – XAUUSD H1: Adjustment structure formed, awaiting confirmation below 3685
After the surge to 375x, gold is entering a correction phase in line with the structural pattern. On H1, the price clings to the upper edge of the rising wedge, with RSI cooling off from overbought levels, indicating that supply pressure is starting to dominate. Today's plan focuses on the adjustment structure, prioritising selling upon confirmation signals.
Key price zones (as per the attached chart)
Sell strong resistance 3775–3785: confluence of channel top + 2.618 extension. Look for weakening reactions to initiate short/medium-term sell orders.
Buy zone volume 3726–3720: a thin support area providing momentum for a rebound. Holding this zone could push the price to retest 3750–3775; conversely, losing 3720 may lead to a deeper decline.
Resistance + FVG 3715–3698: as the price drops, this area turns into supply; a failed retest here is an early signal for further decline.
Confirm sell 3688–3685: closing H1 below this zone confirms a short-term downtrend, targeting a lower buy zone.
BuyZone 3652–3646: confluence of channel bottom + old liquidity, expecting a strong bullish reaction if revisited.
Reference trading scenarios (adhering to risk management)
Sell reaction at peak: 3778–3783, SL 3792, TP 3755 → 3738 → 3722.
Sell on confirmation: wait for H1 to close below 3685, enter sell 3684–3682, SL 3696, TP 3673 → 3656 → 3648.
Buy scalp by volume: 3726–3720, SL 3715, TP 3738 → 3750 (only short-term if the larger structure remains corrective).
Buy swing at strong zone: 3652–3646, SL 3639, TP 3673 → 3698 → 3712 → 3740.
Operational notes
Prioritise waiting for rejection/closing signals at the mentioned zones; avoid chasing orders in between.
Order volume should be allocated according to confirmation levels (confirmation zone < breakdown < failed retest).
Avoid excessive leverage; adjust SL according to structure when in profit.
This is a personal perspective, not an investment recommendation. If you want the quickest updates on the next XAUUSD scenarios, follow me and join my community for discussions.

SILVERHello & welcome to this analysis
Silver in daily time frame appears to be in its 5th wave.
The larger impulse could end anywhere between $43.50 - 45 / INR 125000 - 129000. From there I expect it to retrace to $38 /INR 116000
MCX Silver will depend largely on $:INR movement.
Silver remains a strong commodity for medium to long term and all dips should be used to add.
All the best

LiamTrading – Long-Term Trend for XAUUSD is Taking ShapeGold continues its robust upward momentum, currently trading around 3,680 – 3,685. After a series of consecutive bullish candles, the price is showing signs of consolidation and slight adjustment, paving the way for crucial scenarios in the upcoming phase.
Technical Analysis
On the Daily chart, the RSI has surpassed the 70 mark, indicating an overbought condition. This is often an early warning sign for a potential correction.
The price structure suggests that the FVG zone of 3,630 – 3,600 will be the first observation point if a short-term correction occurs.
A stronger support zone lies at 3,510 – 3,475, coinciding with Fibonacci levels 0.5 – 0.382, and also the previous resistance area that has been broken. This is considered a potential long-term 'Buy zone'.
If the correction completes, gold has the potential to return to its upward trend with a further target around 3,800 (Fibonacci extension levels 2.618 – 3.618).
Trading Scenarios
Short-term: Monitor the reaction at 3,630 – 3,600. If it holds, there might be a short recovery.
The price area around 3552-3562 should be watched for reactions.
Medium-term: Wait for the price to test the 3,500 – 3,475 zone to find more sustainable buying opportunities.
Long-term: The major trend still leans towards an increase, with an expected target towards 3,800.
This is my personal view on XAUUSD, and you can consider it to build your own plan. If you find it useful, follow me for the latest updates on gold's upcoming scenarios.

XAUUSD – Medium-Term Outlook After Fed Rate CutXAUUSD – Medium-Term Outlook After Fed Rate Cut
Hello fellow traders,
The most anticipated event of September is now clear: the Federal Reserve has cut interest rates by 25 basis points, the first reduction this year. Market expectations also indicate the possibility of another 50 basis points cut in the upcoming meeting. In his speech, Chairman Powell highlighted the “dual risk” – inflation could rise further while employment shows signs of weakness.
Technical View
Gold has formed an H1 candle closing below the rising price channel, signalling a possible violation of the medium-term uptrend.
The buying side failed to maintain momentum after the rate cut news, showing caution in entering at elevated price levels.
Medium-term investors may consider waiting for a lower price to enter fresh longs.
However, the downside is not fully confirmed, as price is still hovering around the ascending trendline → selling directly at current levels still carries certain risks.
Trading Scenarios
Sell Strategy
Scalping: 3676 – 3678 | SL: 3683 | TP: 3666 – 3650 – 3635 – 3628
(Stop loss can be moved to breakeven if price reacts well, to hold positions longer).
Sell Zone: 3697 – 3700 | SL: 3705 | TP: 3680 – 3666 – 3650 – 3635 – 3628
Buy Strategy
Scalping: 3634 – 3636 | SL: 3629 | TP: 3645 – 3660 – 3672
Buy Zone: 3600 – 3598 | SL: 3590 | TP: 3633 – 3645 – 3660 – 3675 (extended)
Conclusion
Gold is currently in a sensitive phase after the Fed’s decision to cut rates. Traders must watch price action carefully around major support and resistance levels to confirm a clearer direction.
Stay tuned to this outlook — I will continue to provide updates as the market structure evolves. Follow along to receive the fastest scenario changes as price action develops.

LiamTrading – XAUUSD OutlookSharing my personal view on the possible next move for gold.
Based on the current chart structure, the wave formation suggests that XAUUSD is most likely in Wave 4. The correction started yesterday after price touched the 3,700 mark – a round resistance level which also coincides with the 1.618 Fibonacci extension. This area often attracts heavy liquidity, and the subsequent pullback further supports the view that Wave 4 has been activated.
At present, the key support to watch is 3,675. If this level breaks, the corrective structure could complete around 3,656. On the H1 timeframe, the RSI has moved below the 30 level, indicating oversold conditions. In my view, while the market remains in this phase, it is still preferable to look for selling opportunities, though patience is needed until clearer confluence signals appear.
Trading plan (short-term focus):
Sell entry 3685–3687, SL 3693, TP 3670 – 3656
Buy entry 3656–3654, SL 3648, TP 3675 – 3690 – 3702 – 3721 – 3740
I will continue to share further updates if there are significant moves in price. Wishing everyone successful and effective trading.

Elliott Wave Analysis & Technical Cross-VerificationsHello Friends, Welcome to RK_Chaarts,
Today, we're going to learn how to validate our Elliott Wave analysis by identifying additional factors that support our directional bias. Once we've plotted our Elliott Wave counts and identified a direction, we want to confirm whether other technical indicators and patterns align with our analysis. This helps strengthen our conviction in our directional bias and provides additional confidence in our trading decisions. Today, we'll explore some key points, including Elliott Wave theory, Exponential moving averages, Trend line breakouts, and Invalidation levels, as well as projected targets. And please note that this post is shared solely for educational purposes. It is not a trading idea, tip, or advisory. This is purely an Educational post.
Elliott Wave Theory structure & wave Counts
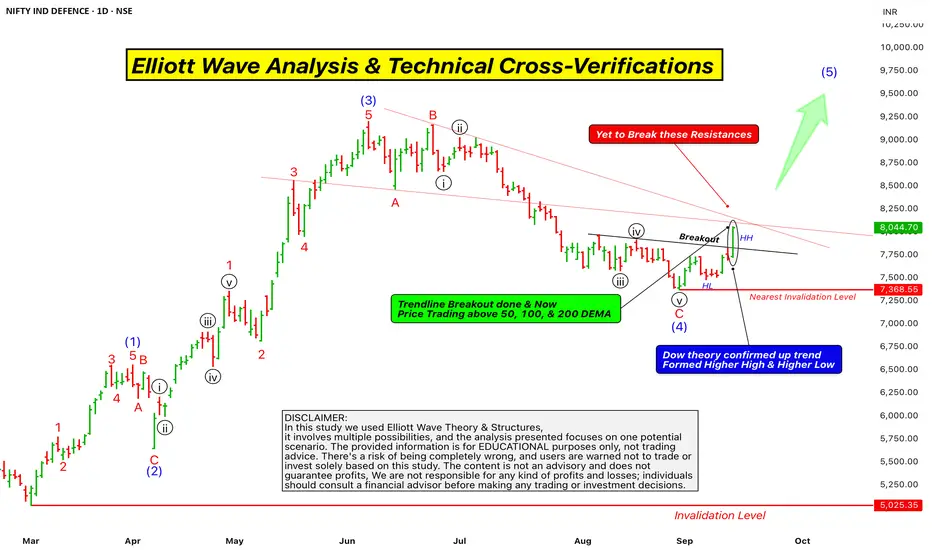
Here chart we are using Nifty India Defence sector, which is an index chart. We are analyzing it using Elliott Wave theory. It's very clear that from the March 2025 bottom, we've identified a clear Wave (1) Wave (2) Wave (3) and Wave (4) and now we've started Wave (5) of Intermediate degree in Blue.
Projections of wave (5)
According to the theory, the projected target for Wave (5) is typically between 123% to 161.8% of the length of Wave (4). So, we can at least assume that the price will reach 123% of Wave (4)’s length, and the price will move higher from here.
Trendline Breakout
The trend line breakout also confirms this. Since Wave (4) moved downwards, Wave (5) should move upwards, indicating a potential upward movement in price. This is a positive signal and a possibility.
Dow Theory confirmation of Trend changed
Additionally, we can see that in the daily time frame, the price has recently completed Wave (4) and formed a higher high, followed by a higher low, and then another higher high, along with a trend line breakout, which we've marked with a rounded ellipse on candle on the chart.
According to Dow theory, this formation of higher highs and higher lows, along with the trend line breakout, indicates that the index has the strength to break through resistance. These two factors strongly support our Elliott Wave projection, which suggests that the price will move upwards. The chart is looking bullish, indicating that a swing has been activated upwards from here.
Exponential Moving Averages
Furthermore, we can see that the price is trading above the 50-day exponential moving average (EMA) in the daily time frame, as well as above the 100-day EMA and the 200-day EMA. These three EMAs are major indicators, and the price is sustaining above all of them. This is also a very good positive sign that supports our view and this scenario.
Supporting Indicators
MACD
RSI
Some Hurdles to cross yet
Finally, we can see that the Zero B trend line, which is coming down from the top, has not been crossed by the price yet, and there has been no breakout. Additionally, we have drawn a trend line connecting the high of the third wave and the low of the fourth wave, which initially acted as resistance and later as support. This trend line is also approaching the same level as the Zero B trend line. So, we have two resistances converging at the same point, which the price has yet to break out of.
This could potentially be a hurdle, and it's possible that according to the Elliott Wave count, Wave (5) will arrive with five sub-divisions, which could lead to a retest of the previous trend line or a Retracement before moving further upwards.
Invalidation Level
According to Elliott Wave theory, the nearest invalidation level is the low of Wave (4), which is currently at 7368, and this level should not be breached. If it is, it will lead to a lower low, which would be an invalidation of the Elliott Wave count.
Overall, the chart of this index looks very promising and bullish. As we all know, the market can be unpredictable, but if this invalidation level is not triggered and the price doesn't break down, then the chart may move upwards with strength. This entire analysis that we discussed is for the Nifty India Defense index chart. Please note that this is not a trading tip or advice, but rather an educational perspective that we shared. Also, keep in mind that the Nifty Defense index is not tradable, but it does provide insight into the market's direction.
This post is shared purely for educational purpose & it’s Not a trading advice.
I am not Sebi registered analyst.
My studies are for educational purpose only.
Please Consult your financial advisor before trading or investing.
I am not responsible for any kinds of your profits and your losses.
Most investors treat trading as a hobby because they have a full-time job doing something else.
However, If you treat trading like a business, it will pay you like a business.
If you treat like a hobby, hobbies don't pay, they cost you...!
Hope this post is helpful to community
Thanks
RK💕
Disclaimer and Risk Warning.
The analysis and discussion provided on in.tradingview.com is intended for educational purposes only and should not be relied upon for trading decisions. RK_Chaarts is not an investment adviser and the information provided here should not be taken as professional investment advice. Before buying or selling any investments, securities, or precious metals, it is recommended that you conduct your own due diligence. RK_Chaarts does not share in your profits and will not take responsibility for any losses you may incur. So Please Consult your financial advisor before trading or investing.
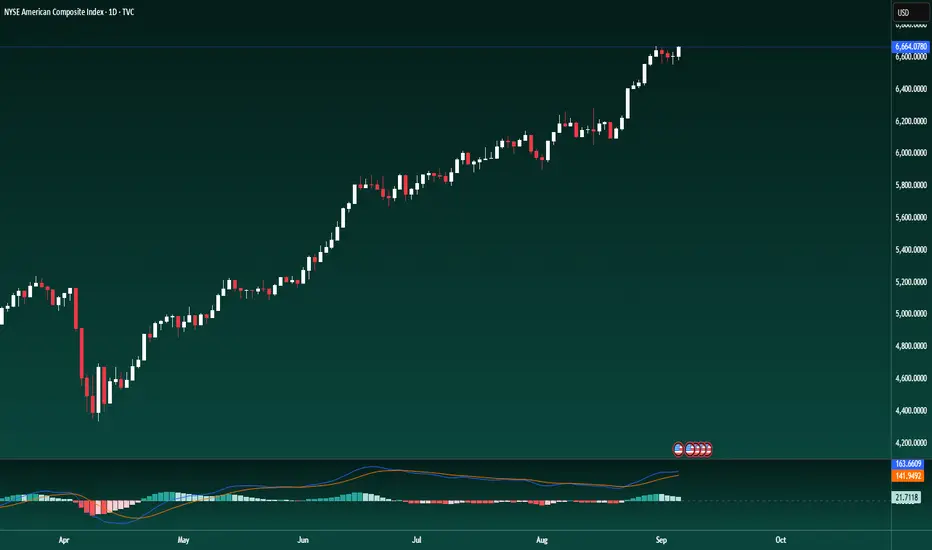
Bitcoin – Trend Update Ahead of PPIBitcoin – Trend Update Ahead of PPI
Hello Traders,
The current scenario for Bitcoin is unfolding in line with expectations, with the uptrend continuing to develop strongly. Price waves are moving with solid volume, and the overall structure is progressing exactly as anticipated.
Key Levels
Price has broken through the 113k zone, confirming that the bullish trend is intact. This move increases the likelihood of completing the final wave of the inverse head-and-shoulders pattern.
The next level to watch is around 116k, where a mild reaction or pullback may occur before the trend resumes higher towards the 121k region.
Special attention should be given to the 117k level, as this marks the potential completion of the inverse head-and-shoulders structure. At this point, price may consolidate before establishing a new primary trend.
Trading View
For now, it remains important to follow the prevailing uptrend. Any shift in price structure will require re-evaluation, and updated strategies should be applied only after clear confirmation.
This is my latest outlook on Bitcoin ahead of the PPI release. I hope this perspective proves useful in shaping your trading approach.

XAUUSD – Latest Trend UpdateXAUUSD – Latest Trend Update
Hello Traders,
Gold is moving in line with yesterday’s outlook: after a corrective pullback towards 3660, price resumed its decline and is currently trending lower. If this bearish structure is confirmed on the higher timeframes such as H1 and H4, it may signal that a larger corrective phase on the D1 chart has already begun.
Key Levels to Watch
3620: Marked as an important support zone from yesterday, now considered the key level to confirm continued downside.
3630: Aligned with the lower boundary of the ascending channel, where a reaction could occur before the trend direction becomes clearer.
Medium-Term Scenarios
Gold could decline towards 3550, before bouncing higher again – this is the preferred medium-term scenario.
A deeper move towards 3510 is also possible, where liquidity from previous candle wicks may be retested, before the broader uptrend resumes on the daily timeframe.
The reason for favouring this medium-term downside: price has already completed the Fibonacci Extension 2.618, which often signals the potential for a corrective pullback.
Trading Strategy
Observe reactions around 3630 – 3620 – 3610 for potential buy opportunities aligned with the broader bullish structure.
Sell setups should only be considered if price closes firmly below 3620, confirming further downside momentum.
This is my trading plan for gold today. Use it as a reference and feel free to share your own perspective in the comments.

RELAXO SMART MONEY ENTERED UPMOVE EXPECTEDRELAXO SMART MONEY ENTERED UPMOVE EXPECTED
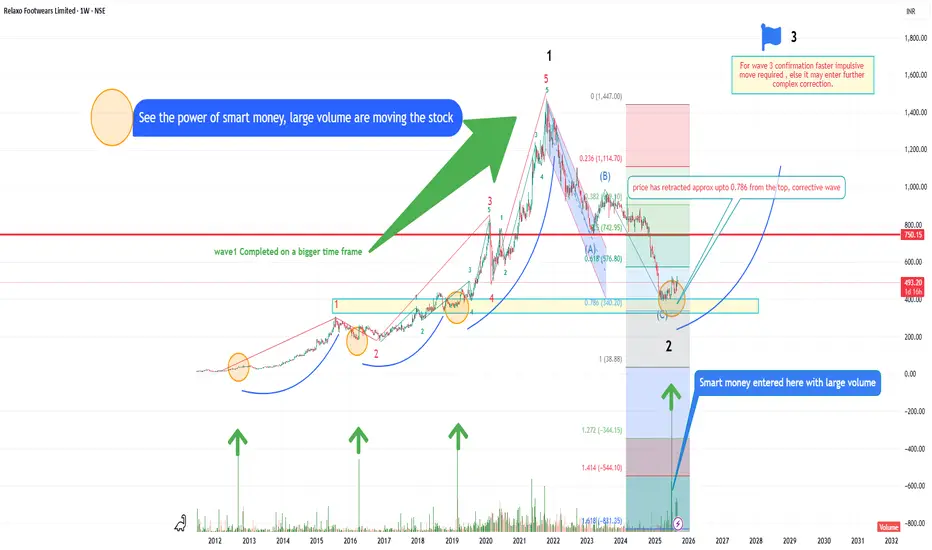
In this one can clearly See the power of smart money, large volume are moving the stock at every point from past
Wave1 Completed on a bigger time frame
Wave 2 Corrective wave retraced approx 0.786 from the top
For Wave 3 confirmation faster impulsive move required , else it may enter further complex correction.
Let's see how it goes this time .
Elliott wave Rocks
XAUUSD – Trend Outlook Ahead of PPIXAUUSD – Trend Outlook Ahead of PPI
Hello Traders,
Gold has moved close to the Fibonacci 2.618 extension and immediately reacted at this level. Price has already broken through the most recent minor low of the previous uptrend, which in my view indicates a violation of the bullish structure. For a confirmed shift in trend, another leg would be needed to form a more sustainable structure. Still, the basis for a sell bias is already present.
Fundamental Factor
The US PPI data is due today, with forecasts at 0.3% compared to 0.9% previously. If this projection turns out correct, gold could see another strong upward push. However, my view is that the data may not be as weak as expected, so traders should carefully observe the market reaction to the release before making entries.
Key Levels to Watch
3660: This level could be tested again and provide another reaction before a potential downward move begins. It remains the most attractive zone for initiating sell positions.
3318: Should gold confirm a Dow-style lower structure and break past old support, the deeper downside target may lie around this region.
Trading Strategy
The main strategy for today is to look for sell opportunities:
Best entry area: around 3660, if price retests and reacts.
Strong confirmation: once a candle closes below previous support, short positions can be taken with targets further down.
For intraday traders, scalping opportunities may be considered within the corrective range left from the US session yesterday, as the market redistributes price action.
This is my outlook on gold for today – use it as a reference and align it with your own strategy.

Bitcoin – Current Trend UpdateBitcoin – Current Trend Update
Hello Traders,
Bitcoin continues to follow the structure of an inverse head-and-shoulders pattern, which has not yet been invalidated. After testing the 113.5k zone, price once again reacted lower – this marks the third rejection at this level, confirming it as a key resistance area. For BTC to sustain its bullish momentum and complete the final wave of the formation, this zone will be crucial.
Scenarios to Watch
Bullish Case: The uptrend remains intact as long as price holds above 109k. In this case, buying opportunities are still valid.
Bearish Case: A sustained close below 109k would invalidate the bullish outlook and activate a bearish scenario. Traders should wait for confirmation before committing to shorts.
Short-Term View
On the lower timeframes, BTC is moving within a sideways range. For intraday traders, range strategies such as buying near support and selling near resistance can still be applied until a clear breakout occurs.
Market Sentiment
At the moment, most of the market’s attention is shifting towards gold, leaving Bitcoin with relatively lower momentum. This may keep BTC trading in a tighter range, so traders should lower expectations for strong volatility in the immediate term.
This is my trading outlook for today. Use it as a reference and feel free to share your own perspectives in the comments.

XAUUSD – Early Week Trading ScenarioXAUUSD – Early Week Trading Scenario
Hello Traders,
The Asian session opened the new week with mild fluctuations in gold, followed by a pullback into the major liquidity zone created during last week’s bullish wave.
At present, price is showing signs of breaking below the 3585 support. If a strong M15 candle closes under this level, it can be considered a short-term correction signal. In that case, a light sell position may be initiated, targeting the 3560 zone.
The 3560 level stands out as a reliable support, aligning with the ascending trendline. This makes it a key area for buying in line with the prevailing uptrend, with the potential for price to extend higher and even revisit its all-time highs. However, if price climbs back to retest the trendline, any short positions from that area should be approached cautiously and only with clear confirmation.
Another potential buy zone lies near 3516, where the market previously cleared the liquidity from the closest FVG.
Overall, gold is likely to require some corrective moves before continuing its broader trend. In particular, short trades should only be considered when the reversal structure is clearly validated.
This is my trading perspective for gold today. Please take it as a reference for your own strategies.

VIPIND UPMOVE Classic Elliott wave VIPIND UPMOVE Classic Elliott wave
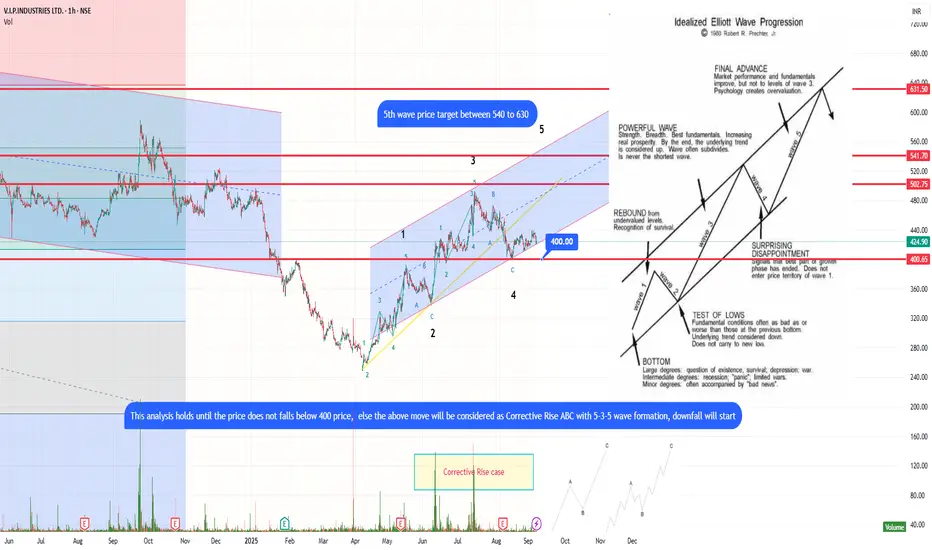
Idealised Elliott wave in progression Wave 4 completed, 5th wave projected target between 540 to 630 price.
This analysis holds valid till price does not fall below price 400, else the move will be considered as corrective rise ABC with 5-3-5 wave formation, further correction will come prices will fall.
Let's wait and watch.
Trade with due deligence.
XAUUSD – Week 08/09 to 12/09, Focus on CPI & PPIXAUUSD – Week 08/09 to 12/09, Focus on CPI & PPI
Hello Traders,
Gold delivered a strong rally last week, consistently printing new highs on a daily basis. While this is not unusual, it has introduced caution in the market. Investor sentiment continues to lean heavily towards buying gold, underlining its importance as a safe-haven asset.
Fundamental Outlook
In the coming week, the release of US CPI and PPI data will be a key focus. These indicators will provide important insight into the financial health of the US economy and could directly influence the Fed’s decision on a potential rate cut in September.
Technical Perspective
Gold has already broken through the Fibonacci 1.618 level, with the next target aligning around the 2.618 extension near 3687.
Before reaching this zone, a mild correction at FVG (Fair Value Gap) areas cannot be ruled out.
For the long term, the zone around 3467 – 3475 is considered a strong buying region, supported by the confluence of FVG, Dibo, and Volume Profile.
Trading Strategies
Bullish Priority: Long positions remain favored. The 3467–3475 zone offers an attractive entry for longer-term buyers.
Bearish Condition: Short opportunities should only be considered if there is a confirmed reversal structure, with price breaking below 3510 or showing rejection signals near the 2.618 Fibonacci level.
Conclusion
For the upcoming week, gold remains a buy-on-dip market. Traders should closely monitor reactions at key levels, while staying flexible with short-term strategies as intraday updates unfold. Proper risk management remains crucial given the upcoming macroeconomic data releases.
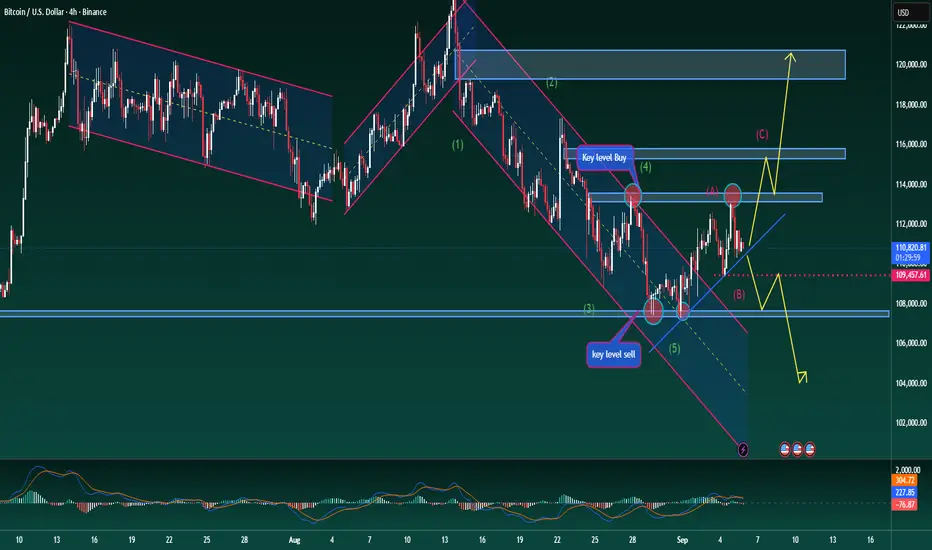
Bitcoin – H4 Mid-Term AnalysisBitcoin – H4 Mid-Term Analysis
Hello Traders,
Bitcoin continues to trade within a wide sideways range. Despite the spike in volume following the recent NFP release, the market has not yet confirmed a dominant trend. Price action is still rotating within the 107k – 113k zone.
Elliott Wave Perspective
Wave 5 appears to have completed, and an A–B corrective structure is taking shape. This opens the possibility for one more upward leg before the next decisive move develops.
Trendline & Key Levels
A descending trendline is currently acting as resistance. It may offer early short opportunities, though a clear break below 107k is required to confirm a mid-term bearish outlook.
On the flip side, if price respects the trendline and bounces higher, a wave C rally could unfold.
Importantly, BTC is still holding above the rising channel, suggesting that bearish momentum remains limited for now.
Scenarios to Watch
Bullish Case:
If Bitcoin sustains above 107k and manages a breakout above 113k, momentum could extend towards 115k – 118k. Long positions can be considered once confirmation comes from stronger volume or a MACD crossover.
Bearish Case:
Failure to hold above 107k would expose the market to further downside, targeting 104k – 101k where strong historical support is located.
Professional Take
The market remains indecisive in the mid-term, with no clear directional bias yet. Traders should closely watch the reaction at 107k and the descending trendline to determine the next move. Flexibility and strict risk management are essential in this phase of heightened volatility.
LICI Recovery StartedLICI
Right time to catch the rally
Wave 3 formation started,
impulsive move can be seen
Wave 1st of Wave 3 undergoing, long way to go.
Elliott wave Analysis.
Make position with due diligence.

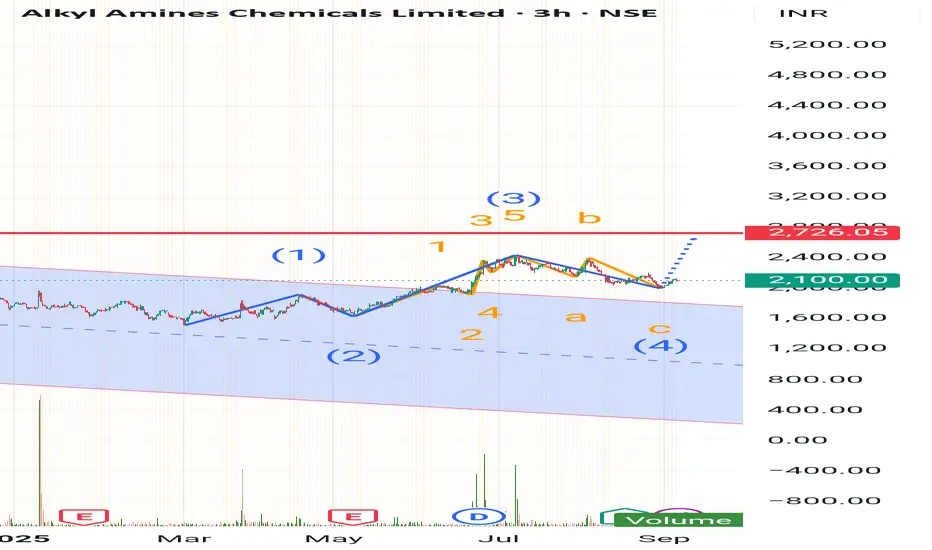
ALKYLAMINE PULL BACK after Correction ALKYLAMINE PULL BACK after Correction
After deep correction, there is impulsive move
Further there is one leg left in impulsive move ,can be benefited.
After 4 th wave, 5th will come.
Elliott wave Analysis.
XAUUSD – Has the Downtrend Really Started?XAUUSD – Has the Downtrend Really Started?
Hello traders,
Gold is now showing signs of a corrective move lower. Price has already dropped by nearly 40 dollars, signalling that selling pressure is starting to build. Traders are accepting lower prices at this level, but to truly confirm a bearish shift, we need to see price action around the 3530 zone, which acts as a key level for validation.
On the higher timeframe, gold has rallied almost 250 dollars (2500 pips) in just two weeks, a very strong bullish run. However, with the upcoming NFP release today and tomorrow, the market could redistribute liquidity. Current forecasts suggest weak NFP numbers, and if that plays out, gold may still push higher – but this remains speculative.
Trading strategy for now:
Short entries: around 354x, aiming for a medium- to long-term move lower.
Potential buy zones: watch for reactions at the FVG liquidity gaps around 3510 – 3460 – 3430, where strong demand previously created imbalances.
For now, my outlook remains medium-term short, while staying flexible around key liquidity levels. Take this as reference, and share your views in the comments – let’s discuss together.

Bitcoin – Bearish Scenario Moving as PlannedBitcoin – Bearish Scenario Moving as Planned
Hello traders,
BTC is moving exactly in line with the plan, reacting well within the channel and showing a pullback at the retest of the rising trend. Hopefully many of you managed to catch the short signal shared earlier.
Following the current momentum, BTC is holding well on the downside. The short position can be maintained in the medium term, with the next long zone expected around 105k.
On higher timeframes, BTC still remains in a broader bullish structure, with potential for higher targets from long-term buy zones. However, current market sentiment shows much of the liquidity flowing into gold, so BTC may move more slowly in the short run.
This is my next trading outlook for BTC. Take it as reference, stay patient, and manage your trades with discipline. Do share your views in the comments.

XAUUSD – Is Fibo 1.618 Strong Enough to End the Rally?XAUUSD – Is Fibo 1.618 Strong Enough to End the Rally?
Hello traders,
Gold has now posted six straight daily gains, showing the strong momentum behind this buying wave. This reflects the current sentiment in global markets, where gold continues to be treated as one of the most important safe-haven assets amid ongoing tariff discussions and a flood of news.
Part of this move has been driven by speculation around former US President Trump. While the news itself is unclear and not fully verified, it has been enough to influence global financial markets and push gold higher in recent sessions.
From a technical perspective, gold has already broken out of its daily trend channel and extended strongly higher. Right now, price is pausing around the Fibonacci 1.618 extension at 3536, which is acting as a dynamic resistance. If a bearish structure forms on the M15 timeframe, a short entry could be activated at this level.
Short scenario: Watch 3536 – if bearish confirmation appears on M15, short positions may be considered.
Buy scenario: The broader uptrend remains intact. A retest of the previous highs at 3500–3505 could offer a strong long entry for the medium to long term.
From a market psychology standpoint, this price area will be closely observed: buyers have already taken profits, while sellers have been partially liquidated. This means lower timeframes will be crucial for spotting clean entries.
This is my view on gold for today. Take it as reference, trade with discipline, and share your thoughts in the comments.
