XAUUSD – Sell Strategy ActivatedXAUUSD – Sell Strategy Activated
Hello traders,
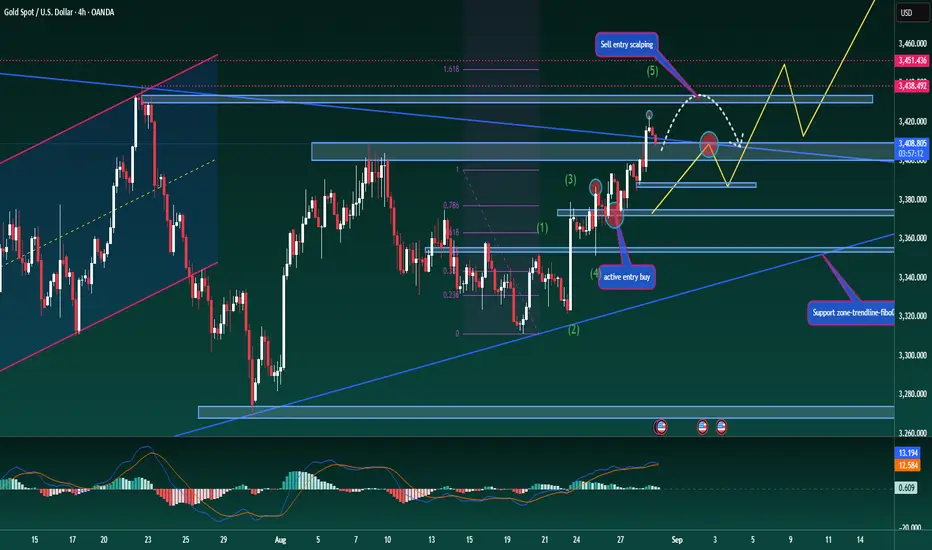
Gold has followed the expected scenario, reacting precisely around the 3508–3510 zone. This correction is a good signal to consider a bearish outlook. However, for a clearer confirmation, price needs to close an M15 candle below 3466. If that happens, the previous bullish wave will be considered invalid, giving a stronger probability for the Sell setup.
Structurally, gold is still within the main rising channel, which means an early short entry should wait until liquidity from the small FVG zone above is fully taken.
Technical indicators are supporting this view:
MACD has shown consistent bearish momentum in the last 4 H1 candles.
Several indicators are already showing divergence, pointing to weakening bullish strength.
Sell zone to watch: around 3488–3491.
Setup invalidated if price breaks above the nearest resistance.
At this stage, the appetite for new long positions is fading, and buying at these levels carries greater risk. Remember, no trend moves in one direction forever – for price to reach higher targets, secondary corrective moves are necessary.
This is my trading scenario for gold in the coming sessions. Take it as reference and share your thoughts in the comments.
Elliotwaveanalysis

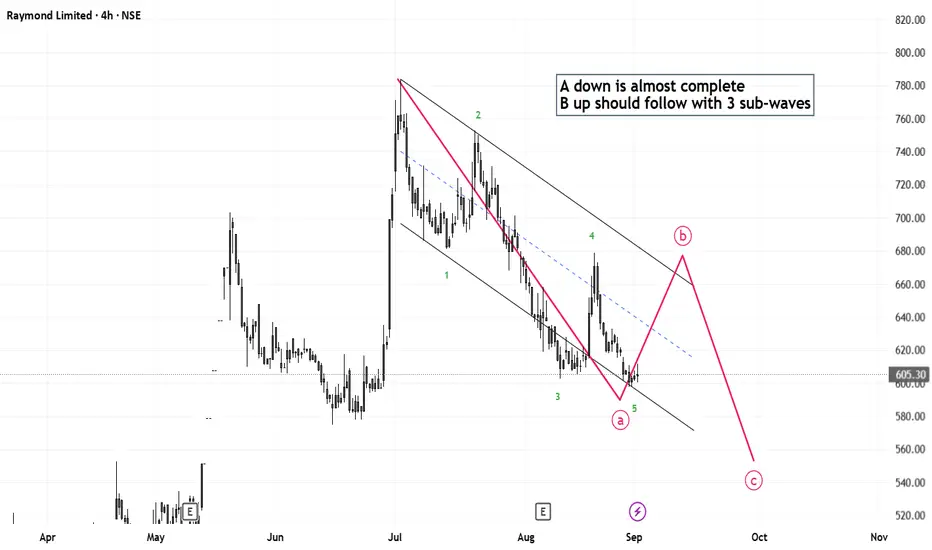
Elliott Wave Analysis of Raymond Limited RAYMONDThe script has completed 5 waves down with RSI divergence and now B up should be next and then C down to complete the corrective structure. This is on hourly frame.
Bitcoin – Technical Outlook for the New WeekBitcoin – Technical Outlook for the New Week
Hello traders,
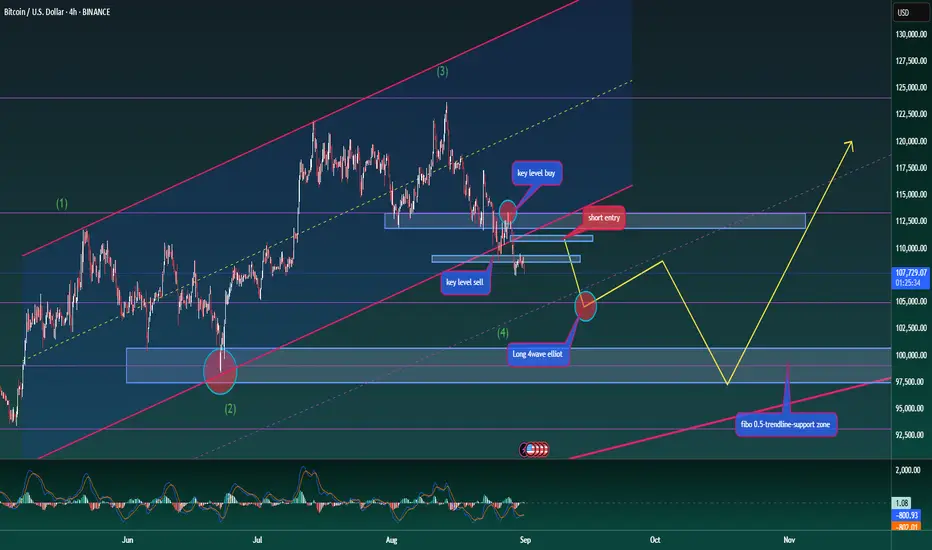
BTC continues to follow the expected path. On the chart, price has held steady after breaking down from the rising channel, and the medium-term bearish structure on the H4 timeframe remains in play.
For the longer term, we would still need to see breaks of major supports on higher timeframes to confirm that deeper downside is possible. But for now, the structure remains unchanged from my previous analysis.
Short zone: still valid around 111k
Long zone: still valid around 105k
As the new week begins, BTC may consolidate further for another 1–2 sessions to build liquidity before showing its next clear move.
This is my updated technical view for BTC – take it as reference, and plan your trades with discipline. What’s your outlook for this week? Share your thoughts in the comments.
Gold Trading Scenario – Start of the WeekGold Trading Scenario – Start of the Week
Hello traders,
A new week begins with gold holding above the 34xx zone, establishing a fresh value area. The current structure has already broken through major resistance levels on the higher timeframe – including trendline and H4 barriers – confirming strong bullish momentum.
The uptrend played out exactly as expected, reaching the target around 3450 (specifically 3454). Now price is seeing a mild pullback. This will only be considered a trend reversal if price breaks below 3404. Otherwise, it is just a secondary correction as per Dow theory.
Wave 5 may be complete, but the ABC structure is still unclear. For that reason, the plan is to continue with long positions in line with the trend, which increases the probability of success.
Buy zone for today: 3408–3412, an area where sellers previously failed at resistance and which was broken through the trendline on Friday.
This is my outlook for Monday, viewed from a medium-term perspective. Take it as reference, and feel free to share your thoughts in the comments.

Bitcoin Confirms Downtrend – Short Setup ActivatedBitcoin Confirms Downtrend – Short Setup Activated
Hello traders,
BTC is showing clear bearish momentum as it has broken below a key support level and also dropped out of the rising channel. With price now trading steadily under this zone, the downtrend is confirmed.
The strategy from here is to wait for a pullback and then enter a short. The 111k level looks like a strong entry zone, as price could retest the broken channel and form a clean Dow structure for the next leg lower.
Short setup: Entry around 111k, with a target at 105k.
Buy opportunity (short-term): Around 105k, traders can also look for a quick Long to capture a reaction move as liquidity is taken and to offset any trapped sell positions.
The primary view in the medium term remains bearish.
This is my outlook on BTC for the sessions ahead. Take it as reference and adjust your trading plan to fit your own strategy.

EURUSD – Wave 5 Long SetupIdea: EURUSD has completed a clean Elliott Wave (1-2-3-4) structure on the 1H chart and is now setting up for the final Wave (5) push to the upside. Price has broken above short-term resistance and is aiming for the next liquidity zone.
🔹 Entry: 1.16609
🔹 Target: 1.17015 🎯
🔹 Stop Loss: 1.16271 ❌
✅ Reasons for Long Bias:
Clear Elliott Wave progression with Wave 5 in play.
Strong recovery from Wave 4 support zone.
Next resistance aligns with Wave 5 target around 1.1700 psychological level.
Favorable R:R ratio, keeping risk well defined.
⚠️ Risk Management: Always trade with position sizing that suits your account. Stop loss is placed below Wave 4 to protect from invalidation.
📌 Disclaimer
This is purely for educational purposes and not financial advice. Please do your own research before entering any trades.

Bitcoin – Where Could the Short-Term Trend Go?Bitcoin – Where Could the Short-Term Trend Go?
Hello traders,
BTC is currently consolidating strongly around the rising trendline on the D1 timeframe. Price has shown a strong rejection at this level. The overall market structure is still moving in line with the scenario I shared earlier, but I want to update a short-term plan to help optimise trading opportunities.
The upward channel remains key. During this sideways phase, BTC has created a small support–resistance zone, which now acts as a key level to determine the short-term trend and guide entries.
Resistance at 113.3k: A breakout above this level would confirm a Long signal.
Support at 108.8k: A breakdown here would activate a Short signal.
If support is broken, the medium-term outlook shifts towards the bearish scenario I mentioned earlier, with potential downside towards the 9x region. This is supported by the larger timeframe structure, which provides enough basis for that expectation.
This is my current short-term trading plan for BTC. Use it as reference, and share your perspective in the comments so we can learn together.
Gold Trading Scenario – Friday OutlookGold Trading Scenario – Friday Outlook
Hello traders,
Fridays are often challenging for forex traders. As the week closes, bankers wrap up their positions, creating unpredictable market moves. This is especially tricky for those who rely on timing-based strategies, so it’s important to watch the smaller fluctuations closely today.
Looking at the current gold structure, the uptrend remains intact. Buying pressure is strong enough to push towards the next projected levels. Technical indicators continue to support a bullish view, with MACD showing steady momentum as both volume and moving averages remain positive.
From an Elliott Wave perspective, gold is moving in **wave 5**, which is typically an extended wave. This allows us to maintain a bullish outlook unless price breaks below **3386** and confirms with at least one candle close on the M15 timeframe or higher. In that case, the scenario would be invalidated. Until then, buying around this level with a stop-loss just below the key support zone (about 1 dollar lower) remains the preferred approach.
Selling opportunities are not yet ideal, but for those looking at short setups, the **3450 zone** should be monitored as a major resistance. In the shorter term, **3430** can act as a reaction level for temporary sells.
Fridays also tend to bring more news-driven traps, so be extra cautious. It’s a day that can really test less experienced traders.
This is my view for today’s session – use it as reference, and trade with discipline.
---
XAUUSD – Medium-Term Trading ScenarioXAUUSD – Medium-Term Trading Scenario
Hello traders,
Gold is moving into the final stage of its flag pattern. Medium-term traders are now waiting for a clear breakout confirmation, as that will set the direction for the next medium- to long-term opportunities. Once price confirms the break, the strategy is to enter immediately in the direction of the move.
Meanwhile, short-term and day traders continue to trade within the flag, looking for scalping opportunities.
From my perspective, the probability of gold breaking to the upside and continuing the main bullish trend is fairly high after such a long consolidation. To optimise entries, buying near the lower boundary of the trendline makes sense, with stop-losses placed immediately if the pattern breaks down. The key area to watch is Fibonacci retracement 0.5 at 3354, which acts as both dynamic and static support, as well as a strong Fibonacci level. This zone offers a reliable long-term buy opportunity.
Another potential early buy entry sits around 3372, where the previous candle showed strong bullish momentum. Positions here can be taken with tighter stops placed just below the nearest support.
This bullish scenario would only fail if price breaks below the lower trendline and closes firmly underneath it, which would confirm a reversal.
Wishing you success with this setup. If you share the same outlook, leave your thoughts in the comments so we can exchange ideas.

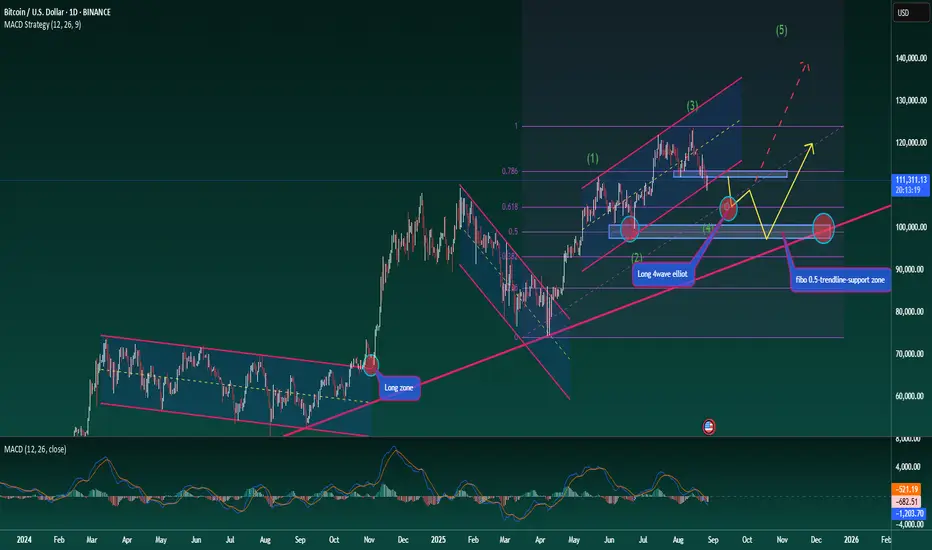
Bitcoin – Long-Term View with Elliott Wave StructureBitcoin – Long-Term View with Elliott Wave Structure
Hello traders,
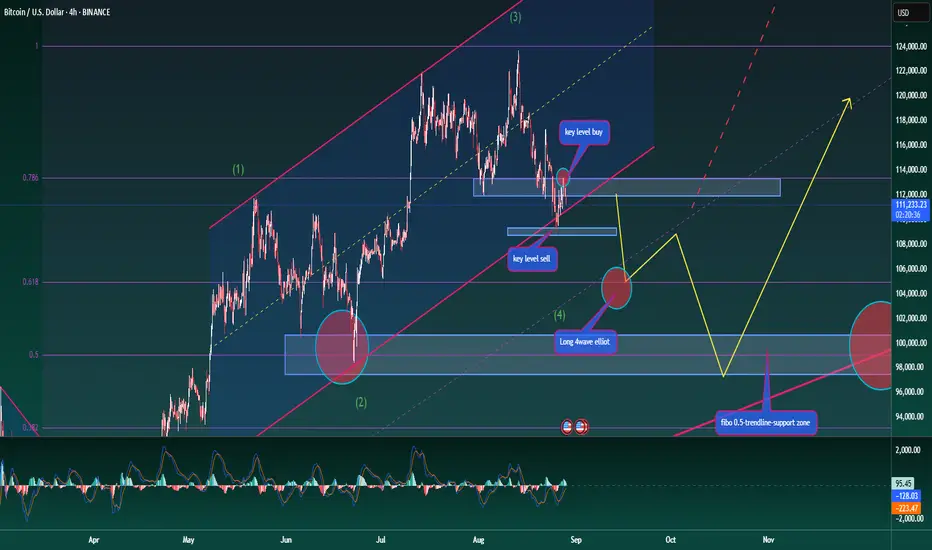
Let’s take a medium- to long-term look at BTC. The broader trend is clearly bullish, but for any uptrend to be sustainable, healthy corrections are necessary. At present, BTC is moving through a corrective phase, identified as wave 4 in the Elliott Wave structure.
To gauge how far this correction may extend before wave 5 begins, we can apply Fibonacci Retracement. Two key levels stand out: 0.618 and 0.5.
At 0.618, we see a strong support zone, but it may not yet be the decisive level for confirming the wave count. If BTC reacts positively here and rallies into wave 5, the Elliott structure remains clean and valid.
At 0.5, the level aligns with an ideal Fibonacci retracement ratio and also shows up as an important structural support on the chart. A break below this could trigger deeper downside, as highlighted by the ascending trendline.
Long-Term Trading Plan
Entry 1: Around Fibonacci 0.618 at 105k
Entry 2: Around Fibonacci 0.5 at 99k
This outlook fits a medium-term plan, but if the second zone (99k) provides a strong reaction, it could also become the base for a longer-term bullish structure.
Stay disciplined, monitor these levels closely, and trade with proper risk management.
What’s your view on BTC’s long-term structure? Share your thoughts in the comments.
Gold Scenario – Tracking the Medium-Term UptrendGold Scenario – Tracking the Medium-Term Uptrend
Hello traders,
Gold continues to follow the expected scenario. Price reacted at the Fibonacci 1.618 resistance, effectively completing the liquidity test. At present, the 3368 zone is a good area to look for buying opportunities.
The previous Elliott cycle has already completed its ABC waves, and gold now appears to be forming a new Elliott structure. Currently, price is likely in wave 3 of the uptrend, reacting at the H4 descending trendline with a mild pullback, before completing wave 5 with a breakout move from the channel and confirming the flag pattern on H4.
Strategy: Buy around 3368 with a strict stop-loss just below the previous swing low.
Target: 3410 is a reasonable profit level. After that, expect wave 4 to form and look for short opportunities from there.
The MACD remains supportive, trading above its average levels and confirming bullish momentum. At this stage, it’s all about timing entries correctly.
This is my personal outlook on gold in the short to medium term. Use it as reference and don’t forget to share your views in the comments so we can learn from each other.

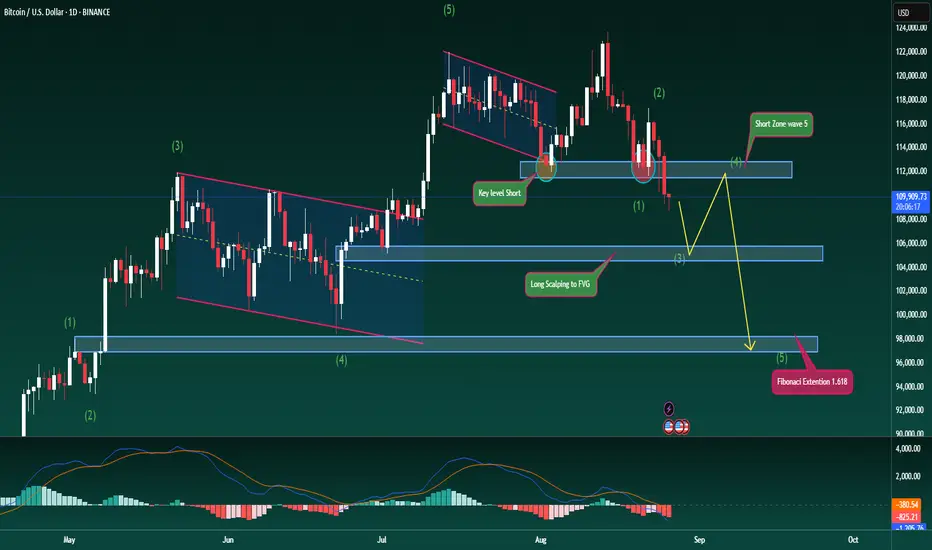
Bitcoin Trend Reversal – Elliott Wave in PlayBitcoin Trend Reversal – Elliott Wave in Play
Hello traders,
Today we look at a fresh scenario for BTC as price has broken decisively below a major support zone, showing clear short-side strength. This could mark the beginning of a medium-term downtrend, signalling a shift in market structure.
The 112k level has been fully taken out after two strong rejections earlier, and now the market looks ready to seek lower levels, potentially targeting 97k–98k based on Fibonacci Extension.
From an Elliott Wave perspective, BTC is currently in wave 3 of the down cycle, and has not yet reached the reaction point for wave 4. I expect the 105k zone to act as support for this leg down. From there, price could bounce into wave 4 before completing wave 5 lower towards 97k, or even 95k. This would provide a solid area to plan medium-term long entries afterwards.
The MACD also supports the bearish view, with both volume and moving averages trending below, signalling strong downside momentum.
I’ve marked the key price levels on the chart for clarity. Please use this scenario as reference and manage risk carefully with your trades.
What’s your outlook for BTC here? Share your thoughts in the comments so we can discuss together.
Gold – Weekly Opening Update Gold – Weekly Opening Update
Hello traders,
Gold is holding firm after last week’s strong rally. As mentioned in my earlier analysis, gold has completed an ABC Elliott Wave structure beautifully, with wave C pushing higher and meeting the original target perfectly.
As the new week begins, the market has opened quietly, with price consolidating around 3368. At this stage, gold is in an accumulation phase, and traders are waiting for a clear confirmation before taking fresh positions.
Gold has formed a minor resistance at 3359. If price breaks below this level, it could act as a short-term sell confirmation, with possible entries around 3366.
On the other hand, if gold holds steady or breaks above last week’s resistance high, the bias will shift to long-term buying opportunities.
Even if a sell plays out after breaking 3359, the next strong buy zone sits around 3345, aligned with the ascending trendline.
Since price is still within the flag pattern, trading is expected to remain focused on the market’s major liquidity zones. On the D1 chart, the structure continues to favour the upside bias. Any selling setups should be kept to short scalping plays for better risk control and higher accuracy.
This is my personal outlook for Monday’s session. Trade carefully and manage your account with discipline.
What’s your view on gold to start the week? Share your thoughts in the comments so we can learn together

Gold – Medium-Term Buy StrategyGold – Medium-Term Buy Strategy
Hello traders,
Gold continues to move within wave B under Elliott Wave structure. I expect price to retest the trendline once more, with the strong support around 3325 — which already triggered a sharp bounce yesterday — likely to play a key role before wave C begins.
According to Elliott theory, wave C is often the strongest, and in this case, it could extend towards the 339x region. This offers a swing buy opportunity with a reasonable target of 30–40 dollars.
The MACD also supports this outlook, with volume holding above the average line and the MACD (green) remaining on top.
Key Resistance: 3348–3352, must be broken to open the way towards 339x.
Key Support: 3313, if broken, the scenario shifts and longer-term selling pressure could return.
Buy Zone: Around 3327, with profit potential of 40–60 dollars.
This is my personal outlook for gold this week. I hope it helps you align your trading plan.
What do you think about gold’s direction here? Share your views in the comments below.

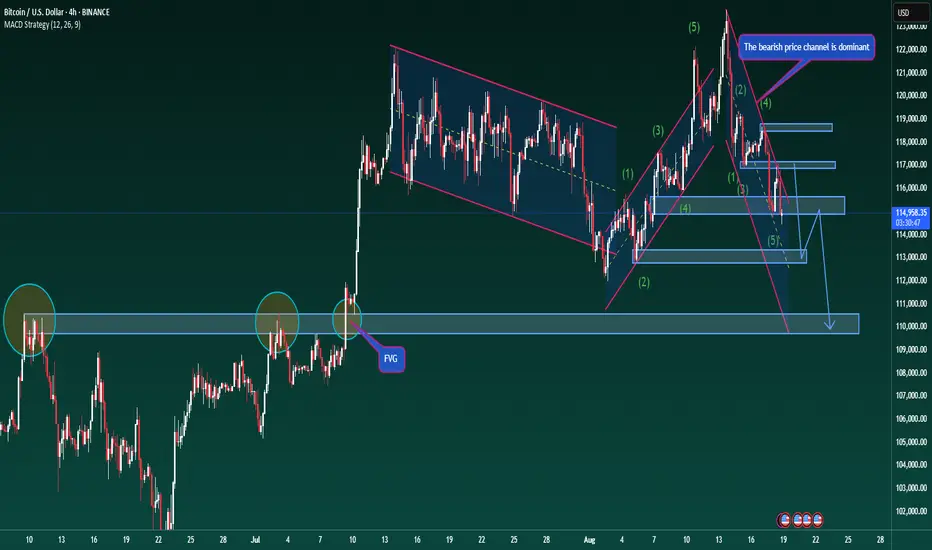
Bitcoin Update – Price Action Still on TrackBitcoin Update – Price Action Still on Track
Yesterday’s scenario has played out accurately, with BTC continuing to respect the descending channel. Each time price touched the upper trendline, it quickly turned lower, and now it is reacting around the midline of the channel, near the 113,000 zone — exactly the level highlighted earlier as an area to watch.
With this corrective move, I expect BTC could retest the 115,000 area before resuming its broader downtrend. The next downside target remains around 110,000, as larger timeframe structures usually require a corrective pullback before continuing the main trend — something Dow Theory traders will clearly recognise.
Today also coincides with discussions on interest rate policy, which could bring higher volatility as investors take a more cautious stance across global financial markets. However, FOMC outcomes often have limited impact on Bitcoin, given its relative independence from traditional macroeconomic drivers compared to gold or forex markets.
In the short term, traders may consider long opportunities near the 113,000 area with a tight stop just below the recent support, aiming for a corrective move towards 115,000 before the main downtrend resumes.
Strong trading comes from patience and discipline. Stick with the defined scenario rather than reacting emotionally to intraday swings.
Wishing you successful trades. What’s your view on Bitcoin’s price action here? Share your thoughts below.
#BTCUSD #Bitcoin #CryptoAnalysis #TechnicalAnalysis #PriceAction #Trendline #CryptoTrading #SwingTrading

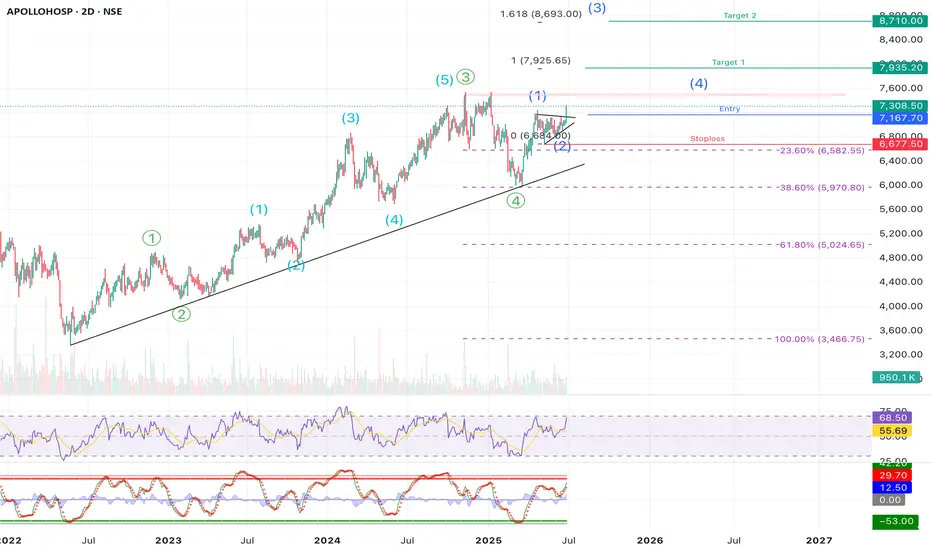
APOLLOHOSP | Swing | Breakout APOLLO HOSPITAL – Elliott Wave Structure + Breakout Opportunity Ahead
Apollo Hospitals is showing a textbook Elliott Wave formation, and we might just be at the beginning of a fresh impulsive rally. If you’re a swing trader or positional investor, this setup is worth keeping a close eye on.
⸻
🧩 Elliott Wave Count Analysis
• The stock is in a larger degree 5-wave move (marked in green). Within that 1-4 completed and wave 5 in progress.
• Within that, we can also see a new 5-wave impulsive structure developing (in blue), and it seems like we just completed Wave (2) of this new leg.
• This means — Wave (3) could be starting now, which is usually the strongest and fastest wave.
⸻
📈 Trade Setup
• Entry Zone: Around ₹7,165–₹7,215
• Stoploss: ₹6,677 (just below recent swing low and invalidation of the current wave count, Around 7-8% )
• Target 1: ₹7,925 (around 10%+ )
• Target 2: ₹8,710 (around 25%)
• Extended Target (Wave 3 Fibonacci Extension): ₹9,167
The targets are based on Fibonacci extension levels from Wave (1) to Wave (2), which typically project the length of Wave (3).
⸻
🔍 Supporting Technicals
✅ Trendline Support
• Price has been respecting a long-term rising trendline since early 2022 — a strong sign of continued bullish momentum.
✅ RSI & Stochastics Turning Up
• RSI is rising but not overbought — suggesting more room for upside.
• Stochastic oscillator is also showing a bullish crossover, confirming early momentum for the next wave up.
⸻
⚠️ Risk Management Note
If price drops below ₹6,677 and breaks the trendline, that would invalidate this Elliott wave count. It’s wise to exit or reduce exposure in that case. This is key to avoid being caught in a deeper corrective phase.
⸻
📝 Summary:
Apollo Hospitals appears to be starting a fresh Wave (3) after completing a healthy correction. With a clean Elliott Wave structure, trendline support, and supportive indicators, the setup looks strong. Risk is clearly defined and the reward potential is high — a good case for a swing position.
⸻
💬 Are you tracking this Wave 3 setup too? Let’s hear your thoughts in the comments below!
Disclaimer:
This analysis is shared for educational and informational purposes only. It is not investment advice or a recommendation. Please consult a SEBI-registered financial advisor before making any investment decisions. The author is not responsible for any losses arising from trading or investing based on this analysis.
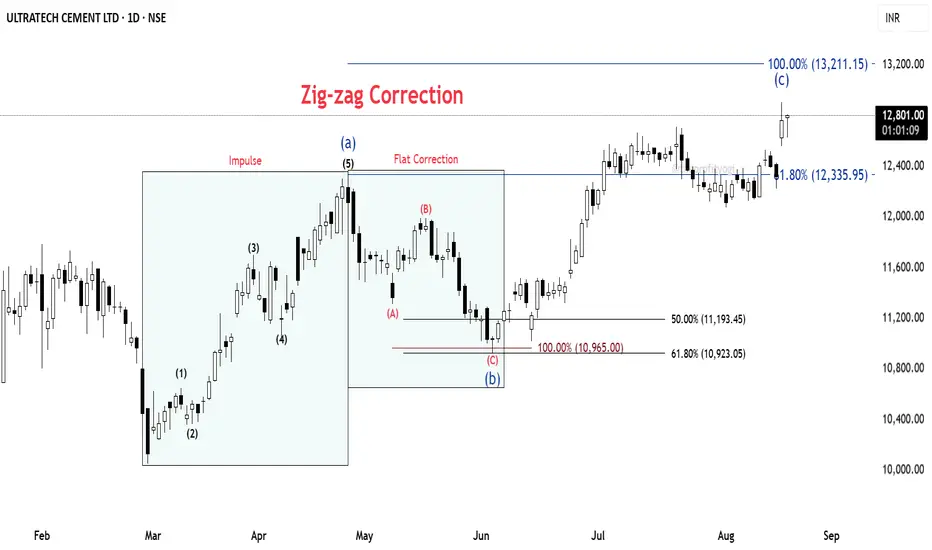
ULTRACEMCO: Wave C started from strong Fib clusterULTRACEMCO – Daily Chart Analysis
🔹 Base Point: The count begins from the low made on 3rd March 2025.
🔹 From this low, the price moved up in the form of a clear impulse wave, completing a 5-wave structure.
🔹 This was followed by a corrective fall, retracing 61.8% Fibonacci of the prior impulse.
⚡ Correction Phase:
The decline is counted as an ABC Flat correction (red).
Within this, the C wave extended fully to the 100% Fibonacci projection.
At this point, we observe a strong cluster zone formed by the 61.8% retracement and 100% extension, indicating confluence and potential support.
📈 Current Development:
From this support, the price has begun to move up again, showing the characteristics of a fresh impulse.
The overall structure fits into a larger Zig-Zag correction, where Wave C is still under development.⏳
📝 Summary:
✅ Impulse up (5 waves)
✅ Flat correction (A-B-C) complete at Fib cluster
🚀 Wave C of Zig-Zag unfolding
#ULTRACEMCO #NSEStocks #ElliottWave #Fibonacci #WaveAnalysis #TradingSetup #PriceAction
Bitcoin – Updated Trading ScenarioBitcoin – Updated Trading Scenario
BTC followed the expected move by testing the 117,000 zone before turning lower, but it did not align with the anticipated ABC correction under Elliott Wave. At present, price is showing signs of slipping below the 114,700 support, suggesting that the corrective phase may not have ended at the previous wave 5 low.
Based on Dow Theory, the ongoing decline could extend towards the 113,000 area before the market sees a stronger rebound. A descending channel has now formed, and price is reacting well to the upper trendlines, reflecting that short-side pressure remains dominant.
In this context, prioritising short positions in line with the prevailing downtrend may improve the probability of success. The next major target lies near 110,000, where strong resistance clusters from higher timeframes converge.
For short-term traders, it is possible to take advantage of pullbacks towards the channel trendlines to look for quick entries following the main direction. Risk management is key here, and traders should avoid rushing into longs while the corrective leg is still in play.
A downtrend often lasts longer than expected, but once selling pressure fades, the recovery phase can be sharp. Patience and discipline are essential to capture the right opportunity rather than fighting against the flow.
#BTCUSD #Bitcoin #CryptoAnalysis #TechnicalAnalysis #PriceAction #ElliottWave #MACD #CryptoTrading #ForexIndia
Gold Outlook – Buying as the Main ThemeGold Outlook – Buying as the Main Theme
Gold continues to move in line with previous analyses. Earlier today in the Asian session, the market saw a quick dip due to liquidity being cleared during the daily one-hour break. However, price quickly recovered, broke through the 3339 resistance, and confirmed that buying momentum has returned, strengthening the short-term bullish trend.
Expectations for a new Elliott wave cycle are gradually taking shape. At this point, wave 3 is considered to have begun — typically the strongest phase with greater momentum and wider price swings. This supports the scenario of a medium-term bullish outlook.
Price remains above the key EMA levels, confirming that the long-term trend is intact. The breakout above 3339 reinforces buyer strength and opens the way towards Fibonacci extension targets at 2.618 and 3.618. MACD also maintains positive momentum, while Elliott structure suggests that wave 3 still has room to extend further.
As long as gold holds above the 3336–3338 zone, this remains a reasonable area to consider buying. A minor pullback around this level would offer an even better opportunity to join the trend, with a stop-loss of about 6 dollars to manage risk effectively.
When price approaches Fibonacci extension targets, traders may consider partial profit-taking or look for short-term selling opportunities. This approach will be suitable given how far wave 3 has already extended.
It is important to monitor price reactions around the extension zones. Higher timeframes such as H1–H4 should be prioritised to capture the broader structure and avoid market noise.
A strong trend never moves in a straight line; it always comes with pauses and retracements. Staying patient and riding with the main trend is often the best way to maximise profits in the medium term.
#XAUUSD #Gold #TechnicalAnalysis #PriceAction #Fibonacci #ElliottWave #MACD #Forex #IndiaTrading

M_M C Wave CorrectionTriple Bearish Divergences
Elliot Impulse completed (1-2-3-4-5 Complete)
Elliot Correction In Progres (A Complete, B Complete, C may start).

GBP/USD: Post-Impulse Sell Setup from Ending DiagonalThe chart depicts a completed 5-wave impulsive structure, culminating at the top of wave (5). The internal wave structure of the final fifth wave forms a classic ending diagonal pattern, typically signaling a trend reversal or deep correction.
After this extended fifth wave, the price has started rolling over, confirming the start of a corrective decline. The wave count now expects an ABC correction targeting the previous wave 4/2 demand zone, highlighted in red.
Target 1 (T1): 1.33608
Target 2 (T2): 1.32436
Stop Loss (SL): 1.35988
Ending diagonal at the top of wave (5) signals exhaustion of bullish momentum.
Clear bearish divergence (not shown here) is commonly seen with this pattern.
The price has broken the short-term structure and is now forming lower highs.
Target zone aligns with previous wave 2 consolidation – a typical retracement zone for post-impulse corrections.

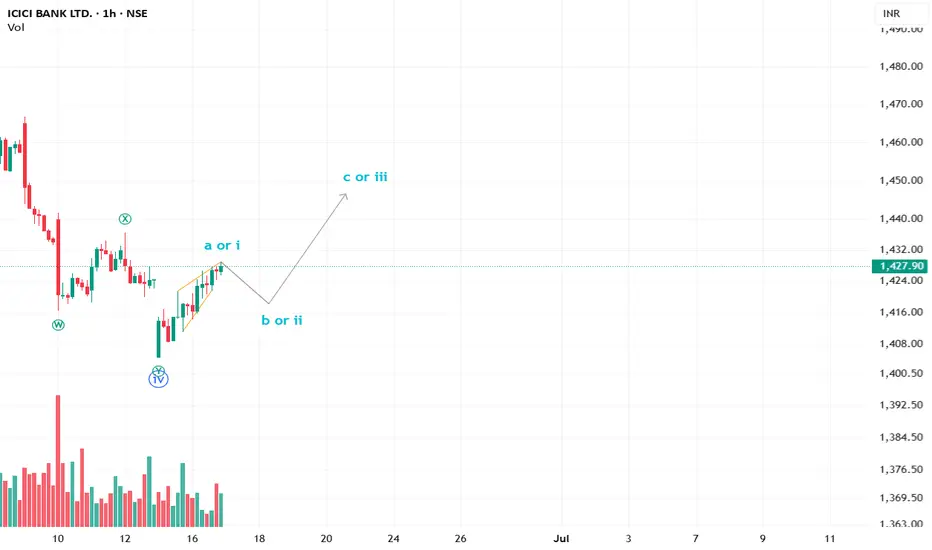
ICICIBANK can follow this path? Clues on the wayA beautiful leading diagonal in ICICI bank reflecting Wave a or i. We can see a minor downside tomorrow and an upside short-term move for a good options trade.
A Bullish Continuation Wedge + Elliott WaveIn NSE:ZENTEC the upward movement is likely to resume.
PLEASE NOTE THAT:
This chart analysis is only for reference purpose.
This is not buying or selling recommendations.
I am not SEBI registered.
Please consult your financial advisor before taking any trade
