Evaluating Trend and Momentum Alignment with EMA & RSI🔎 Intro / Overview
This idea presents an EMA + RSI Alignment Framework designed to help traders understand market conditions rather than chase price movements.
Often, traders feel they have “missed the move”.
In most cases, this happens not because of late entries, but because market context was not clearly defined beforehand.
This framework focuses on evaluating trend direction and momentum quality first, so traders can better understand when conditions were supportive, unclear, or weakening.
⸻
📔 Concept
Indicators are frequently misused when applied in isolation.
This framework assigns clear and specific roles to each tool:
• EMA defines trend bias, not support or resistance.
• RSI measures momentum quality, not overbought or oversold levels.
A market environment is considered valid only when EMA and RSI are aligned.
When alignment is missing, price movement alone is treated as low-quality information.
This shifts focus away from prediction and toward environment assessment.
⸻
📌 How to Use
The framework is applied through three structured steps:
1. Identify Trend Bias (EMA)
• Price holding above EMA → bullish environment
• Price holding below EMA → bearish environment
• Price frequently crossing EMA → unstable environment
2. Assess Momentum Quality (RSI)
• RSI holding above 40 → supportive bullish momentum
• RSI holding below 60 → supportive bearish momentum
• RSI fluctuating around 50 → momentum instability
3. Confirm Alignment
• EMA + RSI aligned → valid market environment
• EMA + RSI misaligned → low-quality environment
This framework is used strictly for evaluation and learning, not execution.
⸻
📊 Chart Explanation
• Bullish Alignment Zone
Price holds above EMA while RSI confirms stable bullish momentum.
• No Alignment Zone
EMA flattens and RSI becomes unstable, indicating a low-quality environment.
• Bearish Alignment Zone
Price holds below EMA while RSI confirms bearish momentum.
The RSI panel is used only for confirmation, never for signal generation.
⸻
👀 Observation
Many traders feel they missed a move only after alignment has already occurred.
This framework helps visualize:
• When alignment was present
• When conditions became unclear
• When momentum weakened
Understanding this sequence helps traders learn from price behavior instead of reacting emotionally to it.
⸻
❗ Why It Matters?
Market movement alone does not equal opportunity.
By learning to recognize alignment vs misalignment, traders can:
• Avoid chasing price after moves are over
• Stay out of choppy or unstable conditions
• Build patience and contextual awareness
Context is often the difference between consistency and frustration.
⸻
🎯 Conclusion
The EMA + RSI Alignment Framework is a context-first approach to understanding market behavior.
It does not attempt to forecast future price moves.
Instead, it explains why certain environments supported movement and why others did not.
This makes it a valuable educational tool for developing disciplined, structured market understanding.
⸻
⚠️ Disclaimer
📘 For educational purposes only.
🙅 Not SEBI registered.
❌ Not a buy/sell recommendation.
🧠 Purely a learning resource.
📊 Not financial advice.
Exponential Moving Average (EMA)

Market View & Trade PlanBased on current structure, NIFTY is trading inside a rising channel on both 5-minute and 15-minute timeframes, with short-term price action forming a potential bullish cup-and-handle pattern on the 5-minute chart. Momentum indicators and price behavior suggest a bias toward the upside as long as the index holds above the channel support zone. A buy-on-breakout can be considered above 26,175–26,185, with an initial stop loss below 26,110 (below the handle low and channel support). On confirmation, the upside potential lies toward 26,240 / 26,300, while a failure to hold the channel could open a downside move back toward 26,080–26,040.
Risk Note & Probability View
The bullish scenario remains valid only if price sustains above VWAP and the short-term EMA cluster; rejection from the upper channel or a breakdown below support will invalidate the setup and shift the bias to neutral-to-bearish. This is a probability-based trade, not a prediction — execution discipline and risk control matter more than direction.
Disclaimer: I am not a SEBI-registered research analyst. This view is for educational and informational purposes only and should not be considered investment advice. Please consult a qualified financial advisor before taking any trade decisions.

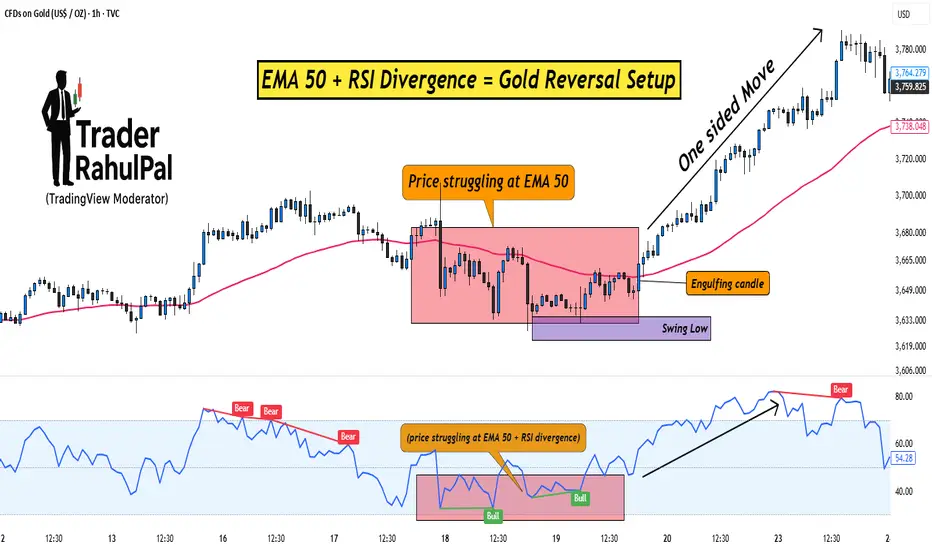
EMA 50 + RSI Divergence = Gold Reversal Setup!Hello Traders!
Gold often makes sharp one-sided moves, trapping traders who enter too late. But if you know how to combine a simple moving average with a momentum indicator, you can spot high-probability reversal setups.
One such method is using the EMA 50 together with RSI Divergence . Let’s break down how it works.
1. Why EMA 50?
The 50-period EMA acts as a dynamic trend filter.
When gold trades above it, the short-term trend is bullish; below it, bearish.
Price often retests the EMA 50 during pullbacks, making it a key level to watch for reversals.
2. What is RSI Divergence?
Divergence happens when price makes a new high/low, but RSI doesn’t confirm it.
Example: Price makes a higher high, but RSI makes a lower high → bearish divergence.
This signals that momentum is weakening, even if price is still moving strongly.
3. Combining EMA 50 with RSI Divergence
First, check where price is relative to EMA 50.
Next, look for divergence on RSI near that zone.
If both align (price struggling at EMA 50 + RSI divergence), chances of a reversal increase sharply.
4. Entry & Risk Management
Wait for a confirmation candle near EMA 50 (like engulfing or pin bar).
Place stop loss just above recent swing high/low.
Target the next support/resistance zone for exits.
Rahul’s Tip:
Don’t use divergence alone, combine it with EMA 50 for structure and you’ll filter out most false signals. This setup works best on higher timeframes like 1H or 4H for gold.
Conclusion:
EMA 50 gives you the trend filter, and RSI divergence reveals momentum weakness.
Together, they form a reliable reversal setup that helps you enter gold trades at the right time instead of chasing moves.
This Educational Idea By @TraderRahulPal (TradingView Moderator) | More analysis & educational content on my profile
If this post gave you a new setup idea, like it, share your thoughts in comments, and follow for more practical trading strategies!
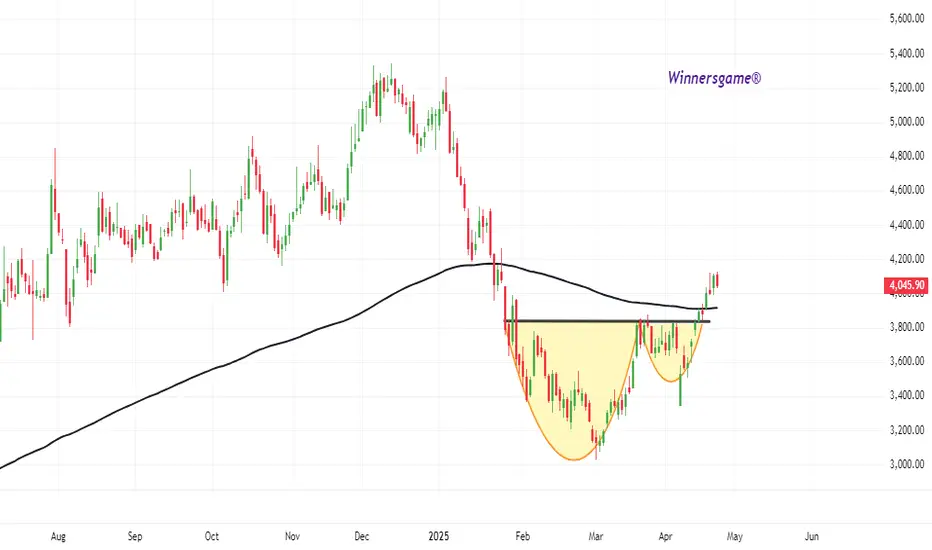
CAMS, C&H BREAKOUT DONECAMS sustaining above 200EMA after Cup & Handle breakout done. Buy CAMS futures till 3930 for target of 4500/4650 and 4800.
keep suitable stop below 3830 on closing basis.
KOTAK BANK NEAR FLAG BReakoutKotakBank is nearly Flag Breakout on Monthly Candle (Wait more 7 days to Finish MOnthly Candle with Big Bull Breakout)
Wait for Proper Breakout beacuse its 4 time where Chart is going to test same Trendline.
Flag Pattern Start from 2020- After 5 years its will going to break
If we see fulll chart Stock taking support over 2013 Trendline before two months so there is more more possibility to give breakout
if we see RSI chart its also show Breakout over MOnthly RSI trendline..
## THis is my Just View, take position after all confromations and research by yourself##
also see weekly chart - weekly showing strong big bull canle ( 1more Weekly Candle Require for final conformations)

Death Crossover Strategy Explained with 50-EMA & 200-EMA line.Hello Traders! In today's post, we’ll explore the Death Crossover Strategy , a highly effective technique used by traders to identify potential trend reversals. This strategy involves the 50-EMA (Exponential Moving Average) crossing below the 200-EMA , which is considered a bearish signal.
In this chart of IndusInd Bank Ltd., we can clearly see the Death Crossover in action. The 50-EMA (green line) has crossed below the 200-EMA (red line), signaling a potential downtrend.
Key Insights:
Death Crossover : Occurs when the short-term moving average ( 50-EMA ) crosses below the long-term moving average ( 200-EMA ), suggesting the beginning of a downtrend.
Volume Confirmation : A sudden increase in volume after the crossover confirms the strength of the signal. In this case, the volume spike at the crossover indicates a strong bearish momentum.
Target Areas : After a Death Crossover , look for potential support levels to target as the price moves lower. In the chart, we can see how the price retraced and then continued its downward journey.
Price Action Post-Crossover:
In this example, the stock dropped by approximately -38.12% after the Death Crossover , highlighting how powerful this signal can be in catching major trend reversals.
Risk Management :
Stop Loss : To protect your capital, always use a stop-loss order just above the 50-EMA (green line) when entering a short trade after the crossover.
Position Sizing : Keep your position sizes small in trending markets to manage risk and ensure a favorable risk-to-reward ratio.
Note: We have used this chart just for teaching the strategy and its potential impact.
This is a great strategy to catch long-term downtrends, but as always, remember to use it alongside other technical indicators and fundamental analysis to increase your chances of success.
Happy Trading!

Monthly Breakout On RSI & TrendlinePlease check Monthly Trendline over RSI - From 2018 to 2025 RSI Trendline Breakout done Last month & Sustain in crusial month also
Second thing if we check Trendlines over Chart - Stock is taking regular support from 2014 to till date
if we check from 2021 to till date consolidation zone - Stock is going to breakout this zone (final conformation above 2080, for Safest Entry)
But as per current scenario and situation i thing kotakbank will be a good choice if market start upward direction

Newgen in Blue Sky.NSE:NEWGEN showed a strong upmove today Crossed Key Levels and Hit an all-time high, with RSI bouncing back Sharply again.
Trade Setup:
It can be a Good 1:1 RISK-REWARD Trade for Aggressive Swing Trader.
For Postional Trade let it cool down a bit and then try to enter at swing low.
Target(Take Profit):
1977 will be Levels for Swing/Positional Trader.
Stop-Loss:
Around 1534.15 For Swing Trade and Positional Trader.
📌Thank you for exploring my idea! I hope you found it valuable.
🙏FLLOW for more
👍BOOST if useful
✍️COMMENT Below your views.
Meanwhile, check out my other stock ideas below until this trade is activated. I would love your feedback.
Disclaimer: This analysis is intended solely for informational and educational purposes and should not be interpreted as financial advice. It is advisable to consult a qualified financial advisor or conduct thorough research before making investment decisions.

ZOMATO: Pullback trade📊 Analysis:
Good bullish candle form on 21EMA with good volume.
📈 Trading Plan:
Entry: Buy above 290 (wait for a breakout above candle at least 15-30 min with strong volume confirmation).
Target 1: 320
Target 2: 345
Stop-Loss: 275 closing basis


HDFC BANK ( Looking goog to invest); small stoploss is enough;For short term investment ;
Leave a " Like If you agree ".👍
.
Wait for small retracement & daily candle to close above - "1650".
Trade carefully untill ENTRY level.
.
Entry: 1655 / 1640
target: 1675- 1700- 1750
sl: 1640 / 1630
major stoploss/ support: 1600
.
.
Enter only if market Breaks
"Yellow box" mentioned.
.
.
Don't make complicated trade set-up.📈📉
Keep it " simple, focus on consistency " 💹
Refer our old ideas for accuracy rate🧑💻
Follow for daily updates👍
.
Refer old posted idea attached below.

Nazara TechnologyWe are closely following Nazara Technologies and believe it’s poised for a breakout based on its technical patterns. Consolidation near resistance often suggests a potential for a breakout if the price action confirms it. If Nazara Technologies breaks through the 1020 level, it could indeed pave the way for further upside, potentially reaching your targets of 1350, 1500, and 1650+.
It’s always good to keep an eye on broader market conditions and any company-specific news that could impact the stock’s performance. Additionally, setting stop-loss orders or having an exit strategy in place might help manage risk if the price movement doesn’t go as expected.

HIKAL Triangle BreakOutHikal has given a Breakout from triangle pattern with high volumes on 1D timeframe. It is apparently retesting its resistance. Go long on bullish confirmation.

STEELXIND Channel & Falling Wedge BreakOutSteelxind had earlier given a channel breakout on 1D timeframe with higher volumes. It started consolidation after breakout and is now attempting to breakout from a falling wedge pattern on 1D timeframe. Go long after bullish closing confirmation. Follow stop loss rules.

RELIGARE Flag & Wedge BreakOutRELIGARE had given a Bullish Flag and Falling Wedge Breakout with above average volumes on 1D timeframe. The stock is also trading above 200EMA. Enter with proper risk management.

BULLISH BREAKOUT IN TATACONSUMERBuy TATA CONSUMER 1145 till 1090 for 1220 to 1300. Good bullish divergence on MACD happening. Just range breakout pending after which stock will move its own way. Stock taken good support at 200EMA and bounced sharply with volumes.
View invalid below 1080 closing on two days basis.

GRINFRA Triangle BreakOutGRINFRA has given a breakout from symmetrical triangle pattern on 1D timeframe. It is also trading above its 200 EMA. Go long after bullish confirmation.

Swing Trading Gem:(ZEEL Set to Soar 10-15 % in a Month or Two*ZEEL is ready to offer returns ranging from 10-15% within a timeframe of one to two months*. Please note that terms and conditions apply.
Reasons to Consider Taking a Trade:
- A crucial Supply/Support zone has been pinpointed within the range of 140-145
- The trendline break.
- Price has surged above the 50 Moving Average, which is now acting as a support level.
Targets:
I think Target 1: Will be achieved in a week or two and then 174 Target 2 will be achieved in a month and if ZEEL Blast then 191 Target 3 in 2 months.
Imp. Note: This analysis is provided for informational purposes only and does not constitute a direct recommendation to buy or sell stocks. Investors should conduct their own research and consult with financial advisors before making any investment decisions, as market conditions and individual circumstances may vary.
Market Risk: However, it's important to acknowledge the inherent risks associated with investing in the stock market, including but not limited to volatility, economic downturns, regulatory changes, and unforeseen events that can impact stock prices. It's crucial for investors to remain vigilant and diversify their portfolios to mitigate potential losses.

IDFC LTD DAILY 200 EMAIDFC LTD is receiving very good support on daily EMA, also the monthly RSI looks positive. It also forms a good cup in a weekly/ monthly time frame, that is what the green line suggests at around 118.0 which might work as good support.

Bajaj FinanceThe stock is slowly gaining positive momentum on the daily & Weekly charts. It has formed the double bottom on daily charts. RSI is in bullish trend on daily and weekly charts. On moving average front 20 DEMA has crossover 100 DEMA. One can made trade at CMP with SL 7200 and Target 8000.

New level PSU stock giving great results
Railway stocks in focus
This stock also move new Life time high level
No recommendation for buy and sell
830 sustain for the stock

IRB Infrastructure could rally soonIRB Infrastructure has been consolidating on weekly timeframe for a very long time and has created a good BASE for upcoming rally, it is also near its All Time High Prices absorbing the SUPPLY, as well as we can clearly see the 50 Daily EMA + 200 Daily EMA following the price and Volume Dryups for Red Days and on Green days significant VOLUME activity and we also have NEWS catalyst like Quarter Profits rise and Record high Block Deals for the company, so we could soon see a Rally one we pick up on VOLUMES above All Time High

The Ultimate Beginners Guide to Day TradingHello everyone My name is d3ffyduck
I am today gonna post some cool and new tips For the beginners in Daytrading.
I am gonna divide things in Chapters so you'll learn it with ease
Read it till the end Hope You learn something
Chapter-1 Timeframe selection
The choice of the best timeframe for chart analysis in day trading can vary depending on a trader's strategy, preferences, and the market being traded. Different timeframes offer varying levels of detail and may suit different trading styles.For Example
1-Minute Chart: This timeframe provides very detailed information, showing price movements within one-minute intervals. I prefer Using it for precise entry and exit points In day trading
5-Minute Chart: Slightly less detailed than the 1-minute chart, the 5-minute chart still offers relatively short-term insights into price movements. I use to determine my momentum for the trade i want to hold for like 1-2hrs only
15-Minute Chart: This timeframe offers a broader view of the market compared to shorter intervals. I prefer it to determine my next day momentum of the market
Chapter-2 Support and resistance Using RSI
I know you all knows the basics for support and resistance but today i will show you the best way. Just open your chart and use RSI Indicator and we are going to mark the overbought areas high candle and oversold area lowest candle using it for different time frames.
Just a note from my side do not mark those areas again if there have already a support or resistance line in different time frame and also you can remove those level of S&R which did not hold well in different time frames
1-day time frame=I have marked the regions where the RSI turned in the overbought or oversold areas. As you can see, I have not marked the support and resistance levels since they were already established from previous market overbought and oversold.
4-hour Time frame=In this timeframe, we will only identify the levels that are above 70 and below 30 in the RSI. We'll skip the R&S that are already marked on the daily timeframe. To reiterate, please refrain from marking those levels again if we can observe that our resistance and support levels have already been established on the daily chart.
1-Hour Time Frame = I've set my preferred timeframe to a maximum of 4 to 5 months. I don't want to go below this timeframe as it will create more noise. Additionally, I'll remove the support and resistance levels that didn't react well for buyers and sellers at this point to make the chart look cleaner
Chapter-3 Determining the Trend
Here in this chapter we are going to use only 2 Things to keep everything simple:-
SMA+EMA 200= We are going to use simple indicator or just create yourself one indicator which plots both sma and ema with same 200 timeperiod.
Rules are simple
if below both ma look for short
if above both ma look for long
You can use it for 1hr and 15 min for day trading purpose
Trendlines- Trendlines are your best friend.They are the building block for your Chart pattern look for trendlines in 15 min tf for day trading purpose
Chapter-4 Significance of market opening closing,high,low
This is one of the important chapter for day traders and i am going to tell you how an opening closing high and low effect the whole day trade.
For Example
1-Open your Chart
2-Mark the opening ,closing highs and lows for previous 3-4 days
3-Those area are going to be area of interest
Tip for the beginners. Do not take any trades for the first hour From the opening of the day For example if your market opens in 9:15 am dont take trades until 10:00-10:15 cause of high volatilty
Another Tip for the beginners.If you prefer to take 2 trades a day close your previous 10:00 am trade At around 11:45am -12:15 pm and start looking for another one after that. the reason because i have seen this is the time for the most probable reversal or continuation of trend for the next leg of the day
Chapter-5 Significance of Gaps in the market
Gaps are one of the best way to decide what will be the market trend for the rest of the day
There are two type of gaps in the market 1-Gap up 2- Gap down
Tip for the beginners Only trade in the strong gap up or down and as i said before do not trade in the first hour of the opening
Ill show you some scenarios of gap Trading with respect to opening of the day
Scenario 1st strong gap up+ Stayed above above the gap and opening for the 1 hour(9 am-10am)
We can see we had a strong opening stayed above the gap up and open for atleast 1 hour so after this the trend is decided
Tip for the beginners Always follow strict Risk and Reward ratio like i use 1:1.5
Scenario 2nd strong gap up+ stayed below the gap and opening for the 1 hour(9 am-10am)
We can see we had a strong gap up and opening but price stayed below the opening for 1 hour so we took the short as dropped below previous closing/high
Similarly we can use this for gap down scenarios
Final tip from my side are:-
Do meditation for 15 min before trading hours
Always use stoploss
Use your preferred Risk Reward ratio like 1:1.5
Do not trade in opening Hour
Gaps are like your friend
Trends are like a path to success
Do not overtrade
Dont only rely on indicators there isnt any indicator which can make you rich
Use only basic indicators such as Ema,Macd,Rsi and ATR
PLEASE UPVOTE AND FOLLOW FOR MORE EDUCATIONAL CHARTS AND STRATEGIES
