A GAP TO TRADE. Nifty's budget action NIFTY has closing in gap which was made during pre budget rally. We have the opportunity to trade the GAP setting 11400 has first tgt and support of 200 EMA has 2 tgt. Make your positions according to your target.
Happy trading
Exponential Moving Average (EMA)

SIMPLE STRATEGY FOR CONFIRM PROFITUse this strategy strictly in weekly time frame and take your position only when you get confirmation of sell signal. You can short 1500-1540 strike price calls also time is on our side as well.
Thank you MALKAN SIR for this strategy

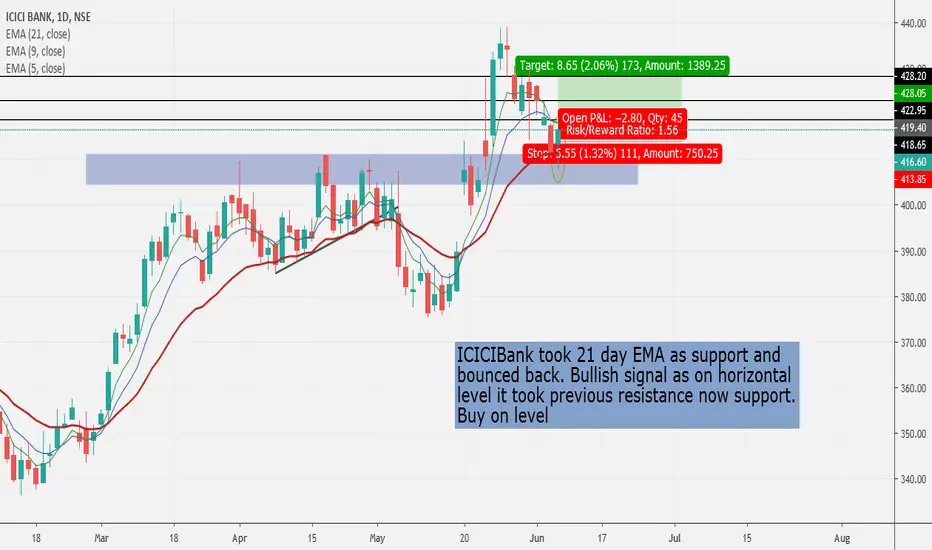
ICICIBanK buy on levels 21 EMA as supportICICIBank took 21 day EMA as support and
bounced back. Bullish signal as on horizontal
level it took previous resistance now support.
Buy on level
Voltas - Bounce on 15 EMA and Ichimoku positivePrice action - Bounce on 15 EMA and if tomorrows candle is also green and above the 15 EMA then enter for short term target of 628
Ichimoku positive and future kumo is green.
Note : This is for educational purpose only.

REC , Daily ,LongAfter a rising window , price consolidated for a couple of weeks , and then a nice breakout , which coincided with the down sloping trendline and the 50 EMA. Longs may be initiated for a swing target of 180 with a stoploss around 153.Also the price has crossed its 200 EMA , though closed below it.

India Cements ,Weekly , Confluence of factors suggesting LongNSE:INDIACEM On weekly charts ,there is a breakout from flag pattern and triple bottom has been confirmed.
the pullback of the flag coincides with 50% fib retrace.
Long positions may be initiated at a throwback to the flag or after consolidation breakout on lower time frame .
Its trending above its 200,62 and 13 period EMA and after bullish crossover of 13,62 EMA has taken support on 62 EMA.

HDFC approaching 1800HDFC has been in a nice long term uptrend trending above 200 EMA, and is just given 13,62 EMA Crossover.
Also the price has broken up from a consolidation zone and confirmed a double bottom.
Long position may be initiated above 1737 with a target of 1800 and SL 1725


Crossed Monthly EMA 10 ADSL trying to move up after long time, it will be too early to say they will go up defiantly in future, but can buy small quantity and keep adding if it is going up

50EMA crossed 200EMA in NiftyWill June 2015 be repeated again?
50 EMA crossed 200 EMA, Price went up, but fallen 1000 points... Let's see
