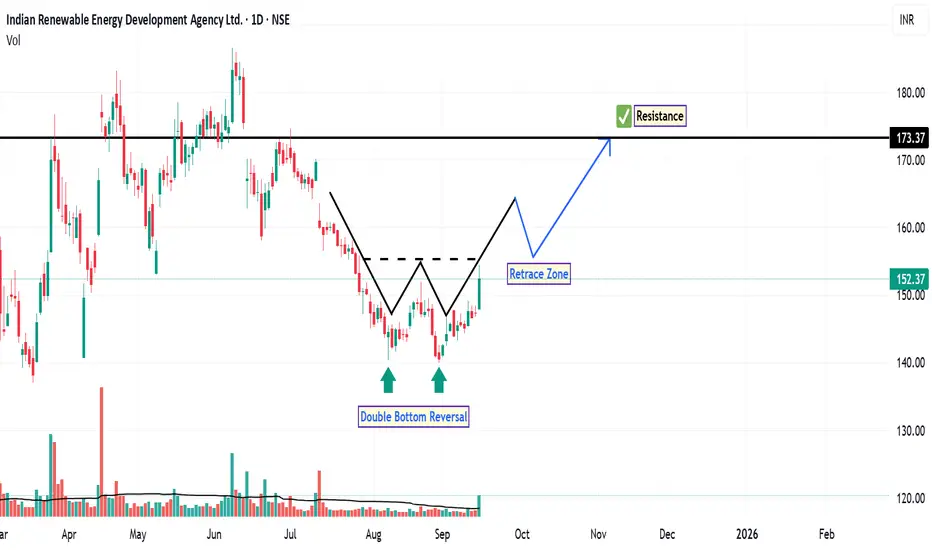
IREDA: Double Bottom in PlayOn the daily time frame, the chart of IREDA has recently displayed a double bottom reversal pattern , a classic technical formation often associated with a potential shift from bearish to bullish sentiment. This pattern, marked clearly on the chart, suggests that buyers may be stepping in at a previously defended price level.
In the preceding downtrend, the stock failed to establish a new low and instead broke above a prior swing high, indicating a CHoCH in market structure. This shift is typically interpreted by technical analysts as a transition from bearish to bullish momentum.
The RSI is currently above 60 , approaching the overbought zone. While this suggests strong buying interest, it also warrants caution as price may be nearing short-term exhaustion. However, in trending markets, RSI can remain elevated for extended periods. Additionally, the stock has managed to close above both the 20-day and 50-day EMAs, accompanied by increased volume, which adds credibility to the bullish setup. These moving averages often act as dynamic support levels and trend confirmation tools.
Based on this technical structure, the next potential resistance levels are identified near ₹160, followed by ₹173 . A technical stop-loss level could be considered at a daily close below ₹140 , which aligns with the double bottom support zone.
Disclaimer: This analysis is intended solely for educational and informational purposes. It does not constitute investment advice or a recommendation to buy, sell, or hold any financial instrument. Market conditions are subject to change, and trading decisions should be made based on individual research, risk tolerance, and consultation with a licensed financial advisor.
Emassignal
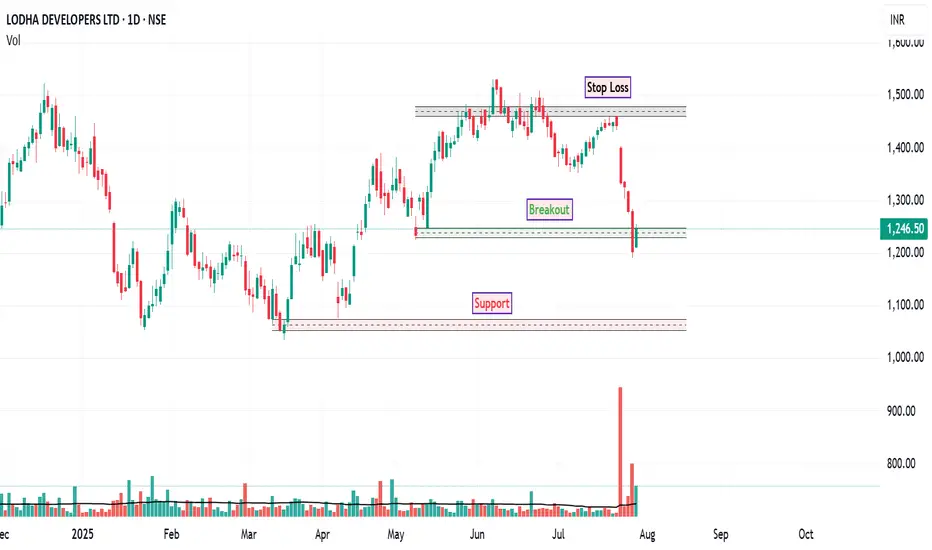
LODHA: Assessing the Bearish TrendThe stock of LODHA is in a technically confirmed downtrend. The inability of the price to overcome previous peaks, followed by successful breaks below prior lows, confirms a persistent supply overhang. This structure will be considered intact as long as the price remains below its key overhead resistance levels.
Key moving averages 20, 50-day EMAs are acting as dynamic resistance. The price is trading below these averages, and they are often observed to be sloping downwards. Rallies toward these moving averages have consistently been met with renewed selling pressure, reinforcing their significance as a ceiling for the current trend.
Based on the current bearish structure, the levels, which are marked on the accompanying chart, are critical for navigating the potential price trajectory.
(Please refer to the attached chart for a visual representation of these levels)
Disclaimer:
The information provided in this technical analysis is for informational and educational purposes only and should not be construed as financial or investment advice. It is an interpretation of historical price data. Market dynamics can change, and past performance is not indicative of future results. All trading and investment activities involve risk. Always conduct your own thorough due diligence and consult with a qualified financial advisor before making any investment decisions.
DOLATALGO - Breakout in DayTimeframePrice consolidate above 120 range since April 2024. Previouly it breakout triangle pattern and gave good returns and now it breakout the small triangle today. Price is also near 200 EMA.

Sarthak Metals LTD: A Comprehensive Technical AnalysisToday, Sarthak Metals LTD exhibited significant price movement, experiencing a bullish increase of 15%. The trading volume reached approximately 875,000 shares, which is more than ten times the stock's average daily trading volume. This unusual activity is a strong indicator of heightened investor interest and market engagement. This pattern can be observed on the previous chart, during which the stock reached its all-time high.
The stock managed to close above its key EMAs, specifically the 20, 50, and 100-day EMAs. This convergence of price closure above these critical indicators suggests a potential trend reversal or a continuation of an upward trend. The ability to surpass these EMAs may provide a layer of support for future price movements.
The RSI and the MACD indicators are both displaying bullish signals. The RSI, which currently indicates the stock is in a favourable buying zone, reflects strong upward momentum. Concurrently, the MACD line crossing above the signal line further reinforces the bullish sentiment in the market for Sarthak Metal.
Should a breakout occur above the current trendline resistance, I could anticipate further positive momentum and upward movement, with the next target resistance identified at 299 . Conversely, the current support level is noted at 162 , providing a reference point for potential downside risk.
Disclaimer: The insights provided in this technical analysis report are intended solely for informational and educational purposes. This information should not be interpreted as financial advice or a recommendation to purchase or sell any securities. It is paramount to consult with a qualified financial advisor and conduct your own thorough research prior to making any investment decisions.

ATOM/USDT Falling Wedge Breakout Targets $14.50NASDAQ:ATOM has formed a falling wedge pattern and is breaking out, having successfully retested the breakout level. The target for this move is $14.50. Additionally, breaking above the 21 EMA on the daily timeframe confirms further bullish momentum.


NTPC long possible?NTPC stock is in a long uptrend & a high probability that the stock will continue the uptrend and going to hit all-time new highs.
1) Long after the BO of conflux area above 240 with a green candle.
2) Previous stock move from the 50 EMA .
3) If RSI also crosses above 60, that's a very high chance of the stock going long .
In case stock rejects the area then wait to touch the 200 EMA levels for right entry.
This is for your educational purpose only.

Adani Power in consolidation levels.Long Adani Power stock after the BO of 50 EMA Level. In the past whenever stock has touched 50 EMA is the key area to go long. Now Long entry above 330 for the target till 350++ with SL 0f 310. This is for your educational purpose only.

HINDALCO Looks Bullish200 EMA and 50 EMA crossover happened for HINDALCO.
Details are mentioned in the chart.
** I AM NOT SEBI registered advisor please consult financial advisor for your investment.
**This is only for educational purpose you can also share your thoughts on the comments

NBCC is LONG50 EMA and 200 EMA crossover happened for NBCC.
Details are mentioned in the chart.
** I AM NOT SEBI registered advisor please consult financial advisor for your investment.
**This is only for educational purpose you can also share your thoughts on the comments

Reliance Ready To Make New 52 Week Low!Reliance Faces Heavy Resistance Near ~ 210 Day EMAs. Delivery Based Selling Appears On Daily Chart. Sell Reliance ~ 2320, With Stop ~ 2373, Target ~ 2060, 2080. Expected Target March Expiry.

Apollo Hospitals Ready To Move In ICCU!Apollo Hospital Unable To Cross Trendline Resistance And Last Few Trading Sessions Closes Below ~ 210 Day's EMA. If Channel Breakdown No Strong Support Seen At Current Levels. Next Important Support Around ~ 3720. These Causes Are Apollo Hospitals To Move In ICCU. Aggressive Trader Short At ~ 4235, With Stop ~ 4318, For Target ~3700, Expected Target April Expiry.

Apollo Hospital - longApollo hospital is forming Cup and Handle Pattwrn pn 1D time frame. Stock has just crossed 200 EMA .

EMA Support and price action supportThe stock DRREDDY broke its long awaited resistance zone on July 11th with an above average volume.
Right now it is retesting the previous resistance zone (Which, according to price action theory might work as support now.)
and also the 50 and 100 day moving average is just below the current price which adds double confirmation.
the 200 EMA is at near 4400, if it gets breached there will be good up move.
It might provide a good swing in upcoming days,
SL of 4300 is a must.
