Golden EMA Setup – Catch Medium-Term Trends with 50 & 200 EMA!Hello Traders!
One of the simplest yet most powerful ways to identify long-lasting trends is by using moving averages. And among all combinations, there’s one that stands out for swing and positional trades, the Golden EMA Setup .
It uses just two tools: the 50 EMA and the 200 EMA. When used correctly, this setup helps you ride big trends and avoid choppy zones.
Let’s understand how this works and how you can apply it.
What is the Golden EMA Setup?
It’s a trend-following strategy based on the crossover of two EMAs:
50 EMA (Fast Average): Reacts quicker to price changes
200 EMA (Slow Average): Represents the long-term trend
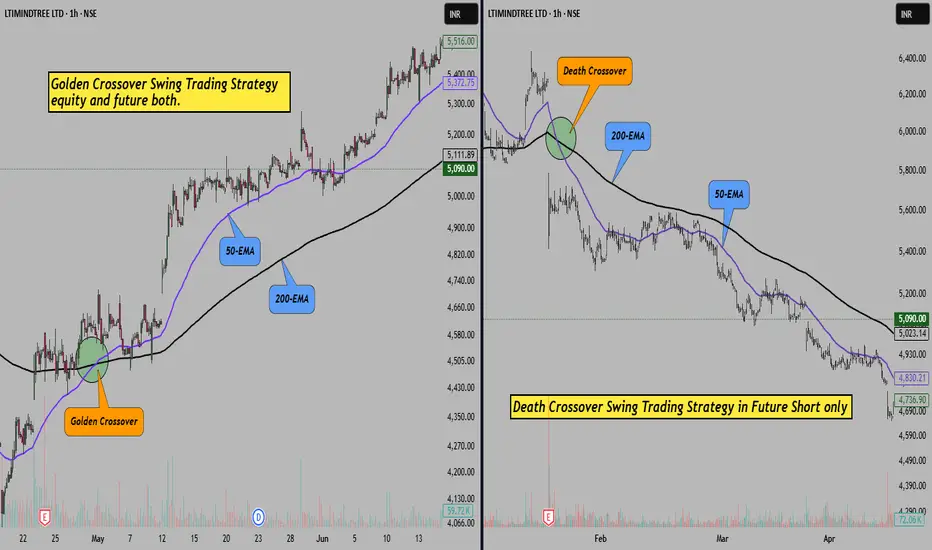
When 50 EMA crosses above 200 EMA, it’s considered a Golden Crossover , a bullish signal.
When 50 EMA crosses below 200 EMA, it’s a Death Crossover , a bearish signal.
How to Trade This Setup:
Entry:
Buy when 50 EMA crosses above 200 EMA and price is above both.
Stop Loss:
Just below the 200 EMA or recent swing low.
Target:
Trail the stop loss and ride the trend till the crossover reverses or price weakens.
Timeframe:
Works best on daily or 1-hour chart for positional/swing trades.
Rahul Tip:
Golden EMA setup works great during trending phases, but avoid using it in sideways markets — you may get trapped in whipsaws. Always confirm with volume or RSI divergence before entering.
Did you ever used this strategy before, let me know in comment box.
Emastrategy
Technical Analysis of Pennar Industries LtdAfter a prolonged period of two months characterized by a downward trend, Pennar Industries has recently exhibited bullish momentum with notable breakouts. An analysis of the daily chart reveals a significant trendline breakout, accompanied by increased trading volume, which has facilitated a close above the 50-day EMA. This development is a positive indicator for potential upward movement.
Additionally, the RSI has also shown a breakout, moving above the pivotal 50 level, which traditionally signals a shift towards bullish territory. The MACD has provided further confirmation of this bullish sentiment, with a crossover being observed, and the MACD histogram now reflecting positive values.
In terms of potential price levels, it is important to note that the stock may encounter resistance around the ₹183 mark, followed by another resistance level at ₹204 . Conversely, strong support is identified at the ₹152 level, which could serve as a safety net for investors in case of price retracement.
Disclaimer: The insights provided in this analysis are for informational and educational purposes only and should not be interpreted as financial advice. It is recommended that individuals consult with a qualified financial advisor or conduct their own comprehensive research before making any investment decisions.

Levels for - 27 Sep 2021Explanation : This is a 15 min time frame chart of BAJFINANCE . We using 50 & 200 EMA strategy , It has taking 50 EMA Resistance If stock continue downtrend move we can easily achieve our target 200 EMA . It has formed a pattern , What kind of pattern it is ?? let me know in comment below 👇
If you like this analysis of Stock give a Like // Follow , let me know in comments below :)
