IOC, Swing Trade SetupThe price is following the uptrend with High High and High Low.
A swing trade can be planned here.
All details are marked on the chart.
Disclaimer: This is my pre market analysis and my trading journal. Not a suggestion to buy or sell.
Energy Commodities

IGL, Break of Structure - Uptrend ResumeTrend Positive
Strength Strong
The price is likely to head higher.
The expansion in bands is started.
The price could test the higher levels of 490.
Disclaimer: This is my pre market analysis and my trading journal. Not a suggestion to buy or sell.

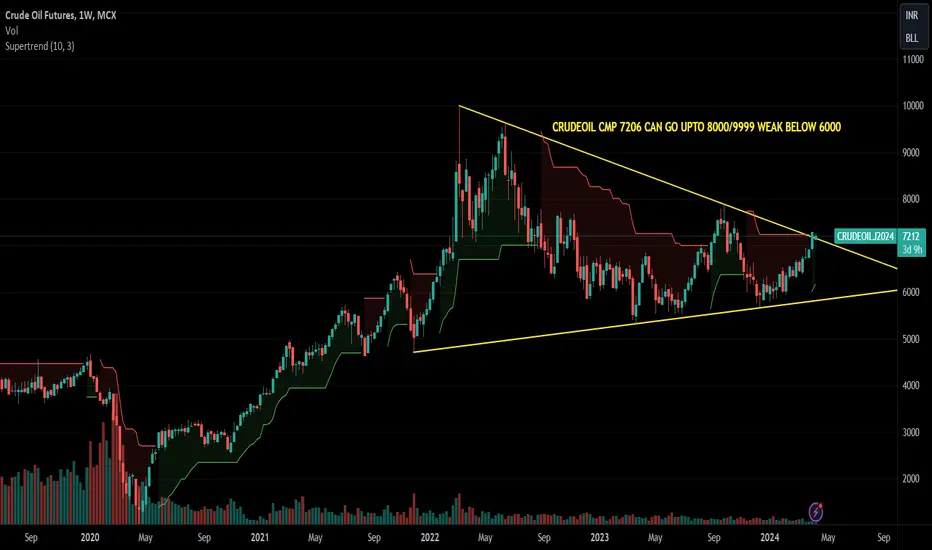
CRUDOILE IMPORANT LEVEL FOR COMING SESSION 24-05-2024We can see selling pressure on chart on crudeoil. AS it has broken Head n Shoulder pattern also major support line. Now Fibonacci level crucial support and Gann Fann line could act as reversal point for coming session. Till Any news can drive it up strongly.
Play Safe :)

Crude - A good support to Reliance now !!!!worldwide Crude has been given buy calls and its expected to move up which usually lifts Reliance and sometime good spikes. This time Crude is taking support and moving up because of bullish trend and new ATH in US equity. Bullish economic outlook and expected FED rate cuts lifting crude now. Its Buy call worldwide now.

Keep An Eye - Breakout Soon - OIL📊 Script: OIL
📊 Sector: Crude Oil & Natural Gas
📊 Industry: Oil Drilling / Allied Services
Key highlights: 💡⚡
📈 Script is trading near at its resistance level which is 645.
📈 Script should give closing above 645 level so that we can see good rally.
📈 Script is trading at upper band of BB.
📈 MACD and Double Moving Averages are giving crossover.
📈 Right now RSI is around 59.
📈 One can go for Swing Trade only above 645.
BUY ONLY ABOVE 645.
⏱️ C.M.P 📑💰- 636
🟢 Target 🎯🏆 - 691
⚠️ Stoploss ☠️🚫 - 625
⚠️ Important: Always maintain your Risk & Reward Ratio.
✅Like and follow to never miss a new idea!✅
Disclaimer: I am not SEBI Registered Advisor. My posts are purely for training and educational purposes.
Eat🍜 Sleep😴 TradingView📈 Repeat 🔁
Happy learning with trading. Cheers!🥂

COAL INDIA FOR 460Leading coal productive firm Coal india is looking good at this point.
We do see an channel breakout in coal india in recent past weeks,Now the breakout has given the confirmation and coal india is looking good from here.
CMP : 448
TARGET 462 / 475

Crude Oil USD Movements Analysis On 28th Feb 2024
USOIL seems like taking support of 100 Ema on Monthly and Daily TF.
If it close above 5ema at the end of this February Monthly Closing it would be good confirmation to Buy.

Crude Oil Week April 29 to May 03
Time Frame: 1 Day
1. Rejection candles from Support zone and 50 EMA. Price has not allowed to break these key levels
2. Previous trend is bullish. Level breakout and under retracement
3. 50 and 200 EMA golden crossover
Time Frame: 4 Hr
Crude oil has bounced from previous key level(Resistance converted to support zone)
1. Trend is Bullish
2. Filled FVG and taken support for 50 EMA
3. Bounced from 200 EMA.
Entry above : 7046
Target: 7257 ( 211 Points)
Stoploss:6916 (130 Points)

Bharat petro ( BPCL ) for 620 ++Bharat Petrolium is one of the great stock for fuel sector is ready to roar again.
We do see channel breakout in BPCL and we are expecting a good move in this script.
Moving averages also showing favourable ratio.
CMP: 601
STOP LOSS : 582
TARGET : 627 +

Crude Oil AnalysisHello Friends, Hope you find doing well.
As there are so up down in market now a days because of many reasons
Elections, war, Global data, USDINR, DXY.
So based on following all parameter i am trying to analysis crude oil price action, hope it helpful for all commodities trader.
As we can see in chart it is making bullish flag pattern on 4hr timeframe. So we will se break out up side and we can make better position according. It may trigger by global data or by war declare.
Plan your trade according your analysis. I do not recommended to do as i said. I just analysis chart pattern and data which make positive price action.
Best of luck
Regards.

Gas on GrowthOil and natural gas Prices are getting Hotter due to geopolitical instability.
Gujarat Gas is one of the beneficiary during this time and look at the chart it looking charming we might see the upside upto 595 in very short times and 620 further.
Educational purposes only there is involvement of risks of geopolitical and global events. so make your investment and risks carefully.

USOIL is ready to rock🚀US Oil is at important zone formation of Descending triangle pattern. If this sustain near Support then we can see a good upside move if break then see a huge fall. what is your view please comment it down. We are Certified. All views shared on this channel are my personal opinion and is shared for educational purpose and should not be considered advise of any nature

CRUDEOIL Future Analysis Intraday Support level at 7180 and resistance level at 7296.
1st Support level : 7181
2nd support level : 7082

Natural Gas Long Trade Setup !TREND ANALYSIS & TRADE SETUP !
WAVE ANALYSIS !!
Follow Chart Instruction.
Do not be Hurry for entry.
Wait for Proper Entry Setup.
Buy/Sell with Best Risk Reward.
Educational Chart Only.
Wait for ENTRY CONFIRMATION !
Risk : Reward: 5-6 times.

Crude Oil: Bullish Momentum ContinuesCrude Oil (MCX)
Current Market Price: Approximately 7005
We have observed a significant bullish trend in crude oil over the past few weeks. Unfortunately, due to certain reasons, we were unable to provide updates during this period. Nevertheless, it is never too late to analyze the market.
We remain optimistic about crude oil's prospects today. Crude oil has recently experienced a notable breakout, leading us to believe that it may reach levels of 7260 and 7590 in the coming days.
For the time being, we will set our stop-loss at 6670, and upon reaching the levels of 6900-6910, we may consider adding positions.
Stay tuned for further updates as the market progresses.

crude oil intraday levels for tradingMCX:CRUDEOIL1! watch crude below 7155 for short trade till 7102 zone

OIL Long Term Buy OpportunityOIL India has broken >10 year high and presents a good long term buy opportunity

UK OIL Technical Analysis - The weekly outlook for UK Oil looks very positive and promising
- The base is getting matured on the weekly whereas the Daily base has already matured
- As of now waiting for the base to form and enter once you see a low getting taken out by huge demand
- My Bias over this is straight bullish and nothing else to consider
05 Apr - Nifty was Flat, BankNifty picked up momentum!Nifty Analysis - Stance Bullish ⬆️
Recap from yesterday: “Now take a look at the 63mts chart, and see where the reversal came from ~ 22295 levels. That is the main reason why we said a stance change is required only if 22295 is broken and since we did not do that, we continue to remain bullish.”
Nifty had no momentum today, but BankNifty had lots of it. Yesterday SPX & NDQ had a real down day and its spillover effects were visible during the opening minutes. We opened gap-down and then slowly recovered from that. There were no abrupt or wild movements for a change. That takes me to the next question, why did we really have a 300+ point fall yesterday? It was not because of RBI MPC, otherwise we would have passed the swing high. How many of you think it could be because of the worsening situation in the Middle East?
Today was an inside day with no real momentum and that does not mean that we are not bullish. We will keep an eye on the Global macros, if the news about the War widening in scope both in Ukraine and Israel is true then it could really kill the optimism. Just before the macros worsen - GOLD prices go up. An escalation of tensions will shoot up the OIL prices as well. At present, we have both.

USOIL is ready to rockUS Oil is at important zone formation of pole and flag pattern.If this sustain then we can see a good move. what is your view please comment it down. We are Certified. All views shared on this channel are my personal opinion and is shared for educational purpose and should not be considered advise of any nature

Crude oil bearish engulfingOn weekly chart Crude is forming bearish engulfing pattern and at Bhoomi Maya's red band i.e. where any sell entry is activated.
Target green bands 5761 as T1

