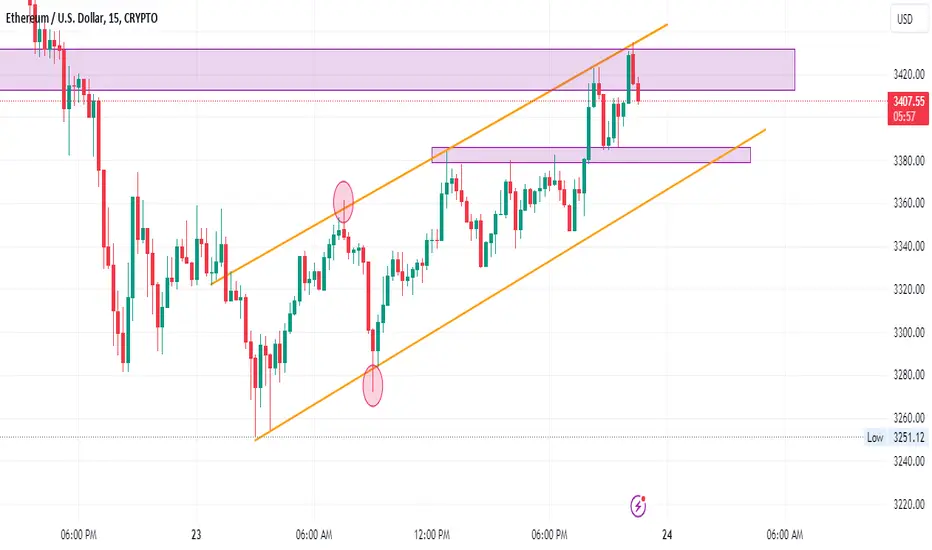
Ethereum ETH large parallel channelEthereum ETH large parallel channel, the upper line is the top, the middle line is the oscillation, and the lower line is the bottom.
ETH-D

$ETH Bull Flag Waiting for Breakout CRYPTOCAP:ETH Bull Flag Waiting for Breakout
ETH ETF approval date is around the corner. Major resistance at $3100 level. If it breaks $3200 resistance, we could see #ETH toward a new all-time high at $5000
However, below $3200, we might see $2400
Monitor the bull flag pattern closely.
#Ethereum

Bitcoin Urgent Chart UpdateCRYPTOCAP:BTC Urgent Chart Update
- #Bitcoin Rejected from HH/TL.
- We Already Profit in BTC/USDT Short Positions
- $57000 Possible Scenario
Key Levels to Watch:
$64,000: Critical! Above this, a path to $100k opens.
$65,540: Ideal stop loss for short positions.
$57,000: Breaking $57k Mean #BTC could drop to $50k
Stay alert and manage your positions carefully!

Reaching at 3400ETHUSD is looking for long opportunity after forming corrective formation, expecting target to reach at 3400

Important Liquidation Levels for Bitcoin: $50k - $73kImportant Liquidation Levels for Bitcoin: $50k - FWB:73K
#Bitcoin Liquidation Heat Map:
Approximately $3 billion can be liquidated up to $71,715. Key levels to watch:
➡ $67,420: $2.75 Billion in potential liquidations.
➡ $50,000: $5 Billion waiting to be liquidated.
Key Areas to Monitor:
➡ $56.9k - $52.1k: Weaker liquidations.
➡ $59.5k - $58.5k: Heavy liquidation zone.
➡ $52.1k - $50k: Another heavy liquidation zone.
Scenarios:
➡ Below $50k: ~$5+ billion could be liquidated.
➡ Above $74k: $6.1 billion might get liquidated.
Current price is around $63k!
Stay alert!

$ETH Flag Pattern Alert: Below $2000 or Above $3300 for Bull RunCRYPTOCAP:ETH Flag Pattern Alert: Below $2000 or Above $3300 for the Next Bull Run
Bullish Outlook: #Ethereum is forming a bullish flag pattern, but the real confirmation will come with a breakout above $3300. Until then, don't fall for potential fakeouts.
Entry Strategy: Consider buying below $2000 if prices dip. A sustained breakout above $3300 could propel #ETH toward $10,000.
Support: $2200/$1500
Resistance: $3300/$4000
Watch Out: Keep a close eye on price action before making high-leverage trades.

ETH/BTC Technical Analysis UpdateETH/BTC Technical Analysis Update
▪️Bounced off green box support, indicating bullish momentum.
▪️ ETH/BTC Broken out on daily chart, positive for CRYPTOCAP:ETH and #Altcoins
▪️ CRYPTOCAP:BTC dominance declining, favorable for #AltSeason
Are you prepared for potential Altseason?

BTCUSDT.P | 4H | TECHNICAL CHART | Hello traders, Wait breakout !
PS: Thank you very much that you support me with your likes and Comments
If you have another analysis at this pair, please share in comments, I will be glad to discuss with you.
Please don't forget to like my posts for continuous update.
TraderTilki

#GEM 50x Potential Coin Alert: QTK/USDT #GEM 50x Potential Coin Alert: QTK/USDT
- Quantcheck: A Groundbreaking AI-Based Backtesting Project
- Potential: Quantcheck holds tremendous long-term potential, with expectations to deliver returns ranging from 10x to 50x during this bull run.
- Entry Point: $0.5-$0.6
Accumulation Strategy: Buy on dips — each dip is an opportunity to accumulate more.
- Targets:
TP1: $10
TP2: $20
TP3: $30
- Stop Loss Strategy: Utilize dips as buying opportunities, not stop-loss events.
NFA & DYOR

Ethereum Technical Analysis Update#Ethereum Technical Analysis Update
Chart Pattern: Bull Flag Formation
Ethereum is showcasing a classic bull flag pattern on the ETH/USDT chart. This is often a bullish continuation pattern, indicating potential upward momentum if the market conditions align.
Key Breakout Level: $3,250
If Ethereum breaks and holds above the $3,250 resistance level, we are likely to witness a significant rally. A successful breakout could potentially set CRYPTOCAP:ETH on a path to a new all-time high! Keep an eye on this crucial level for decisive moves.
Support: $2,750
Resistance: $3,250
Trade Wisely and Always Use Stop Loss.

#Bitcoin Bull Flag Analysis #Bitcoin Bull Flag Analysis
The #BTC Bull flag is currently holding $60,000 price Level.
A bull flag is forming with a target lying around $1,18,000
For this pattern to play out CRYPTOCAP:BTC must be above $60,000 Level.
Note: If break $60,000 level then ready for $45000
Like/RT if you agree

Bitcoin Red alertDon't get wrecked! #BITCOIN
Scalping with high leverages during times like these is a risky game. Market makers are toying with global sentiments, especially with the Big #BitcoinHalving just around the corner.
Cut through the noise; stick with spot trading exclusively.
Stay safe, earn safe.

ETHEREUM Chart Analysis before Halving #ETHEREUM CHART ANALYSIS
Current Price: $3040
Pattern Formation: Bull flag with strong support at $2900
Potential Scenario: A bounce could drive CRYPTOCAP:ETH to $3250, while rejection might lead to a retest of $2000 levels.
Important Levels to Watch:
Support: $2900 / $2200
Resistance: $3250
Keep a keen eye on these critical levels

Reaching at 3400ETTHUSD is looking for long opportunity and expecting to reach at 3400$ and has forming correction on higher timeframe

Time to Take Your Money? Tips After $TAO Big Exchange ListingTime to Take Your Money? Tips After GETTEX:TAO Big Exchange Listing
#TAO Hits Binance
Huge props to
@opentensor
for listing TAO on the world's top exchange, sparking an epic season for $TATSU
Peak Price: TAO hit $1,249
Good News for #TATSU : It's looking up because of TAO's success.
Cheers to Early Investors: If you got TAO early, you're in a good spot.
Market Snapshot:
Last 10 Months: +2500% ( 4000% if High Consider )
Last 6 Months: 16x gains
Post-Listing: +35%
Attention: Watch the $550 support. Falling below? Bearish signs ahead.
Strategy Tip: Enjoyed the pump? Consider securing profits. Market dynamics are shifting!
Again Remember Never forget to book profit & Keep tight Stop Loss if you want to Fresh Entry in TAO
#Bittensor #Crypto

#ETHEREUM Chart Update #ETHEREUM Chart Update
CRYPTOCAP:ETH is currently testing its support level.
We're keeping an eye on it!
If it falls below this support, it might not look good for the market for a bit.
I think we might see a lot of ups and downs leading up to the halving.
Stay tuned!
#ETH #Altcoins

Movement to the downsideETHUSD is looking for short after forming corrective formation & expecting target to reach at 2800$

ORDI/USDT Chart AnalysisORDI/USDT Chart Analysis
▪️300% Potential From This Level
▪️RED BOX is our SL if Trend Reverse
▪️BULL FLAG in Daily Time Frame
▪️Accumulation Zone: $70-$60
▪️Daily Candle Close below $56 Mean Exit
#ORDI #TechnicalAnalysis #Crypto

#ETHEREUM READY FOR NEW ALL TIME HIGH #ETHEREUM READY FOR NEW ALL TIME HIGH
1⃣ Breakout Triangle Resistance & did Perfect Retest
2⃣ Also Formed Inverse H&S Pattern NECKLINE Breakout & Retest Done
3⃣ CRYPTOCAP:ETH Must Hold $3450 Support for New ATH
4⃣ Next Targets Would be $4068/$5000
5⃣ Always Use Stop Loss as per your Risk Reward Ratio
Share/Comments if you agree with My Setup.
NFA

Looking for ShortETHUSD is forming a movement to the downside & expecting target to reach at 2800 by the end of March

Looking for ShortETHUSD is looking for short & expecting target to reach at 2800$ & has clear movement to the downside.

Ethereum is Critical levelEthereum Critical level, Ethereum is at important level and Forming a Channel Pattern Let's see this sustain or not. what is your view please comment it down. We are NISM Certified. All views shared on this channel are my personal opinion and is shared for educational purpose and should not be considered advise of any nature.
#ETHEREUM READY FOR BIG DUMP?#ETHEREUM READY FOR BIG DUMP?
1⃣ CRYPTOCAP:ETH Broken TL and Retest also Completed ✅
2⃣ Targets: $3261 & $2906 ( Red TL = Resistance )
3⃣ Stop Loss: If Candle Close Above Red TrendLine
4⃣ Already Gave 14% TP in Spot. ( Risk Reward: 1/3.5 )
5⃣ Long Term I am Always Bullish & Will try to Add at Every big Dip
6⃣ My Trade Now in 57% Profit
