Ethereum Accumulation Before BreakoutEthereum has regained bullish momentum after a recent correction phase, supported by improving sentiment in the broader crypto market. The asset is displaying early signs of stabilization as traders begin accumulating around value zones, indicating renewed confidence among market participants.
From a macro perspective, Ethereum continues to benefit from increasing network activity, particularly within the DeFi and Layer-2 ecosystems. The sustained growth in on-chain transactions and staking participation reflects long-term investor interest, adding strength to the current recovery phase.
Market data also shows that institutional inflows into major crypto assets are on the rise, with Ethereum standing out due to its strong fundamentals and ecosystem resilience. This inflow supports the likelihood of a continued price rebound, as liquidity and trading volume remain consistent.
Overall, ETHUSDT is showing a constructive recovery setup. The combination of improving sentiment, strong fundamentals, and gradual accumulation suggests a potential medium-term bullish continuation, provided global market conditions remain favorable.
ETH

Ethereum’s Next Move: $3,000 Buy Zone or $10,000 Breakout?Ethereum’s Next Move: $3,000 Buy Zone or $10,000 Breakout?
Current Market Overview:
Ethereum is currently trading below $4,000, indicating short-term weakness as bulls struggle to regain control. The $4,000 level remains a key pivot point, holding above it is essential for any sustained move toward higher targets.
Key Levels to Watch:
🔹 Immediate Resistance: $4,000
🔹 Major Support Zone: $3,000 – $2,600 (ideal accumulation area)
🔹 Upside Targets: $8,000 – $10,000 (if $4,000 is reclaimed)
Bullish Scenario:
If Ethereum breaks and holds above $4,000, it confirms bullish momentum and opens the path toward $8,000–$10,000 in the mid to long term.
Bearish / Accumulation Scenario:
If ETH remains below $4,000, expect a possible retracement toward $3,000 – $2,600. This zone could act as a strong accumulation area for long-term investors.
Outlook:
The broader structure remains long-term bullish despite short-term pullbacks. Dips into major support zones should be viewed as opportunities for strategic accumulation.
⚠️ Note: Always DYOR (Do Your Own Research) before making any investment decisions. This analysis is for educational purposes only.

If Bitcoin Loses This Level: Expect the Biggest Correction YetIf Bitcoin Loses This Level: Expect the Biggest Correction Yet
Current Market Overview:
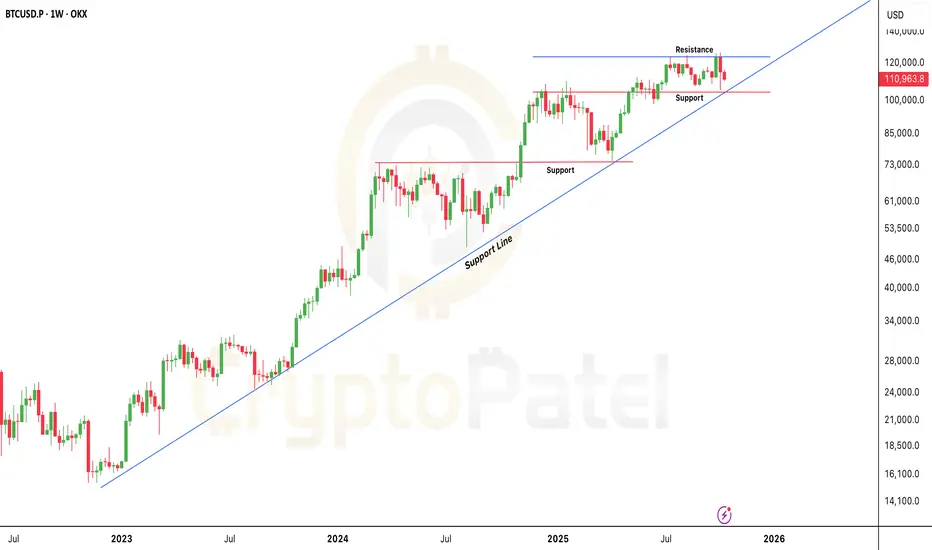
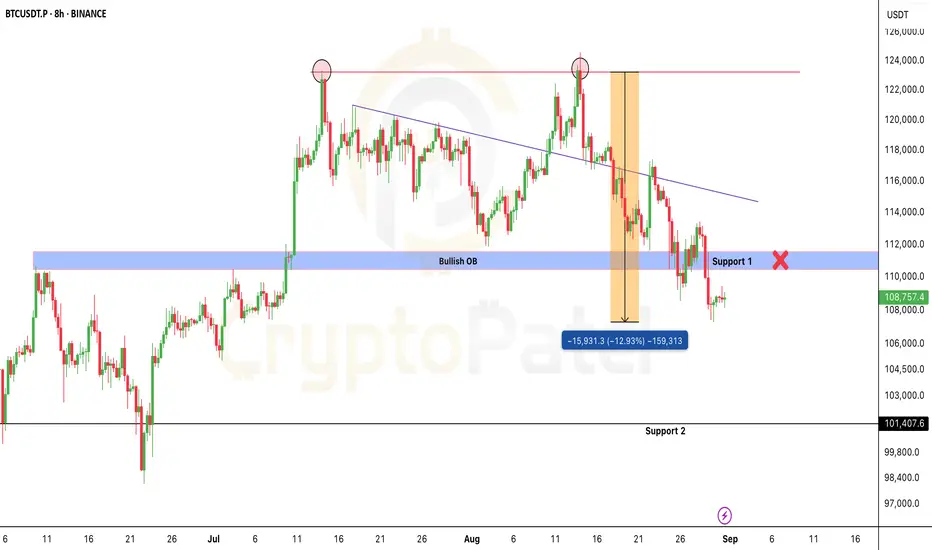
Bitcoin is trading above $110,000, maintaining a bullish stance for now. However, short-term momentum looks weak as the market tests crucial support levels.
Key Support Zone:
The most critical area to watch is $104,000 – $105,000.
This zone aligns with the long-term bullish trendline, which has held firm through multiple market corrections.
As long as price stays above this trendline, the broader trend remains bullish.
Bullish Scenario:
If Bitcoin holds above the $104,000 support level, it signals strength and potential continuation of the uptrend.
In that case, the next upside target remains around $150,000 in the coming months.
Bearish Scenario:
If the $104,000 trendline breaks decisively, Bitcoin may enter a deeper correction phase.
Downside targets could extend to below $100,000, and in a worst-case scenario, even toward $80,000.
Technical Summary:
🔹 Immediate Resistance: $110,000 – $112,500
🔹 Major Support Zone: $104,000 – $105,000
🔹 Trend Bias: Bullish above $104,000 | Bearish below $104,000
🔹 Long-Term Target: $150,000 (if support holds)
Trading Insight:
This is a decisive zone for Bitcoin. Bulls must defend $104k to maintain structure.
Below it, expect volatility and potential trend reversal signals.
NFA & DYOR
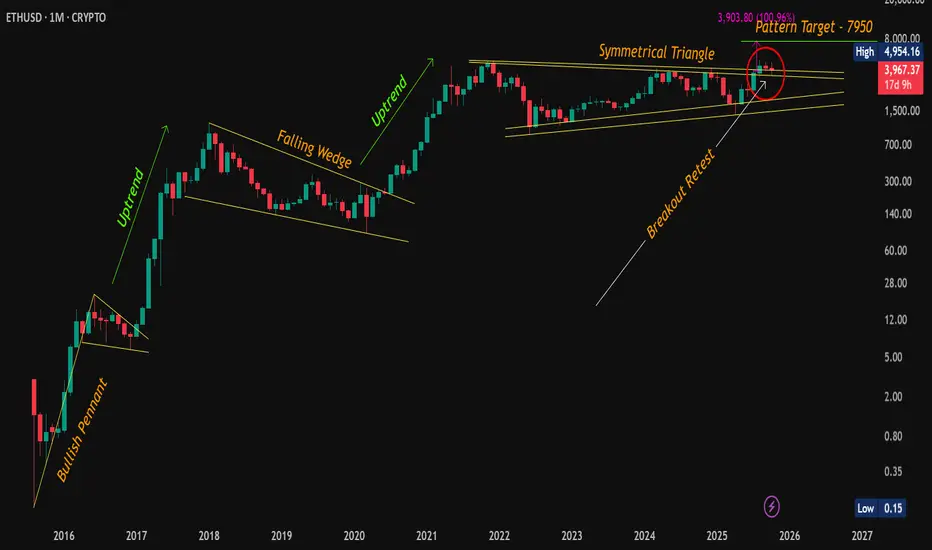
ETH Retest Confirmed – Bullish Momentum Intact!CMP: $3,968
Ethereum is holding strong above the symmetrical triangle breakout zone after a textbook breakout + retest . Despite the recent consolidation, the structure remains bullish , and the bigger pattern is still in play.
🔶 Technical Highlights:
✅ Symmetrical Triangle Breakout: ETH successfully broke out and retested the upper trendline (see red circle). This retest confirms the breakout validity.
✅ Consolidation Above Resistance: ETH is consolidating in a tight range above previous resistance , forming a potential bull flag .
✅ Pattern Targets Remain Active:
📍 Symmetrical Triangle Target: ~$7,950
📍 Bull Flag Target (if breakout confirms): ~$7,365+
📈 Market Structure:
📍 Previous breakouts (Bullish Pennant in 2016, Falling Wedge in 2019) led to strong uptrends .
📍 Current consolidation mirrors historical patterns that preceded major rallies.
🟢 Key Level to Watch:
📍 A monthly close above $4,954.16 (previous ATH) would mark the next major confirmation, likely attracting breakout traders and institutions.
💡 ETH is showing maturity in structure – breakouts, retests, and consolidations are happening on higher timeframes with clear technical precision. The longer this base holds, the stronger the eventual move could be.
📌 Disclaimer: This analysis is shared for educational purposes only. It is not a buy/sell recommendation. Please do your own research before making any trading decisions.
#ETH | #Ethereum | #Crypto | #Breakout | #ChartPatterns | #SymmetricalTriangle | #BullFlag | #PriceAction
BNB 400% up from our Entry People laughed when I said CRYPTOCAP:BNB will hit $2000–$3000.
but people still doubt my $2000–$3000 targets? 🤔
From 1st Entry of this bull run: +400% ( TP1 ✅ )
From $500 re-entry: +120%
You can doubt targets, but not momentum.
Just don’t forget — book profits.
Because trading without a safe zone = casino mode.
Not Financial Advice

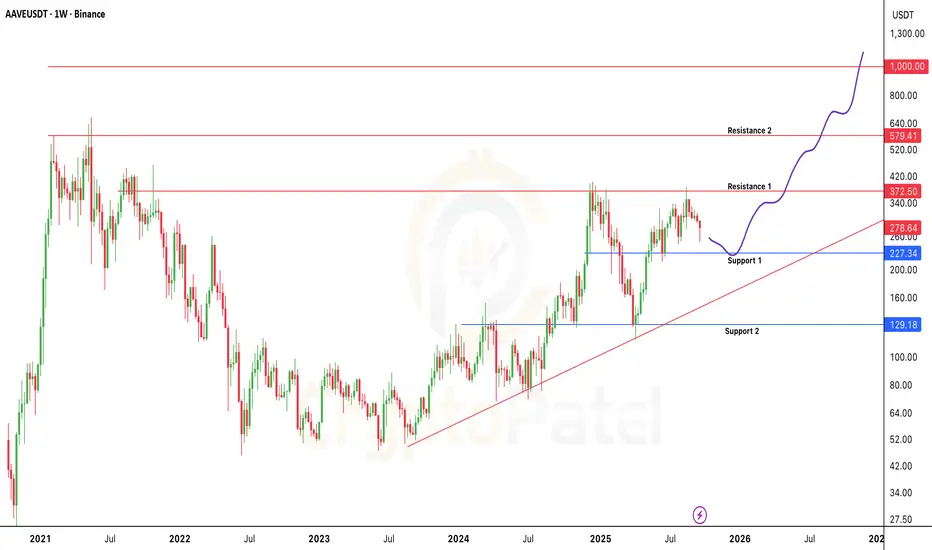
AAVE/USDT Potential to hit $1000Why CRYPTOCAP:AAVE could hit $1000 🚀
V4 launch: Major upgrade boosting fees, TVL & adoption
GHO stablecoin grows, adding revenue
Buybacks + more liquidity driving value
Bear Case:
If Market crash then We can see $200-$150
AAVE has the potential to explode, but watch these risks.
NFA & DYOR
ETHEREUM | VISUAL ART with PipGuardETHEREUM | VISUAL ART with PipGuard
Article published by PipGuard™ on the TradingView® platform – to continue this free publication, LEAVE A BOOST and a COMMENT, hit the notification bell, and never miss ANOTHER ANALYSIS.
ANALYSIS
Hello colleague, how are you?
Today I bring you a different kind of analysis, designed to be understood on a purely visual level. Because when we're in front of the chart, in the arena, in the cage... there's no room for bullshit or distractions. Here, we fight, and whoever comes in with a confused mind always ends up crushed.
Trading is a ruthless game, like a game of chess. And the winner isn't the one who knows a thousand abstract theories, but the one who has clear ideas, simple concepts, and concrete results.
Think about it: there are few pieces on the chessboard, but the possible moves reach 10^120. That means there are more combinations in a game of chess than stars in our galaxy. An insane number. Yet, the winner isn't the one who gets lost in complexities, but the one who knows how to move those few pieces well with cunning, craftiness, and awareness.
Trading is nothing but this: a continuous battle between you and the market. It moves its pawns, it provokes you, it deceives you, it tries to screw you over. And you? You must observe, wait for its move, analyze it, imagine its counter-move, and only then react.
The tools are few and clear: liquidity, support, resistance, trend.
You don't need an infinite arsenal: you need the basics, the ability to interpret, and the coolness to respond.
I dedicate most of my time to the charts, studying the market, building indicators that actually work instead of complicating life. Over the years, I've understood that behind every strategy, every concept, every approach, there's always a common denominator: simplicity .
So remember this well, colleague: you hold the power in your hands, the power to decide. The market has made its move... what about you? How will you respond?
NEWS
✅ Ethereum is shining again as “digital oil” with a +200% rise in five months, driven by massive institutional investments via ETFs, making Bitcoin pale in comparison!
✅ ETFs and whales are pumping Ethereum: bullish flows and strategic accumulations are putting directional pressure on the price; it looks like it's set for the next push.
SECRETS
🔓 Ethereum is transforming into ultra-sound money: thanks to EIP-1559 and the Merge, it now burns more ETH than it issues daily, with emissions crushed to 1,600 ETH/day, compared to the 13,000 under PoW.
🔓 A core dev's wallet was cleaned out by a malicious AI extension: a sophisticated attack that rips ETH directly from the platform's tech heart.
GREETINGS
Remember to leave a GREETING 🚀 or a COMMENT not because I need the likes, but because every boost does more for morale than a double espresso with cream.
Talk to you soon,
PipGuard
Article published by PipGuard™ on the TradingView® platform

Bitcoin Chart Analysis And Bearish overview #BTC Bearish Outlook
Bitcoin stays bearish below $113,400.
No H4 close above = downtrend intact, targeting the $100K psychological level.
Break $100K support, and liquidity near $90K becomes the next magnet.
Key levels:
$113,400 → HTF resistance
$100,000 → Psychological support
$90,000 → Demand zone
Already 13% down from our short entry, hope you caught the move. 🫡
NFA & DYOR
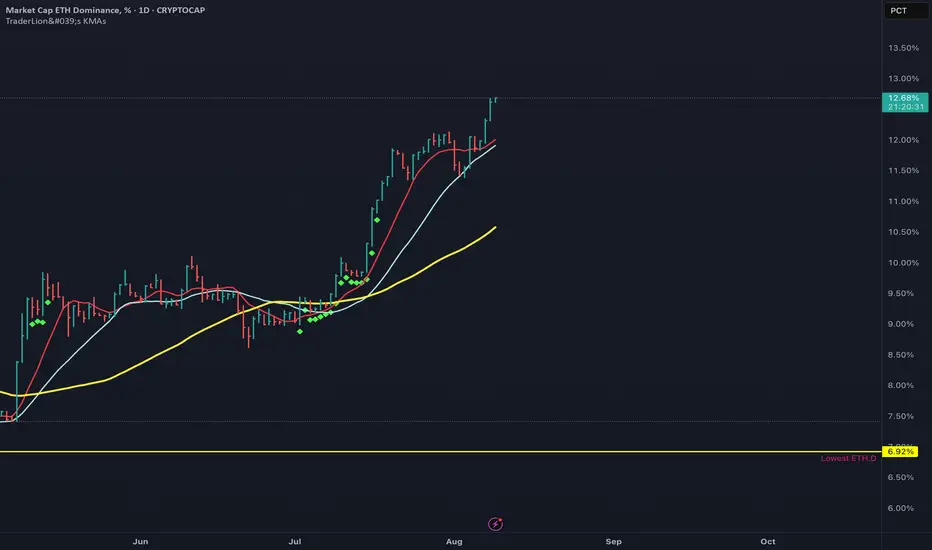
ETH DominanceETH market cap dominance has been stuck around the 9.3% level for a while, but now it’s breaking out and sitting around 12.6%. That’s a strong move, showing ETH is gaining ground compared to BTC.
What the chart is telling us:
Just broke through the 9.9% resistance and is holding above it
Moving averages are pointing up and momentum looks solid
If this keeps going, we could see 13–14% soon, maybe even 15% later on
If it drops back under 9.9%, that would weaken the setup
Why ETH might keep climbing
Institutions are loading up
Big companies are starting to put more of their treasury money into ETH. One example is Fundamental Global, which has a $5 billion Ethereum plan. They like ETH because it gives staking rewards, powers DeFi, and is at the center of tokenization.
401(k) crypto plans are now allowed
The US recently made it possible for retirement plans like 401(k)s to have crypto, including ETH. This could eventually bring in trillions of dollars into the market.
ETH turns 10
Ethereum just hit its 10-year mark. Long-term predictions are huge, with some saying it could hit $10k by 2030 and others going way higher. Over the years, ETH has gone from proof-of-work to proof-of-stake, rolled out upgrades like Dencun, and is planning more improvements like Pectra to make it faster and cheaper to use.
Eth s targets for sureEthereum 's targets for sure
Logarithmic history has certain basic growth factors , as per the logarithmic growth eth is just starting
Atleast 600% - 630% from the recent deep dip will be there

ETH on the road to $10,000? Let’s break it down🔥 ETH on the road to $10,000? Let’s break it down 👇
Here’s why ETH looks stronger than ever:
1️⃣ Big Money Flowing In
🔹 ETFs & public companies bought 4.4M ETH ($20B) this quarter.
🔹 Whales & Web3 firms added another 2M ETH.
🔹 That’s more than 5% of total supply absorbed in just months.
2️⃣ Record Network Growth
🔹 DEX trading volume at new highs.
🔹 Daily transactions & active wallets breaking records.
🔹 Stablecoin supply at ATH.
👉 Demand for Ethereum’s network is exploding.
3️⃣ Massive Supply Crunch
🔹 30% staked, 8% with institutions, 25% with long-term holders.
🔹 5% permanently lost.
🔹 Only 12% left on exchanges, shrinking fast.
🔹 Inflation rate just 0.5%, even lower than Bitcoin.
With retirement funds opening ETH access, rate cuts coming, and pro-crypto regulations, the demand will only increase while supply dries up.
Short-term dips may shake out weak hands… but the bigger picture is clear: ETH is heading above $10K this cycle.
Note: NFA & DYOR

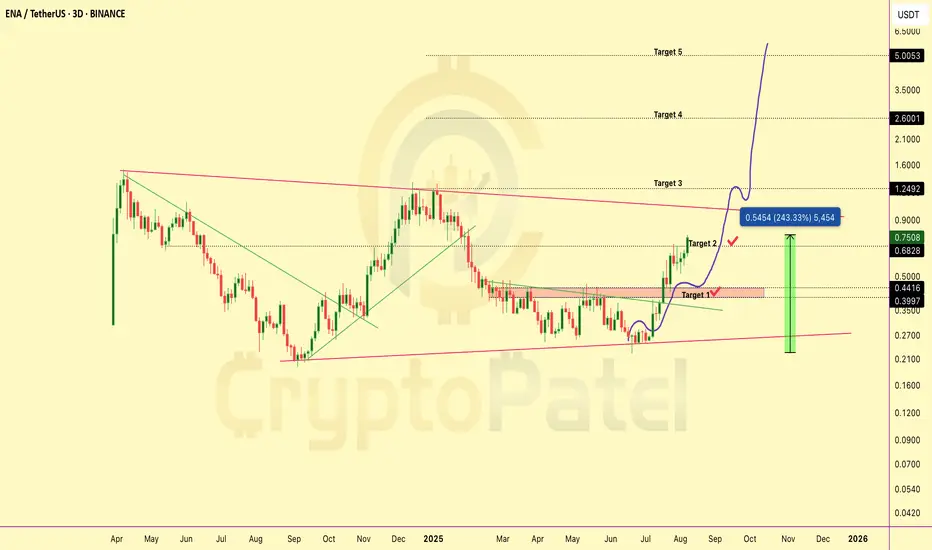
$ENA Up 243% From My $0.25 Entry And I’m Still BullishMIL:ENA Up 243% From My $0.25 Entry And I’m Still Bullish
Now MIL:ENA is trading at $0.75 and up 243% from our $0.25 entry ✅
TP1 and TP2 hit ✅ and I’m still super bullish, eyeing $1 / $2 / $5 next.
But remember, Greed has no limits.
Smart traders book partial profits and ride the rest with house money.
NFA & DYOR
#ETHEREUM – Macro Breakout Setup#ETHEREUM – Macro Breakout Setup 🚀
▶️ 6th time in history testing $4K macro resistance.
▶️ A clean weekly close above could ignite HTF expansion to $8K → $10K → $15K.
6 rejections in 4 years… one breakout can change it all.
NFA & DYOR

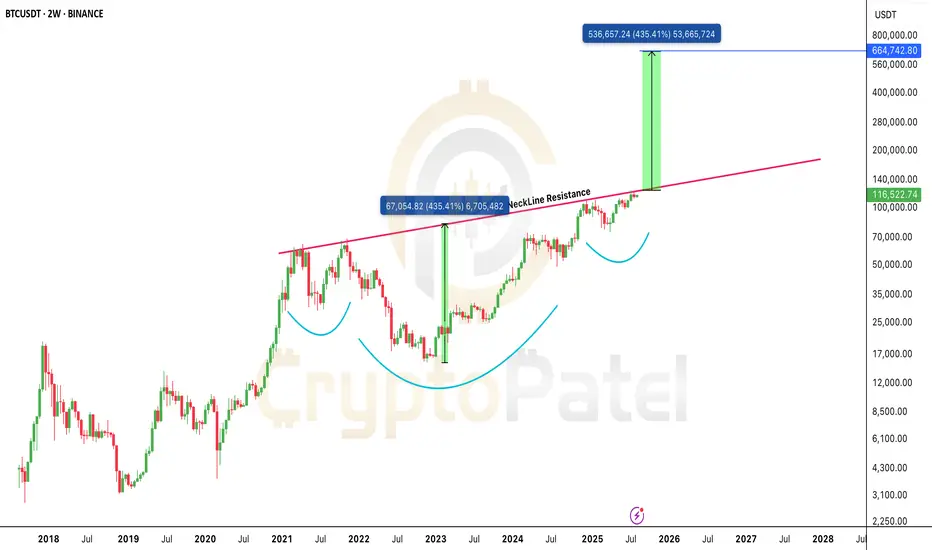
Bitcoin’s $664K Target Is Not a Joke: It’s a Chart-Based WarBitcoin is forming a massive macro structure and the neckline is the final barrier.
Break above it, and the technical target stretches to $664,000.
Yes, you read that right.
This isn’t hopium. It’s based on measured move projections from the breakout zone.
The only question now:
Does BTC explode to $664K this cycle… or in the next?
One breakout changes everything.
Watch the neckline. Stay focused.
Note: NFa & DYOR
KAITO is holding strong - breakout could lead to 500% upside!KAITO is holding strong - breakout could lead to 500% upside!
Price is hovering above a strong accumulation zone ($0.75–$0.90) after hitting the recent bottom at $0.669.
If this base holds, a breakout above the trendline + $1.25 resistance could trigger a bullish move toward:
$2/$3.5/$5+
That’s a 542% upside from the lows.
Watch for breakout confirmation. This setup looks like a Bullish reaccumulation before markup.
Not Financial Advice so DYOR

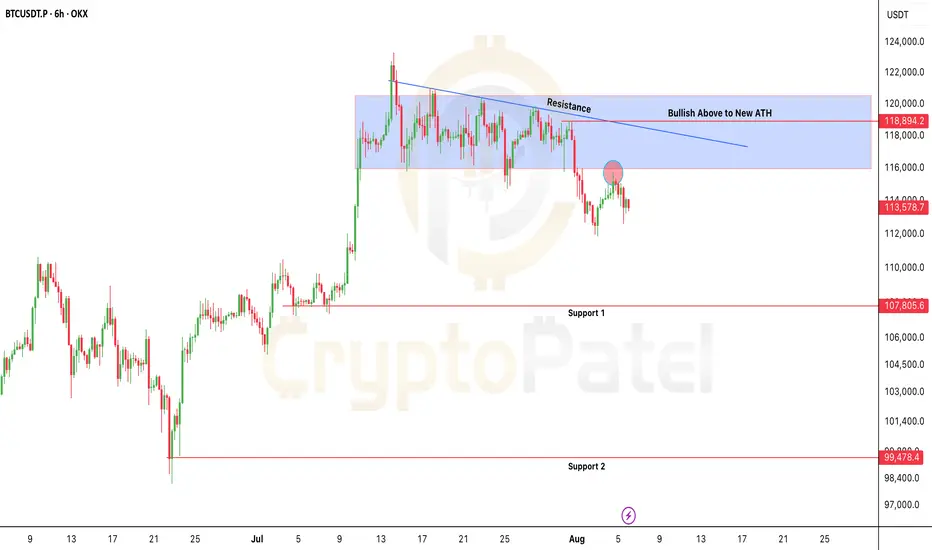
Bitcoin at Risk: $115.7K Is the Line Between Bounce or BreakdownBitcoin at Risk: $115.7K Is the Line Between Bounce or Breakdown
CRYPTOCAP:BTC is trading below key resistance ($115.7K–$118.9K) and rejected cleanly at the trendline.
As long as price holds below $115,700, bearish bias remains.
⚠️ Failure to reclaim = high risk of breakdown toward $107K and even sub-$100K levels.
Bearish invalidation only above $119K
NFA & DYOR
Urgent Bitcoin Update: BTC Must Hold $110K🚨 Urgent Bitcoin Update: BTC Must Hold $110K – Or Risk Dropping Below $100K
BTC is trading near $113,900, sitting right on key support at $112K–$110K.
This zone is crucial- Holding it could lead to a rally toward $150K ATH.
But if BTC breaks below $110K, expect downside pressure with possible moves to: $100K / $93K / $83K
Price has also broken below the ascending trendline- a bearish sign unless bulls step in.
I mentioned exiting around $122K–$123K: Hope you booked profits ✅
Now, just observe how BTC reacts between $110K–$112K.
Note: NFA & DYOR

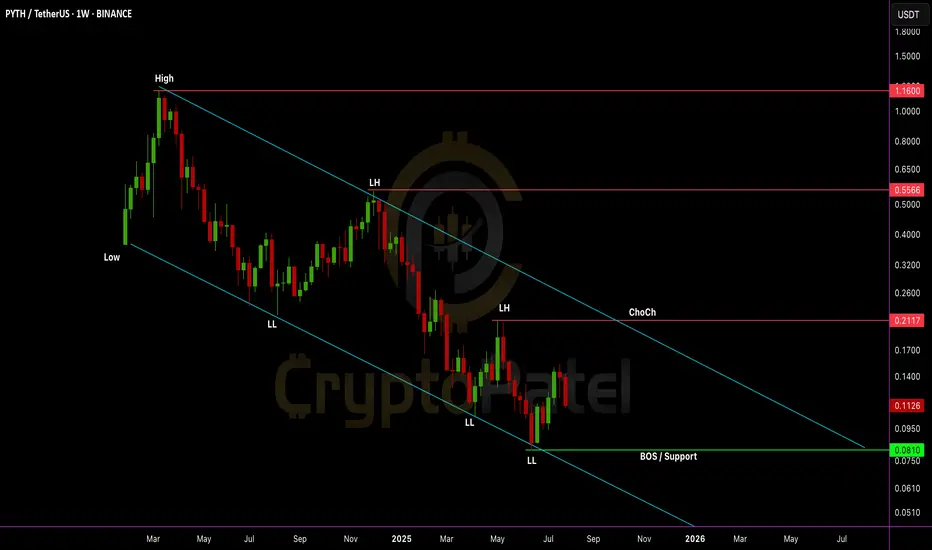
Will $PYTH go to $1 or drop even lower?Will EURONEXT:PYTH go to $1 or drop even lower?
Chart is still bearish with LL + LH structure.
But $0.0810 is a key level. If it holds, a trend reversal is possible. Accumulation zone: $0.085–$0.110
Risky entry, but R:R is huge. Hold = 10x potential to $1+
Break below $0.0810 = new LL incoming.
NFA & DYOR
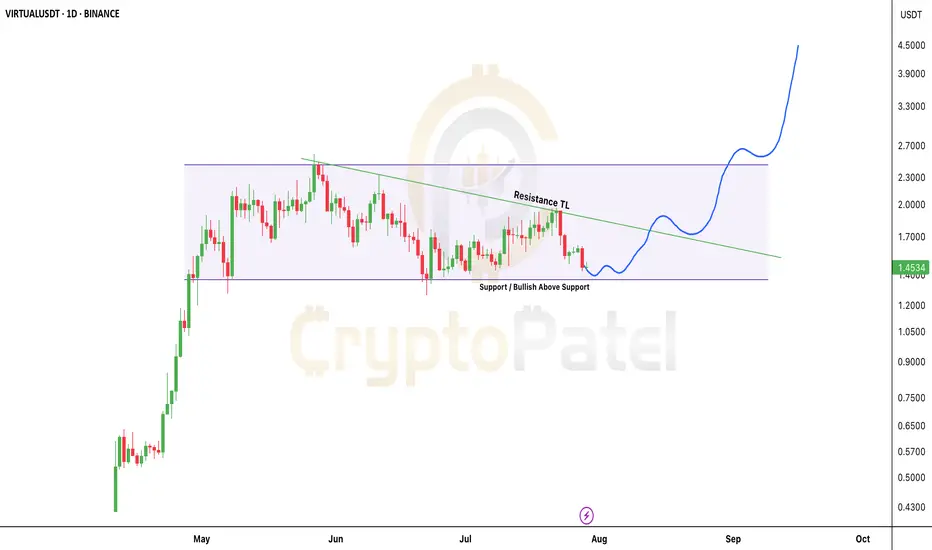
$VIRTUAL Gaining strength- hold above $1.30 could send it to $5$VIRTUAL/USDT: SPARKS:VIRTUAL is Gaining strength- hold above $1.30 could send it to $5+
Price is respecting the accumulation range between $1.30–$1.60 with multiple successful retests of the demand zone at the base.
🔹 Structure: Accumulation phase within a descending triangle
🔹 Support: Strong base at $1.30 – bulls defending this level consistently
🔹 Resistance: Descending TL compressing price- breakout imminent
🔹 Bias: Bullish above $1.30
Expectations:
✅ Clean breakout above the TL (~$1.60) will flip structure bullish
✅ Post-breakout targets: $2.00/$2.70/$4.50+
✅ If $1.30 continues to hold as HTF support, I’m expecting $5+ in the coming days.
Invalidation: Any HTF close below $1.30 shifts the bias.
Watch for breakout volume- confirmation will trigger rapid upside movement.
NFa & DYOR
ENA/USDT Now 200% up from our EntryMIL:ENA Update: Strong Momentum in Just a Few Days
I shared an early entry below $0.25, and now MIL:ENA is trading above $0.67 that’s nearly 2.8x your capital from our entry.
Both Target 1 and Target 2 have already been hit.
I remain very bullish on MIL:ENA for the long term, with a potential to reach $5. However, keep in mind the risk is higher at this stage, but the reward could be significant if it reaches that level.
If you entered early, consider booking some profits or at least secure your principal and let the rest ride.
Thanks to everyone who trusted my analysis, slow and steady can bring big returns.
NFA & DYOR

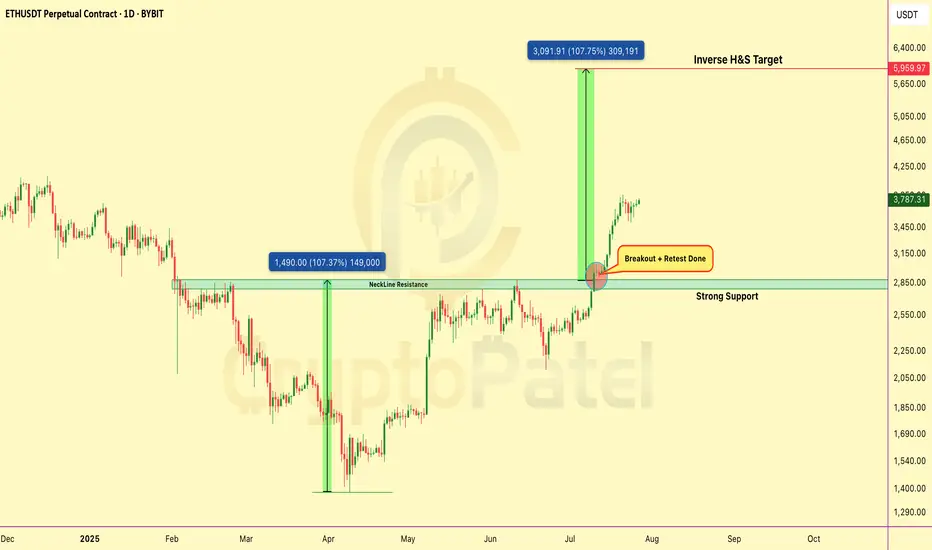
Ethereum Breakout Confirmed – Retest CompletedCRYPTOCAP:ETH has broken out Inverse Head & Shoulders on daily chart.
✅ Neckline breakout above $2,850
✅ Retest successful – strong support confirmed
✅ Targeting full move toward $6,000
Structure is bullish, momentum building. As long as #Ethereum holds above the neckline, continuation is likely.
Note: NFA & DYOR
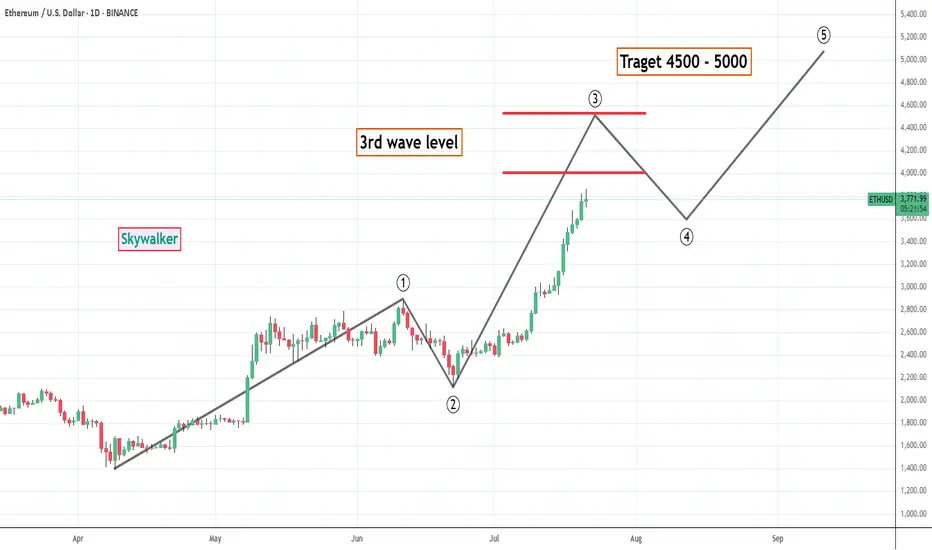
ETH - Target 4500 to 5000 as per wave theoryETH is showing movement as per wave theory so forecasting end of this bull run or possibility of correction can be arrived. clearly eth is in 3rd wave which could end anywhere at the redlines drawn in chart and based on which wave 4 and 5 can be approximately arrived at. what ever be the 3rd wave level ETH is sure to touch 4500 before showing bigger correction. And i think 5000 is also possible easily. For now holding bigger or decent qty long in ETH is suggested with proper money management.
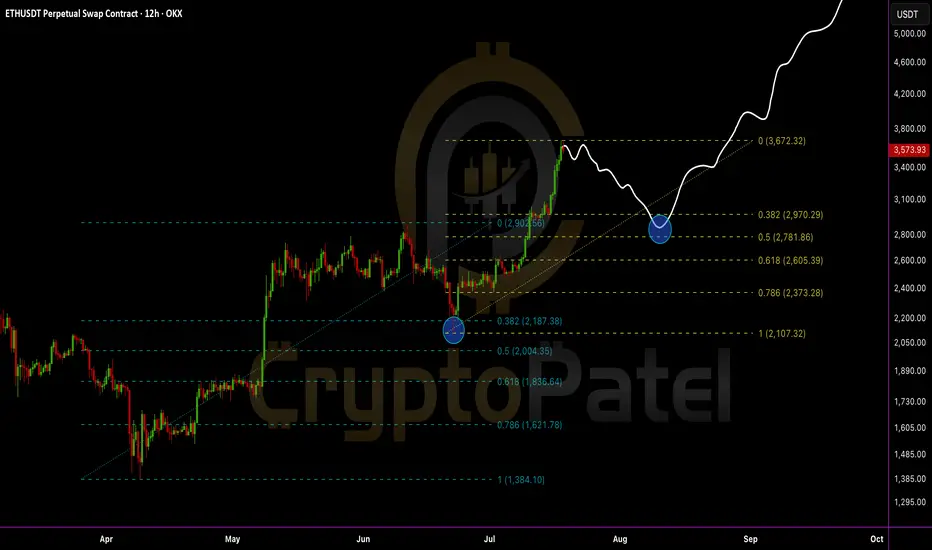
Everyone’s bullish now… but smart traders are waiting for this EEthereum just tapped a key resistance near $3,672 and is starting to show signs of cooling off.
A healthy retracement could bring ETH back to:
0.382 Fib – $2,970
0.5 Fib – $2,781
0.618 Fib – $2,605 (Strong demand zone)
IMO, we can expect ETH to revisit the $2,700–$3,000 zone before the next leg up.
This area will be the golden re-entry for long-term targets of $6,000–$8,000.
Stop-loss: Recent high and candle close above $3,675
Structure remains bullish:
✅ Previous dips into Fibs triggered strong buybacks
✅ Clean higher highs and higher lows
✅ Demand zone + retracement = opportunity
My View: Let price pull back. Then load up again. Bigger wave incoming.
DYOR | NFA