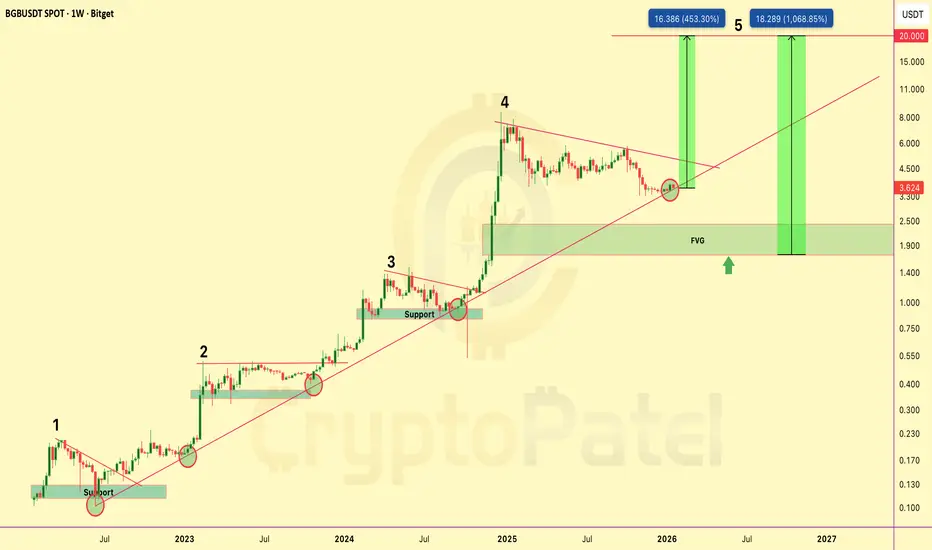
$BGB PRICE PREDICTION | 450%–1000% POTENTIALBGB is trading inside a well-defined long-term rising channel on the weekly timeframe, respecting bullish market structure since 2022.
Price has completed a full accumulation → expansion cycle and is currently undergoing a healthy corrective phase before the next impulsive move.
Technical Structure
Long-term ascending trendline remains intact
Clear 5-wave Elliott structure on HTF
Wave 4 correction following a strong impulsive expansion
Price reacting from dynamic channel support
HTF Fair Value Gap (FVG): $2.40 – $1.70
Bullish structure maintained above $3.40
Upside Targets (Wave 5 Extension)
$10
$15
$20
Alternative Scenario
If price breaks below $3.40 and an HTF candle closes below this level, there is a high probability of a move toward the $2.00 support and HTF FVG zone, which would represent a strong long-term accumulation area rather than trend invalidation.
Bias & Invalidation
As long as BGB/USDT holds above the rising channel support, the macro bullish bias remains intact.
Invalidation: Weekly close below the rising channel.
Technical analysis only. Not financial advice. DYOR.
Ethereum (Cryptocurrency)
ETHUSD – Daily Timeframe AnalysisETH is currently trading in an upward trend, forming higher lows, which shows bullish strength in the market. Price is respecting the ascending trendline, indicating buyers are still in control.
🔹 Entry Zone:
Price is reacting near the trendline support, making this a buy-on-dip opportunity.
🔹 Stop Loss:
Placed below the recent support zone to protect against trend failure.
🔹 Targets:
Target 1: Previous resistance / minor supply zone
Target 2: Major resistance area above (strong selling zone)
🔹 Market Structure:
Higher Highs & Higher Lows ✅
Trendline support holding ✅
Bullish continuation setup 🚀
⚠️ Risk Management:
Always wait for confirmation and manage position size properly. This setup works best if the trendline continues to hold.
📌 Bias: Bullish
📌 Timeframe: 1D
📌 Asset: ETHUSD

$DYDX PRICE OUTLOOK | 3000%+ POTENTIAL FROM MACRO SUPPORT?DYDX/USDT PRICE OUTLOOK | Macro Support & High R:R Setup
DYDX is currently trading at a major higher-timeframe demand zone on the 2-week chart, following an extreme ~99.45% drawdown from its all-time high. Historically, such deep retracements often precede long-term re-accumulation phases, especially when aligned with structural support.
Market Structure Overview
Price remains within a multi-year descending channel active since 2022. The current price action is testing the lower boundary of this channel, which aligns with a clearly defined horizontal accumulation zone ($0.15–$0.20). This creates a strong confluence-based support region.
Technical Confluence
Descending channel support respected on HTF
Strong historical demand at $0.15–$0.20
~99% retracement from ATH completed
Compression near support suggests potential volatility expansion
Bias remains bullish as long as HTF structure holds
Upside Levels (If Breakout Confirms)
Resistance 1: $0.84
Resistance 2: $2.19
Resistance 3: $4.39
ATH Supply Zone: $27.85
A confirmed HTF close above descending trendline resistance would validate a structural trend reversal. The measured move from this base projects toward $3.85, representing a potential ~3200% upside from current levels.
Invalidation
Any 2-week candle close below $0.15 invalidates the accumulation thesis and requires reassessment.
Conclusion
This setup reflects a classic falling-wedge / descending-channel structure meeting historical demand. While risk remains elevated, the risk-to-reward profile is asymmetric at this level. Patience, confirmation, and position sizing are essential.
Analysis Type: Technical Analysis
Timeframe: Long-Term / Positional
Bias: Accumulation → Trend Reversal (Conditional)
TA only. Not financial advice. Always manage risk.

$AXS Crashed 98% From Its ATH. Now It Just Pumped 65% In One DayNYSE:AXS Crashed 98% From Its ATH. Now It Just Pumped 65% In One Day. Here’s What Changed:
After A Brutal -99.67% Drop From Its $166 ATH to $0.55, NYSE:AXS Is Finally Showing Strength.
Price Surged 65%+, Reclaiming $2 With $1.18 Billion+ Volume And Is Up Over 190% In The Past Month
Driven By A Major Tokenomics Upgrade:
🔹 Launch Of bAXS (1:1 Backed By AXS)
🔹 Rewards Stay Inside The Ecosystem
Technical View
Strong Bounce From $0.80–$1.00 Accumulation Zone
Now Holding $1.50–$2.00 As Support
New Accumulation Zone: Around $1.50-$1.20
Next Resistance Sits Around $3.80
Key Invalidation Below $0.75
Narrative: Gaming Tokens Are Catching Bids Again:
RON +20% | SAND +30% | MANA +21%
#AXS Was The King Last Cycle: Is NYSE:AXS Setting Up For A Run Back To Its $166 ATH?
NFA | DYOR

ETHUSD SHOWING A GOOD UP MOVE WITH 1:8 RISK REWARD ETHUSD SHOWING A GOOD UP MOVE WITH 1:8 RISK REWARD
DUE TO THESE REASON
A. its following a rectangle pattern that stocked the market
which preventing the market to move any one direction now it trying to break the strong resistant lable
B. after the break of this rectangle it will boost the market potential for break
C. also its resisting from a strong neckline the neckline also got weeker ald the price is ready to break in the outer region
all of these reason are indicating the same thing its ready for breakout BREAKOUT trading are follws good risk reward
please dont use more than one percentage of your capitalfollow risk reward and tradeing rules
that will help you to to become a bettertrader
thank you

$AVAX PRICE FORECAST | IS $200 POSSIBLE? | ANALYSIS BY CPCRYPTOCAP:AVAX PRICE FORECAST | IS $200 POSSIBLE? | ANALYSIS BY CRYPTOPATEL
#AVAX Is Holding A Strong High-Timeframe Accumulation Zone On The Weekly Chart After A Deep Multi-Year Correction From The 2021 ATH. Current Structure Suggests Smart Money Re-Accumulation Near Long-Term Demand.
Weekly Technical Structure:
✅ Strong All-Time Support / Accumulation Zone: $11 – $13.80
✅ Multiple Confirmed Reactions From This Zone Since 2022
✅ Macro Descending Trendline From ATH Still Capping Price
✅ Recent Sell-Side Liquidity Sweep Into Demand
✅ Bullish Confirmation Trigger: Weekly Close Above $15
CryptoPatel Targets (HTF Expansion):
🎯 TP1: $32.7
🎯 TP2: $57.9
🎯 TP3: $114.5
🎯 TP4 (Cycle Extension): $200+
As Long As AVAX/USDT Holds Above $11, The Macro Bullish Bias Remains Valid.
This Is A Patience-Based Weekly Setup With Asymmetric Risk-Reward, Best Suited For Spot & Swing Traders Using HTF Confirmation.
Invalidation:
❌ Weekly Close Below $10
TA Only. Markets Are Probabilistic. Always Manage Risk & DYOR.

$XRP Price Forecast | Is $10 Possible?CRYPTOCAP:XRP Is Currently Retesting A Breakout That Took Nearly 8 Years To Form — A Rare, High-Timeframe, Cycle-Level Structure That Typically Precedes Major Market Expansions.
The Last Time This Exact Structure Appeared (2017), XRP Delivered An Extraordinary 40,000% (400x) Move Following The Breakout.
Current High-Timeframe Technical Structure:
✅ Multi-Year Descending Structure Broken
✅ ~57% Corrective Pullback From Recent ATH
✅ Price Holding Within The $2–$1.50 Demand Zone
✅ Strong Macro Support Identified At $1–$0.80
As Long As Price Respects This Support Region, The Primary Technical Projection Remains $8–$10 XRP Over The Cycle, Based On Measured Move And Historical Structure Behavior.
Why Expect Only 5x–10x From Here?
The Previous Multi-Year XRP Breakout Resulted In A 400x (40,000%) Expansion.
Historically, Large Bases Lead To Large Moves — Not Modest Returns.
From A Purely Structural Perspective, A Move Toward $10–$20 Cannot Be Ruled Out In The Next Market Cycle If The Breakout Holds And Momentum Confirms.
Disclaimer:
This Analysis Is For Educational Purposes Only And Does Not Constitute Financial Advice. Technical Analysis Is Probabilistic, Not Predictive. Always Apply Proper Risk Management And Conduct Your Own Research.

BNB Price Forecast 2026 | Is $10K/BNB Possible? | Analysis By CPBNB has shown strong price action recently. After bouncing from the $500 support zone, price moved higher, broke the previous all-time high, and successfully cleared the $700 resistance, which is now acting as a strong support area.
Currently, BNB is consolidating around the $800 level, suggesting the market is digesting the recent move.
Technical Overview
Multi-year ascending trendline: Still intact, indicating long-term bullish structure.
Major support zone: $500–$800
This range has acted as an accumulation area during previous pullbacks.
Current structure: Sideways consolidation near $800 after a strong breakout.
Possible Scenarios
Bullish continuation:
If BNB holds above $800 and breaks higher with volume, continuation toward higher levels is possible.
Pullback scenario:
If price drops below $800, a retest of $700–$500 could occur. Historically, this zone has provided strong demand and may attract long-term buyers.
Long-Term Perspective (Cycle-Based)
Bull market target (speculative): Around $3,000
Macro cycle projections (high risk & speculative): $10,000–$20,000
These levels are not predictions, but potential zones based on historical cycles, trend strength, and broader market conditions.
Key Takeaway
The overall structure remains bullish as long as price stays above major support levels. Consolidations and pullbacks within an uptrend are normal and often help reset the market before the next move.
This is an educational analysis only. Not financial advice.
Always manage risk and do your own research (DYOR).

ETHEREUM 2026 ATH Price Forecast | Bitcoin Halving Cycle AnalysiThis study observes Ethereum’s historical behavior relative to Bitcoin halving events. The purpose is to highlight recurring market structure patterns, not to provide financial or investment advice.
Observed Historical Cycles
2016 Bitcoin Halving
~70% drawdown in ETH
~546 days of sideways accumulation
Followed by a multi-year expansion phase (~22,800% peak move)
2020 Bitcoin Halving
~75% drawdown in ETH
~546 days of consolidation
Subsequent expansion to ~$4,693 (+2,600% approx.)
2024 Bitcoin Halving (Current Cycle)
~66% drawdown observed
~609 days of consolidation (ongoing)
Market structure remains comparable to prior accumulation phases
Key Observation
ETH trading within the $2,600–$3,000 range aligns with previous long-term accumulation zones seen before historical expansion phases.
Forward-Looking Scenario (Cycle-Based Projection)
If historical rhythm continues, the next expansion window may extend into 2026, with hypothetical price zones often discussed by market participants between:
$10,000
$15,000
$18,500+
These levels represent cycle-based projections, not price guarantees.
Conclusion
Ethereum has historically followed a pattern of deep drawdowns, prolonged consolidation, and later expansion after Bitcoin halving events. Whether this cycle continues to rhyme remains to be confirmed by future market behavior.
This analysis is for educational and informational purposes only. Always conduct independent research and risk assessment.

$BNB Technical Analysis: Why $10,000 Is On The RadarBNB Technical Analysis: Why $10,000 Is On The Radar
1️⃣ Historical Precedent
2021 Bull Run: +1,950%
2027 Projection: +1,900% (based on same chart pattern & price structure)
Repeating patterns suggest massive green candles could follow.
2️⃣ Key Support Zones
Strong long-term support: $500 & $200 ( Accumulation zone )
Support is holding, signaling a high-probability base for a breakout.
3️⃣ Price Targets
Short-term: $2,000 → $5,000
Long-term: $10,000 🎯
This aligns with historical price mechanics and measured growth potential.
4️⃣ Risk Management
Accumulate gradually; avoid FOMO buys
Always DYOR & understand support/resistance levels before entering
TA Insight:
BNB shows a pattern identical to previous bull cycles. Breaking current resistance levels could trigger an explosive upward trajectory.
CRYPTOCAP:BNB is technically primed. If you’re strategic now, you’re positioning for multi-year gains.
NFA & DYOR

BITCOIN at a MAKE-OR-BREAK zoneBITCOIN at a MAKE-OR-BREAK zone
CRYPTOCAP:BTC must break $90,000 to unlock the $107,000 upside.
❌ If $90K fails → Downside Opens to $70K–$65K
Technicals Show a Bearish Pennant And Pattern Target: ~$70,000
These levels are CRITICAL. Watch closely.
NFa & DYOR

$ETH at a Critical HTF Support Inflection.CRYPTOCAP:ETH at a Critical HTF Support Inflection.
$2,890 is the Structural Demand level.
Acceptance above this level Preserves Bullish Market Structure.
If Support Holds → Upside Continuation Toward $3,650 and $4,250.
Failure to Hold → Bullish Thesis Invalidated.
Binary Zone. Directional Expansion Pending.
NFA & DYOR

$FLOW CRASH ALERT – WHAT JUST HAPPENED?AMEX:FLOW just got destroyed, dropping over 52% in 24 hours.
Price action
High: $0.174
Low: $0.079
Current: ~$0.10
Major Red Flags Today:
🔹 Upbit & Bithumb Suspended Deposits and Withdrawals
🔹 South Korea’s DAXA Issued a Trading Risk Warning
🔹 Flow Foundation confirmed they are investigating a potential security incident on the Flow network
What On-Chain Data Shows:
🔹 Top 100 holders Reduced Holdings by ~2.79M FLOW
🔹 No Smart Money Accumulation signal
🔹 Heavy Selling by Public Wallets During Peak Hours
🔹 ~1.69M FLOW moved to Exchanges (Selling Pressure)
🔹 Late buyers Jumped in During the Crash, Not Before
Market Behavior:
🔹 Panic selling dominated
🔹 Whales appear to have distributed near highs
🔹 Some wallets aggressively bought the dip amid fear
🔹 Reports of a large whale dumping on DEXs
Uncertainty Remains:
🔹 Cause of the “security incident” is still unclear
🔹 CEX suspensions increase fear and volatility
🔹 Short-term sentiment remains extremely bearish
This Move Was Driven by Fear, Uncertainty, and Heavy Selling Pressure. Until Clarity Comes from the Flow Foundation, Risk Remains Very high.
Investors are Waiting for clear Answers from Flow Blockchain
Trade Carefully. Volatility is Brutal Right Now.
NFA & DYOR

ETHUSD - Are Bears Ready for the Fall?ETHUSD on the 4H timeframe is clearly in a corrective downtrend, not a healthy bullish structure. The price action fits an Elliott Wave decline where wave 3 already completed near 2620 , followed by a weak and overlapping recovery that looks like wave 4. That recovery stayed inside a falling channel and never showed impulsive strength, which already tells you buyers are weak. More importantly, wave 4 is flirting with wave 1 territory, which puts the entire bullish hope on thin ice.
Right now, ETH is at a make or break zone. If this move is just a fake breakdown, price must quickly reclaim the channel and hold above recent highs. If not, then this is likely wave 5 of C, and downside continuation becomes the dominant scenario. The structure favors a final flush toward the 2380 to 2350 area, where wave 5 projection and channel support align. Anyone blindly bullish here is ignoring structure. This is not a buy the dip market, it is a wait for confirmation or respect the downtrend market.

"ETH/USDT Forecast""ETH/USDT Forecast"
The market shows evidence of strong participation earlier, where price moved with speed and consistency, reflecting clear intent. That phase established direction and control without prolonged hesitation.
As price progressed, momentum began to ease. Movement slowed, reactions became more frequent, and volatility compressed. This change indicates a shift from active pressure to evaluation, where participants reduced aggression and allowed price to stabilize.
The subsequent recovery unfolded in a measured and uneven manner. Advances were short, overlapping, and lacked continuation, suggesting limited commitment behind higher prices. Opposing flow remained active, preventing expansion.
Currently, price behavior is defined by balance and compression. Activity reflects positioning rather than resolution. Until behavior shifts from overlap to decisive movement, the market remains in a waiting state, with continuation favored once imbalance returns.

ETH UNDER PRESSURE - BREAKDOWN Ethereum slipped below the $3,000 support, following heavy selling in spot ETH ETFs. Net outflows hit $224.7M in a single day, the largest exit in weeks, extending total ETF selling to $286.5M over the past three days. Notably, BlackRock and Grayscale led the withdrawals, with zero inflows recorded across funds.
This breakdown triggered a liquidation cascade, wiping out nearly $168M in ETH long positions and driving price down toward the $2,895 zone.
📉 Technical View:
ETH remains under bearish pressure, forming a bearish flag while a confirmed death cross keeps downside risk elevated. Unless price reclaims resistance near $3,170, the structure points toward a potential move to the $2,620 support zone.
⚠️ Market Takeaway:
Momentum favors the downside for now. Bulls need a strong reclaim of key resistance to shift sentiment — otherwise, volatility remains skewed against longs.

ETHUSD Bull Trap? - Final Breakdown Setup Is Almost Locked InETH is still stuck inside a clear falling channel, and the entire pattern is behaving like a corrective downtrend. The recent bounce from 2620 looks sharp, but it’s still just a counter-trend move. Nothing here screams trend reversal yet.
Wave 3 ending at 2620 , and now the price is rising for a Wave 4 retracement. Wave 4 usually moves back toward the mid-channel and tests previous breakdown zones.
The red box around 3200–3300 is the key trap zone. This is where sellers can return because Wave 4 must not enter Wave 1 territory, which sits higher. As long as ETH stays under that invalidation level, the bearish structure remains fully intact.
The move looks like a classic (a)-(b)-(c) correction inside Wave 4. Once this corrective bounce completes, the chart suggests ETH will resume the downward path. The channel alignment and wave symmetry both support a final Wave 5 drop.
If the bearish count plays out, ETH could slide toward 2400 – 2300 in Wave 5 before a major bottom forms. That’s the zone where sellers exhaust and buyers take control again. Until ETH breaks the invalidation level with strength, downside remains the more probable outcome.
Stay Tuned!
@Money_Dictators

ETHUSD: Reversal or Another Bull Trap?Look at this:
ETH played the trap perfectly. After pushing into the 3200–3400 resistance zone, price failed to sustain above it and rolled over, confirming that the move was distribution, not strength. Sellers stepped in exactly where a Wave 4 rally should fail.
The rejection was followed by a clean breakdown of the parallel rising channel, which shifts the short-term bias back in favor of the bears. That channel was the last structure holding the corrective bounce together. Once it broke, the bullish case weakened sharply.
This drop reinforces the view that the move up from 2620 was only a Wave 4 correction, not the start of a new trend. With Wave 4 likely complete, ETH appears to be transitioning into Wave 5 of the broader corrective decline.
As long as price remains below the broken channel and prior resistance, downside continuation remains the dominant scenario. The structure opens the door for a retest of 2620 , with a deeper extension toward 2465 if selling pressure accelerates.
Until ETH reclaims the channel with strength and acceptance, this remains a sell-the-bounce environment. The warning came at the trap zone, and the market is now following through.
Stay Tuned!
Money Dictators,
R.D :)

Ethereum longs activated into targets buying position Ethereum buying becuase of mid week support to the new high of eth so stay tunes and risk little portion on this trade only 1-2% risk of capital okay done

ETH/USDT Bullish Reversal SetupETH/USDT Bullish Reversal Setup
The chart shows a clear transition in ETH as price moves from a prolonged distribution-driven decline into a developing accumulation range. After weeks of consistent bearish structure, the market finally printed multiple upside shifts, signaling that sell-side pressure is weakening and liquidity behavior is changing.
The recent impulsive rally out of the discounted range confirms that buyers are actively defending lower levels. Price is now pulling back toward a short-term demand pocket formed during the breakout. This area represents the first meaningful accumulation zone after the market broke a series of internal swing points.
As long as price maintains stability within this demand block, the structure favors continuation toward the next major liquidity cluster above. The next upside draw is positioned around the 3,440–3,500 region, where previous inefficiencies and unmitigated zones converge. That region also holds resting buy-side liquidity, making it the logical target for a future expansion move.
The current market behavior suggests that ETH is in the early phase of a bullish repricing cycle. A controlled pullback into the highlighted zone—followed by a reaction—would confirm continuation and attract momentum buyers aiming for the higher liquidity magnet.
Overall, this chart reflects a shift in narrative: sellers are losing dominance, the market is building a fresh bullish structure, and the path of least resistance is gradually tilting upward as long as the demand zone remains protected.

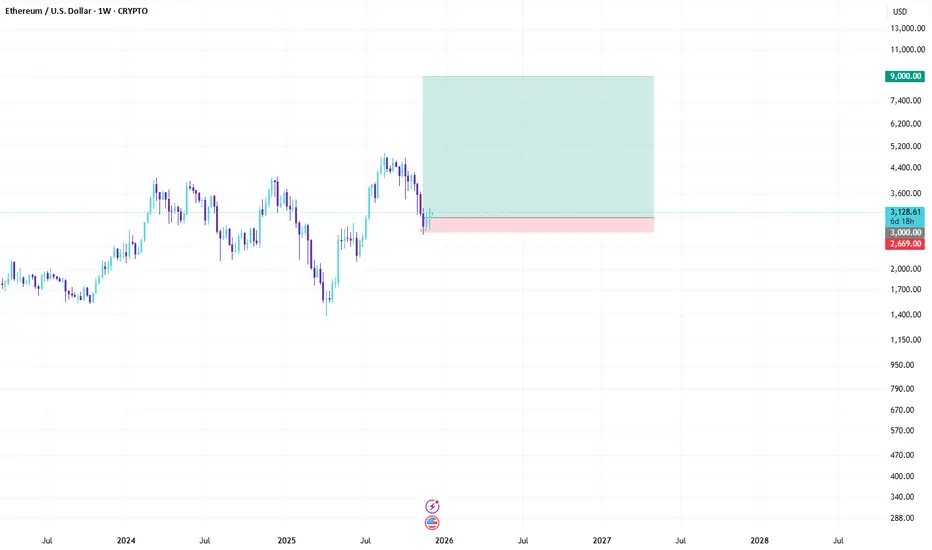
ETH Bullish Outlook: Tokenization Boom to $9K in 2026CRYPTO:ETHUSD
Asset: ETH/USD
Timeframe: Weekly
Hey traders! 🚀 Ethereum's dipping into December around $3,100 after some post-ATH consolidation, but the setup screams reversal. Fundstrat's Tom Lee is calling for a monster rally to $9,000 by 2026, fueled by tokenization exploding across finance. That's nearly 190% upside—ETH's about to steal the spotlight from BTC!
Key Analysis:
Macro Tailwinds: ETH's riding BTC's coattails but with extra juice from spot ETF inflows and real-world asset tokenization. As Wall Street piles in, expect ETH to decouple upward—watch for Nasdaq sync and weakening USD to amplify the move.
Technical Setup: Rock-solid support at $2,800, the recent higher low that's holding like a champ. Daily RSI oversold, bullish MACD crossover brewing, and on-chain metrics show whales accumulating. Smash $3,500 resistance, and we're blasting toward $4,500 next.
Risks: Near-term volatility if broader risk assets falter, but ETF demand and layer-2 scaling keep the floor intact for the long haul.
Trade Signal:
Entry: Long ETH/USD at $3,000 (confirmation above $2,800 support).
Target 1: $4,000 (short-term, ~30% gain).
Target 2: $9,000 (Tom Lee tokenization target by mid-2026).
Stop Loss: $2,700 (below key support to guard the downside).
Risk/Reward: 1:4+ on the primary target. Position size: 1-2% of portfolio.
Chart snapshot: Weekly candles forming a bullish pennant at $2,800, with Fibonacci retracement eyeing $9K extension. Overlay ETH ETF flows for that institutional vibe! (Pro tip: Compare with BTC dominance to spot ETH's breakout edge.)
Idea by Signal Squad
Published: December 8, 2025
What do you think, squad? ETH outpacing BTC in 2026, or more sideways grind? Drop your takes below—let's squad up! #ETH #CryptoSignals #SignalSquad
BTC Breakdown Confirmed – Here’s Where BTC Could Surge NextBTC Breakdown Confirmed – Here’s Where BTC Could Surge Next
1️⃣ Long-Term Trendline Breakdown Confirmed
🔹 BTC has decisively broken the multi-year ascending trendline supporting price since Nov 2022.
🔹 The Breakdown + Retest at ~$104k-$108k confirms bearish structure ✅.
🔹 Retest failed in Oct 2025, confirming sellers are in control.
2️⃣ Fibonacci Levels Highlight Strong Demand
🔹 Price is now hovering between 0 Fib ($125,647) and 0.382 Fib ($56,494).
🔹 Measured move Targets: Strong Demand Zone $34,477 - $56,494 (0.618 - 0.382 Fib)
🔹 This is the accumulation zone for long-term positions, historically providing strong bounce potential.
3️⃣ Critical Support / Resistance Zones
🔹 Immediate Support: $85k-$87k (psychological)
Major Support:
🔹 $56,494 (0.382 Fib, upper demand)
🔹 $44,133 (0.5 Fib, middle demand)
🔹 $34,477 (0.618 Fib, “Golden Pocket”, lower demand)
Resistance: Broken trendline now acting as key supply
4️⃣ Potential Scenarios
Bearish (High Probability)
🔹 Continuation down to Strong Demand Zone ($34k-$56k)
🔹 Represents 38-61% retracement from ATH, typical after trendline breakdown + retest
Bullish (Needs Reclaim)
🔹 Reclaim broken trendline (~$95k-$100k)
🔹 Close above $104k = false breakdown, continuation to new highs
Why I’m Watching $56,500 - $34,500 for Longs
🔹 Historical accumulation zone with high probability of a strong bounce
🔹 After breakdown + retest, price often retraces to 0.5 or 0.618 Fib before resuming bull trend
🔹 Perfect long-term entry for those aiming for multi-year BTC upside
BTC may test the $56k-$34k demand zone soon. For long-term holders, this is a prime accumulation area before the next bull cycle. Stay patient and strategic – $1M BTC dreams require discipline, not FOMO.
Guys, don’t judge me: I’m a Bitcoin lover too. I’m just reading what the chart is showing. Even if the short-term looks bearish, I see the setup for a massive long-term move toward $1M 🚀
NFA & DYOR

ETH Premium OB & FVG Zones – ChoCh Could Hit at $3,660ETH Premium OB & FVG Zones – ChoCh Could Hit at $3,660
Market remains in a Bearish Structure with steady LH → LL and clean BOS down. The current upward move is just a retracement into premium.
Key Zones:
FVG: $3,250–3,350 – First Reaction Zone for Short Entries
Bearish OB: $3,600–3,660 – Prime Supply Zone for Shorts
Shorting Strategy:
If you are Shorting ETH, these are the best levels to scale in.
Caution:
Any HTF candle closing above $3,660 Bearish OB signals a ChoCh. Exit shorts immediately, Trend flips bullish, opening the path toward new ATH.
Below $3,660 → bearish continuation likely
Above $3,660 → trend flip, bullish momentum expected
Until the OB break happens, bias stays bearish.
NFA & DYOR
