bearish retest I warned on Oct31 played out EXACTLY as projectedThe bearish retest I warned about on Oct 31 played out EXACTLY as projected
I clearly said CRYPTOCAP:BTC would dump again after filling the FVG at $106K–$107K and that’s exactly what happened.
BTC dropped from $107K → $98K (-9%) and from our retest entry, we’re now 15% in profit.
Hope you enjoyed the analysis and booked gains.
Now watch the 0.5–0.618 FIB zone closely.
✔️ If it holds → strong bounce possible
❌ If it fails → BTC could slide below $80K
I’ve been warning about this dump since BTC was above $120K+.
Structure always wins.
NFA & DYOR
Ethereum (Cryptocurrency)
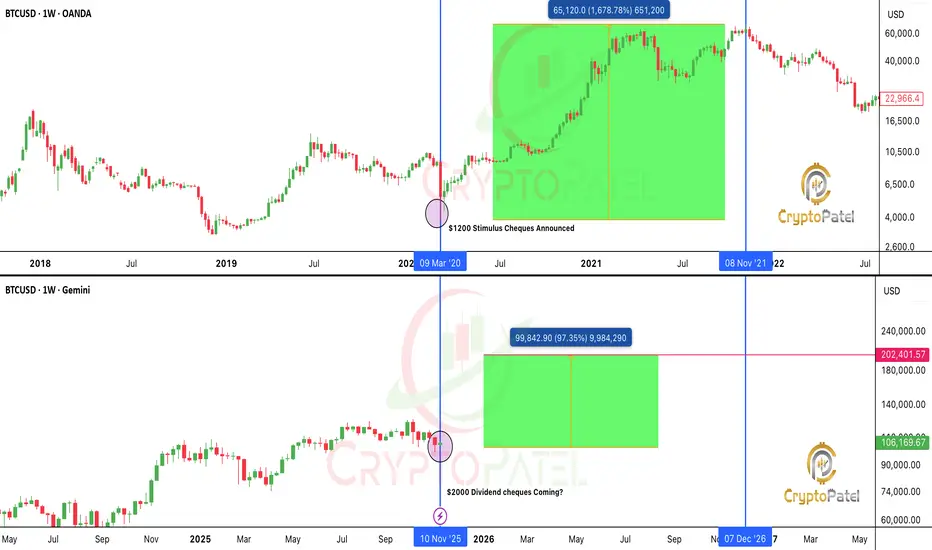
Trump’s $2,000 stimulus = $600B Liquidity: Bitcoin To the Moon?Trump’s $2,000 Stimulus Could Light the Fuse for the Biggest Crypto Rally Ever
This isn’t just another political headline.
If Trump’s plan to send $2,000 stimulus checks funded by tariff dividends actually happens, it could unleash a $600 billion liquidity wave into the economy.
That’s nearly the same scale as the 2020 stimulus, which kicked off one of the most legendary bull runs in history.
🔹 Bitcoin skyrocketed from $3,800 to $69,000
🔹 Ethereum exploded from $90 to $4,800
🔹 Altcoins went absolutely wild, 50x, 100x, even more
But here’s the twist...
This time, the setup is 10x stronger.
In 2020, those checks were about survival, paying rent, buying food, covering bills.
Crypto was new. ETFs didn’t exist. Institutions were on the sidelines.
Now? The game has completely changed.
✅ Crypto is mainstream
✅ Bitcoin ETFs are live
✅ Institutions are ready to buy
✅ Retail access is everywhere
✅ The U.S. economy is growing, not crashing
In 2020, people used stimulus to survive.
In 2025, they’ll use it to invest.
When money flows into a market that’s already primed for risk...
That’s not just bullish, that’s explosive.
The 2020 checks fueled a survival rally.
The 2025 checks could ignite a speculation supercycle.
Imagine $600 billion pouring into a global asset class that’s waiting for liquidity.
Bitcoin. Ethereum. Solana. AI coins. RWA tokens. Meme coins.
History doesn’t repeat but it sure does rhyme.
And this rhyme could make millionaires all over again.
NFA & DYOR
#BITCOIN TECH UPDATE: BEARISH IN CONTROL#BITCOIN TECH UPDATE: BEARISH IN CONTROL
CRYPTOCAP:BTC is down 14% from $115K retest, clean rejection.
Trend remains bearish, structure forming lower highs & lower lows.
Key Zones:
Relief zone: $105K–$108K (short setup area).
Major support: $94K → break below = $76K next.
Momentum:
Selling pressure dominates; no bullish divergence yet.
Invalidation:
Only a close above $111.5K flips bias bullish toward $150K. ( Super Bullish Above $116.5K)
Plan:
Sell rallies. Manage risk. Avoid FOMO longs.
NFA & DYOR

ETH/USDT (4H) chartETH/USDT (4H) chart:
The price is currently trading near a support zone (around $3,250–3,300).
The chart shows a potential bullish setup with two marked target points above.
The Ichimoku Cloud suggests resistance around mid-levels before a full reversal.
Here’s the breakdown 👇
🔹 Key Levels:
Support zone: $3,250 – $3,300
First target (inside the cloud): around $3,700 – $3,750
Second target (top / resistance zone): around $4,150 – $4,200
🔹 Summary:
If ETH holds the current support and breaks above the cloud:
Target 1: ≈ $3,700
Target 2: ≈ $4,200
Invalidation: below $3,200 (support breakdown)

(ETH/USD, 3-hour imeframe...(ETH/USD, 3-hour timeframe, Bitstamp):
The chart clearly shows a descending channel with price breaking below the lower boundary, confirming strong bearish momentum.
The Ichimoku Cloud is fully bearish, and price action is below all major cloud levels — confirming continuation to the downside.
My chart already shows a target point marker at the lower projection level.
📉 Target analysis (based on my chart + structure):
Current Price: ≈ $3,511
Immediate Target (TP1): Around $3,400 (shown near the “target point” on my chart)
Next Target (TP2): Around $3,300 — previous horizontal support & channel extension
Extended Target (TP3): Around $3,180 – $3,200, if bearish momentum accelerates
🔒 Stop-loss (for short trades):
Above $3,650 – $3,700 (upper boundary of current consolidation zone / channel midline)
📈 Summary:
Trend: Bearish continuation
TP1: $3,400
TP2: $3,300
TP3: $3,180
SL: $3,650 – $3,700

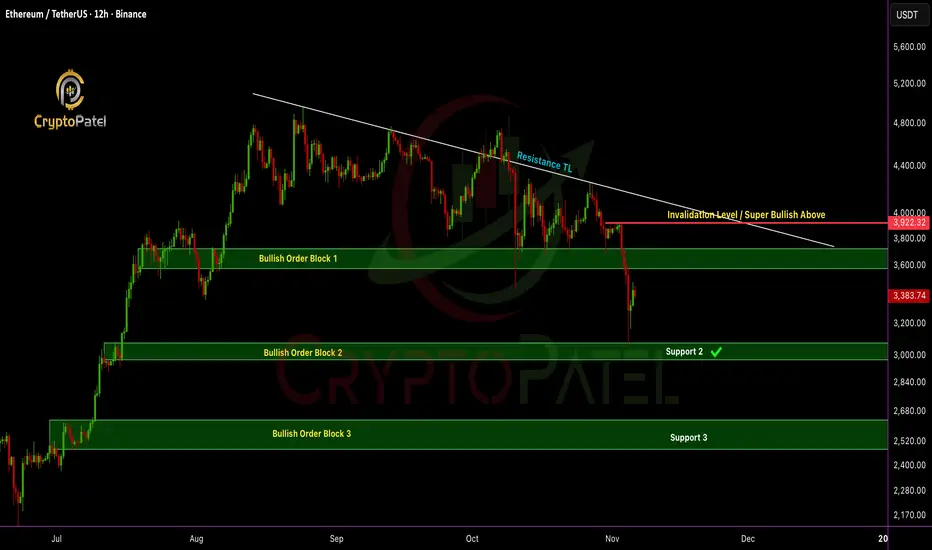
ETH/USDT dumped 20% after my analysisETHEREUM Update: Price just hit the bullish order block at $3,057 and bounced exactly as predicted ✅
Quick recap:
✅ Short-term: I’m bearish below $3,920, next potential leg down $2,500–$2,200 if $3,000 support breaks.
✅ Medium-term: Holding $3,000 support is key, could spark the next bullish wave.
✅ Long-term: Still super bullish & Target remains $10K–$15K ETH
Paper hands panic. Legends load the blood & hold.
Which one are you? 👇
NFA & DYOR
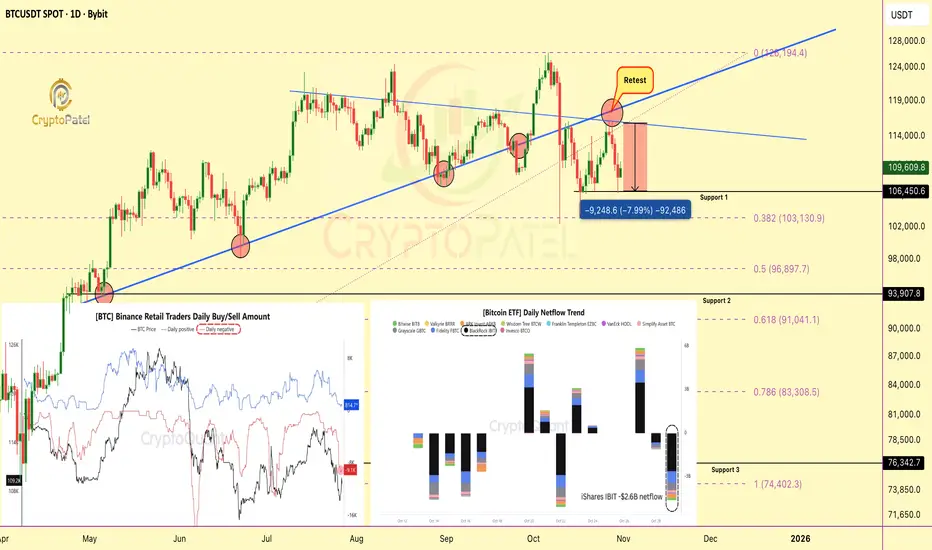
Retail Panic Meets ETF Outflows: $1B Bitcoin Sell-Off Hits MarkeRetail Panic Meets ETF Outflows: $1B Bitcoin Sell-Off Hits Markets
Bitcoin saw renewed selling pressure on Oct 30, as Binance retail traders dumped over 9,200 BTC (~$1B) around $107.7K, just days after another 12,000 BTC sell wave near $108.3K.
Technical View:
Retail traders are aggressively selling into weakness, while long-term holders remain largely inactive.
Historically, these sharp sell-offs from short-term players often form local bottoms, liquidity events where smart money quietly accumulates.
Fundamental Side:
Spot Bitcoin ETFs added more weight to the downside:
🔹 BlackRock: -$2.6B
🔹 Fidelity: -$790M
🔹 Grayscale: -$500M
These ETF outflows likely shifted capital to spot exchanges, amplifying short-term selling pressure.
Key Insight:
▶️ Retail capitulation + ETF outflows = short-term volatility
▶️ But remember, markets often bottom when retail panic peaks.
Note: NFA & DYOR
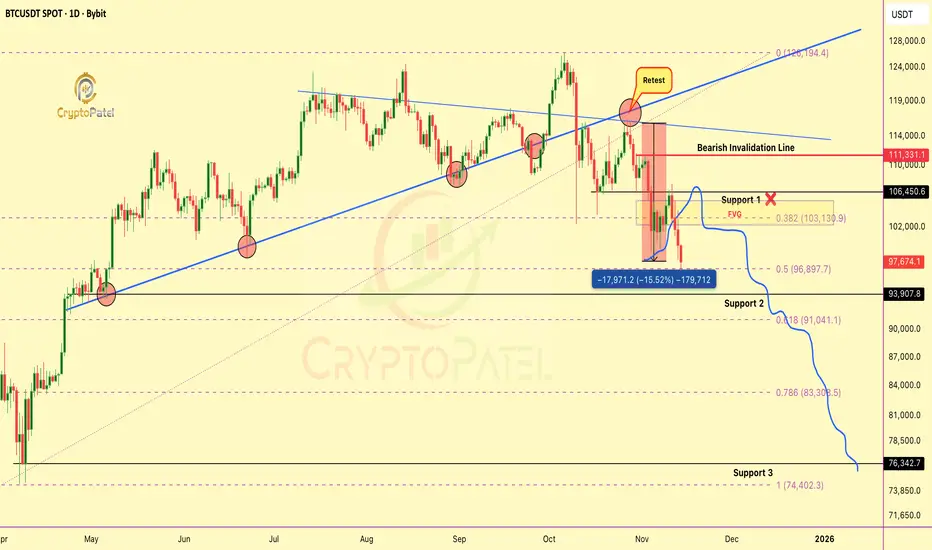
Will Bitcoin Ready to Next leg down toward $76000?CRYPTOCAP:BTC has completed a bearish retest at the $116K resistance zone, maintaining a bearish bias below $116K–$117K
If price continues to reject this level, I’m anticipating a corrective move toward: $105K → $93K → $76K
However, a confirmed breakout above $117K would invalidate the bearish structure and could trigger an extended rally toward $150K+.
Resistance: $116K–$117K
Support: $105K / $93K / $76K
Bias: Bearish below $116K | Bullish above $117K
Stay disciplined — structure > sentiment.
NFA & DYOR

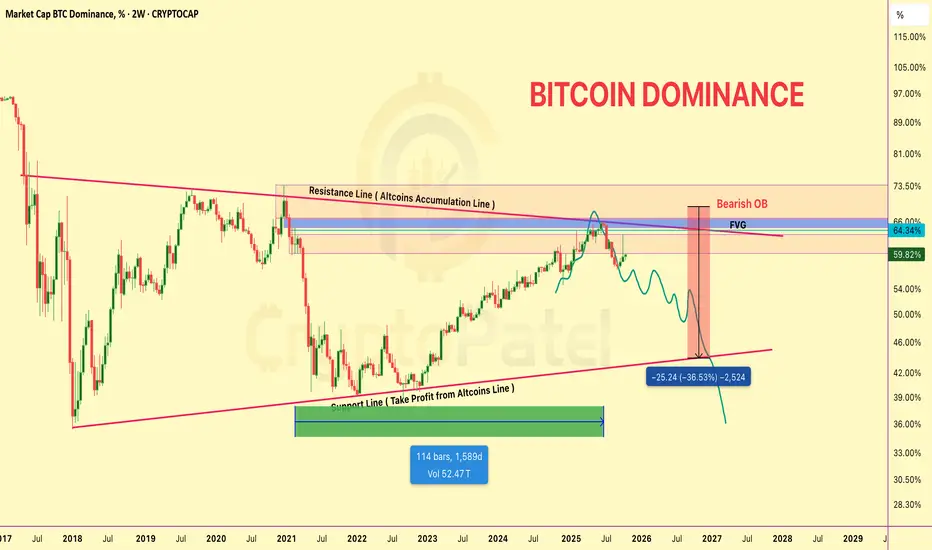
Why Altcoin Holders Need to See This BTC Dominance Chart RIGHT NWhy Altcoin Holders Need to See This BTC Dominance Chart RIGHT NOW
BTC.D still trending UP → targeting 63% before the reversal
Yes, it hurts altcoin bags right now 😤
63% → flip to 40-45% → ALTSEASON 🚀
Let BTC run. Your bags will pump after.
Patience wins.
NFa & DYOR
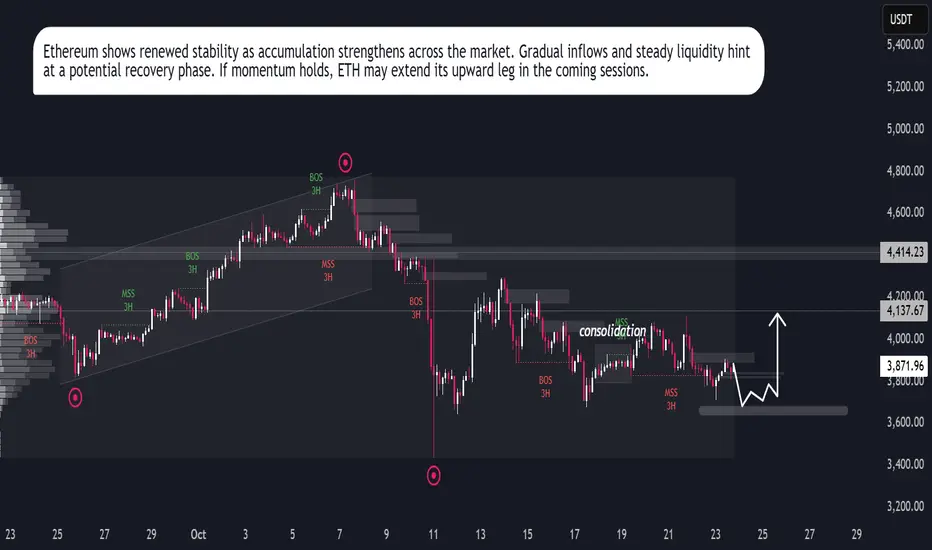
ETH Eyes Upside RunEthereum shows signs of regaining strength after a prolonged corrective phase. The asset is currently stabilizing, supported by gradual inflows from institutional participants and renewed investor accumulation. Market behavior indicates controlled volatility, suggesting a preparation phase before a potential expansion.
Network data reflects consistent transaction activity, while liquidity concentration hints at sustained participation from long-term holders. The recent stabilization in funding rates and improved open interest add weight to the recovery outlook.
If momentum continues to build under these conditions, Ethereum could enter a structured growth cycle in the coming sessions.
$LTC ACCUMULATION PHASE IS OVER: Ready to $500?🚨 CRYPTOCAP:LTC ACCUMULATION PHASE IS OVER 🚨
✅ Strong bounce from 7-YEAR trend line support
✅ Soon Break out 4-YEAR descending wedge
✅ Re-accumulation zone: COMPLETE
1️⃣ Target 1: $216 (+129%)
2️⃣ Target 2: $388 (+311%)
3️⃣ Target 3: $532 ALL-TIME HIGH (+464%)
👉 Last time this pattern played out = 1,596% PUMP
But yeah, keep buying at ATH 🤡
NFA & DYOR

ETHUSD (Ethereum / U.S. Dollar) on the 1-hour timeframe...ETHUSD (Ethereum / U.S. Dollar) on the 1-hour timeframe, here’s what stands out technically:
---
🧭 Chart Overview
The price has broken above a descending trendline, which is a bullish breakout signal.
The breakout is supported by Ichimoku confirmation — price is trading above the cloud, and the cloud ahead is turning bullish.
There’s a clear retest of the breakout zone (around $3,950–$3,970), where buyers stepped in again.
My marked a target point on the chart near the $4,225–$4,250 region.
---
🔍 Technical Breakdown
Current price: ~$4,040
Support zone: $3,950–$3,970 (retest area / Kijun + trendline retest)
Immediate resistance: $4,100–$4,150
Target zone (as shown): $4,220–$4,250
That corresponds closely to the measured move from the prior consolidation or inverse head-and-shoulders structure on the left side.
---
🎯 Expected Target
✅ Primary target: $4,225–$4,250
(aligns with your marked “target point” and measured breakout projection)
⚠ Stop-loss suggestion (for risk control): Below $3,930
(to stay safe if it dips back into the cloud)
---

This $4 Token Could Hit $20 And Nobody's Talking About ItThis $4 Token Could Hit $20 And Nobody's Talking About It
Support: $3.70-$4.00 (holding)
HTF Target: $20 (5x potential)
Why it matters:
✅ Exchange tokens outperform in bull cycles
✅ Clear support zone + bullish structure
✅ 500% upside if base holds
While everyone chases pumps, smart money accumulates at support with 5:1 risk-reward.
IF this holds $4 Support, NYSE:BGB could be the millionaire-maker nobody saw coming.
DYOR. Not financial advice.

Ethereum Accumulation Before BreakoutEthereum has regained bullish momentum after a recent correction phase, supported by improving sentiment in the broader crypto market. The asset is displaying early signs of stabilization as traders begin accumulating around value zones, indicating renewed confidence among market participants.
From a macro perspective, Ethereum continues to benefit from increasing network activity, particularly within the DeFi and Layer-2 ecosystems. The sustained growth in on-chain transactions and staking participation reflects long-term investor interest, adding strength to the current recovery phase.
Market data also shows that institutional inflows into major crypto assets are on the rise, with Ethereum standing out due to its strong fundamentals and ecosystem resilience. This inflow supports the likelihood of a continued price rebound, as liquidity and trading volume remain consistent.
Overall, ETHUSDT is showing a constructive recovery setup. The combination of improving sentiment, strong fundamentals, and gradual accumulation suggests a potential medium-term bullish continuation, provided global market conditions remain favorable.

Ethereum’s Next Move: $3,000 Buy Zone or $10,000 Breakout?Ethereum’s Next Move: $3,000 Buy Zone or $10,000 Breakout?
Current Market Overview:
Ethereum is currently trading below $4,000, indicating short-term weakness as bulls struggle to regain control. The $4,000 level remains a key pivot point, holding above it is essential for any sustained move toward higher targets.
Key Levels to Watch:
🔹 Immediate Resistance: $4,000
🔹 Major Support Zone: $3,000 – $2,600 (ideal accumulation area)
🔹 Upside Targets: $8,000 – $10,000 (if $4,000 is reclaimed)
Bullish Scenario:
If Ethereum breaks and holds above $4,000, it confirms bullish momentum and opens the path toward $8,000–$10,000 in the mid to long term.
Bearish / Accumulation Scenario:
If ETH remains below $4,000, expect a possible retracement toward $3,000 – $2,600. This zone could act as a strong accumulation area for long-term investors.
Outlook:
The broader structure remains long-term bullish despite short-term pullbacks. Dips into major support zones should be viewed as opportunities for strategic accumulation.
⚠️ Note: Always DYOR (Do Your Own Research) before making any investment decisions. This analysis is for educational purposes only.

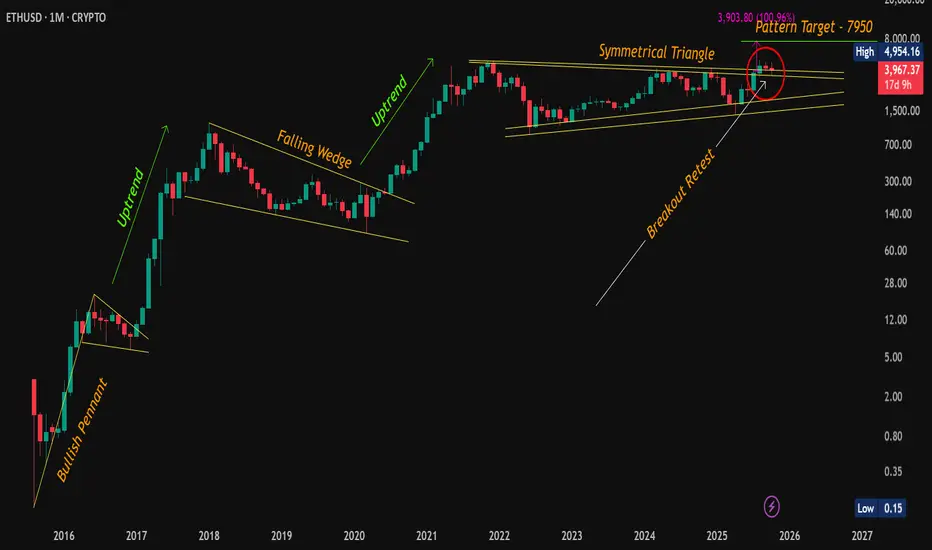
ETH Retest Confirmed – Bullish Momentum Intact!CMP: $3,968
Ethereum is holding strong above the symmetrical triangle breakout zone after a textbook breakout + retest . Despite the recent consolidation, the structure remains bullish , and the bigger pattern is still in play.
🔶 Technical Highlights:
✅ Symmetrical Triangle Breakout: ETH successfully broke out and retested the upper trendline (see red circle). This retest confirms the breakout validity.
✅ Consolidation Above Resistance: ETH is consolidating in a tight range above previous resistance , forming a potential bull flag .
✅ Pattern Targets Remain Active:
📍 Symmetrical Triangle Target: ~$7,950
📍 Bull Flag Target (if breakout confirms): ~$7,365+
📈 Market Structure:
📍 Previous breakouts (Bullish Pennant in 2016, Falling Wedge in 2019) led to strong uptrends .
📍 Current consolidation mirrors historical patterns that preceded major rallies.
🟢 Key Level to Watch:
📍 A monthly close above $4,954.16 (previous ATH) would mark the next major confirmation, likely attracting breakout traders and institutions.
💡 ETH is showing maturity in structure – breakouts, retests, and consolidations are happening on higher timeframes with clear technical precision. The longer this base holds, the stronger the eventual move could be.
📌 Disclaimer: This analysis is shared for educational purposes only. It is not a buy/sell recommendation. Please do your own research before making any trading decisions.
#ETH | #Ethereum | #Crypto | #Breakout | #ChartPatterns | #SymmetricalTriangle | #BullFlag | #PriceAction
How to Build a Crypto Portfolio for Long-Term Wealth?Hello Traders!
The crypto market can look exciting, fast profits, new coins every week, and hype everywhere.
But those who build long-term wealth in crypto don’t chase trends; they build structured portfolios with strategy.
Let’s understand how to create a crypto portfolio that can grow steadily over time, not just in bull runs.
1. Decide Your Investment Horizon
Before buying anything, decide your goal, 3 years, 5 years, or 10 years.
Longer horizons allow you to ride out volatility and benefit from compounding.
If you’re thinking short term, you’re speculating, not investing.
2. Allocate Wisely – The 60/30/10 Rule
60%: Blue-chip cryptos like Bitcoin (BTC) and Ethereum (ETH) , the foundation of your portfolio.
30%: Promising large/mid-cap projects (Layer-1s, AI, DeFi leaders).
10%: High-risk, high-reward small-cap or emerging tokens.
This keeps your portfolio stable while still giving growth exposure.
3. Diversify Across Categories
Don’t just hold coins, diversify across crypto sectors:
~Layer-1 platforms (ETH, SOL, AVAX)
~DeFi (AAVE, UNI)
~Infrastructure (LINK, ARB)
~AI/Metaverse (INJ, RNDR, MATIC)
This ensures that if one sector underperforms, others balance your returns.
4. Use SIP or DCA Method
Instead of buying everything at once, invest gradually through Systematic Investment Plans (SIP) or Dollar Cost Averaging (DCA) .
This helps you accumulate more during dips and reduces emotional stress during corrections.
5. Secure and Rebalance Regularly
Use hardware wallets for long-term storage. Don’t keep large amounts on exchanges.
Review your portfolio every 3–6 months and rebalance to maintain original allocation.
Trim profits from overperforming assets and add to undervalued ones.
Rahul’s Tip:
Crypto investing is not about catching every rally, it’s about staying long enough to see technology grow and adoption rise. Patience is your biggest alpha.
Conclusion:
A strong crypto portfolio is like a business, diversified, secure, and managed with discipline.
If you build it smartly, it can become a powerful wealth creator over time.
If this post helped you plan your crypto journey, like it, drop your thoughts in comments, and follow for more practical investment insights!

BTCUSD and ETHUSD BTCUSD and ETHUSD could not break the hurdle and formed nearly a triple top pattern. Some reversal has been seen. Maybe could fall some more. One should consider co-relating it with the trend of Gold and find entry opportunities in Crypto (just as a hedge in my view).

ETHUSD: Reversal Expected Near 4100The bullish outlook remains unchanged. We are expecting the price to reverse near 4100 . The sharp move on wave a, a small correction for wave b, indicates a sharp decline and rapid rise in the upcoming days.
Previous research:
Stay Tuned!
@money_dictators
Thanks :)

ETHUSD: Where Price Could Go?4h tf
ETHUSD has bounced back strongly from around $3,826 after completing an A-B-C wave pattern. Right now, the price is testing resistance near $4,756. It could drop a little to around $4,440 before moving higher again. If the uptrend continues, the next target levels are $4,955, $5,300, and $5,500.
Stay tuned!
Thank you,
@Money_Dictators

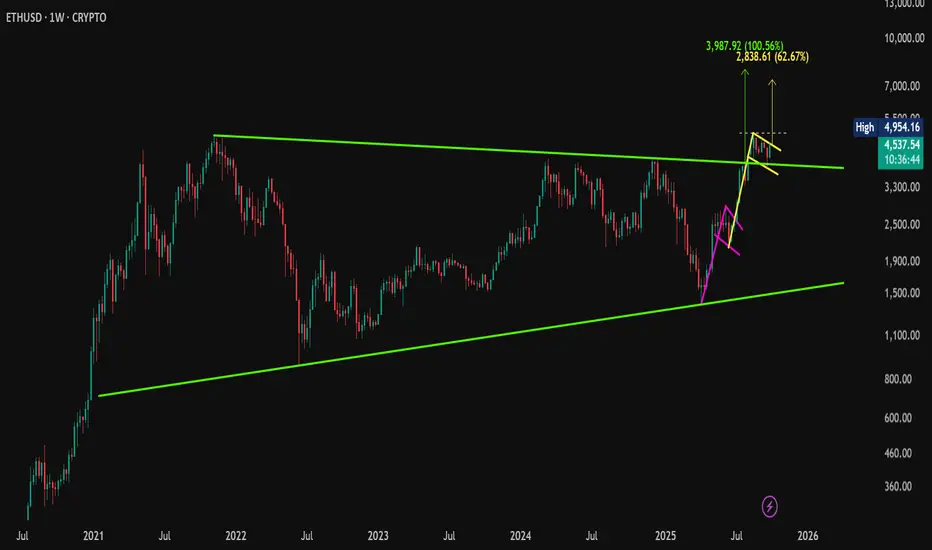
ETH Triangle Breakout + Bull Flag Setup – Is $8K Next?CMP: $4,540
Ethereum has broken out of a long-term symmetrical triangle , retested the trendline, and is now moving higher — signaling strong bullish momentum.
🔹 Breakout Retest Done – ETH completed a clean breakout and retest of the triangle resistance.
🔹 Bull Flags – Two bullish continuation flags have formed. The second flag is on the verge of breaking out , hinting at another potential leg up.
🔹 Pattern Targets –
• Bull Flag target: $7,365 +, if breakout confirms.
• Symmetrical Triangle target: $7,950 , which is over 62% above current price.
🟢 Key Level to Watch: A weekly close above $4,954.16 (previous ATH) would further validate the bullish structure.
#ETH | #Ethereum | #Crypto | #Breakout | #ChartPatterns | #SymmetricalTriangle | #BullFlag | #PriceAction
📌 Disclaimer: This analysis is shared for educational purposes only. It is not a buy/sell recommendation. Please do your own research before making any trading decisions.
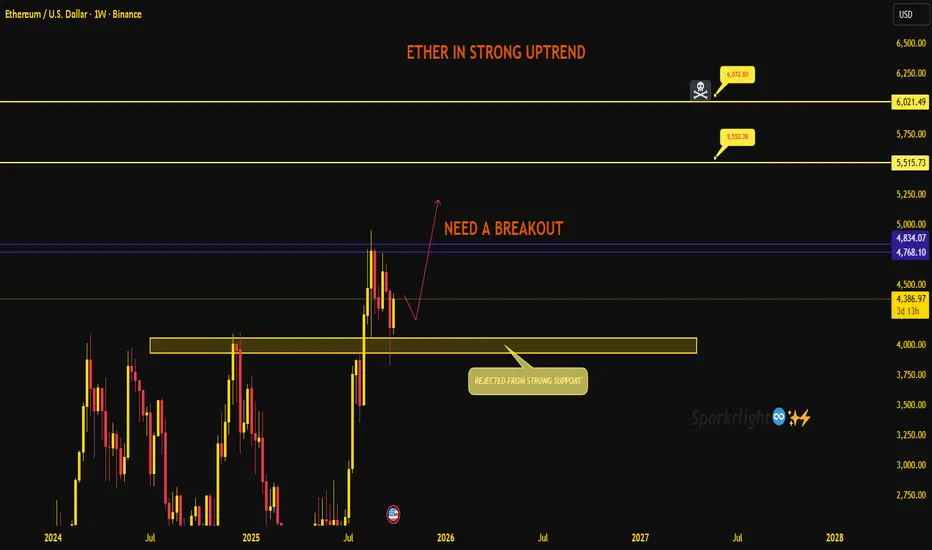
Ethereum – Strong Uptrend but Needs a Breakout!!Ether is still holding its strong uptrend, and the recent rejection from support has kept the bullish structure intact. The bigger picture remains positive, but short-term price action now demands a clear breakout to confirm continuation.
Current structure:
Price bounced cleanly from the 4000 zone, showing that buyers are defending the base.
The rally stalled just below the 4800–4850 resistance. This is the key barrier that needs to give way for the next leg higher.
Until then, we are stuck in a consolidation between strong support below and heavy resistance above.
Key levels to track:
Support: 4050–3950. As long as this zone holds, bulls keep the upper hand.
Breakout zone: 4768–4834. A weekly close above here should trigger momentum buyers.
Upside targets: 5515 → 5550, and if momentum extends, 6,000+.
Short-term view:
Ethereum is in a strong trend but needs that breakout above 4,800 to unlock the next wave higher. If buyers fail to push through, expect more back-and-forth action near support before another attempt.
The structure favors patience – wait for the breakout confirmation rather than chasing inside the range. Trade safe.
ETH BIG HAMMERAfter good correction ETH has made a hammer at the previous liquidity zone (Support).
One can look for Buy on dip from here on in ETH.
SL- 4070
Target- 4300, 4370, 4400
Disclaimer- This is just for Education Purpose.
Follow for mor such content and learnings.
Jai Shree Ram.
