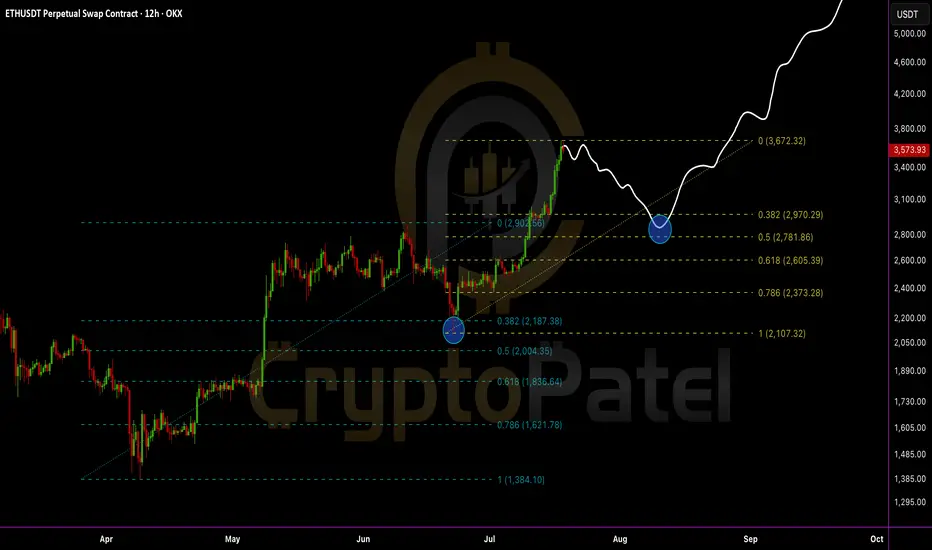
Everyone’s bullish now… but smart traders are waiting for this EEthereum just tapped a key resistance near $3,672 and is starting to show signs of cooling off.
A healthy retracement could bring ETH back to:
0.382 Fib – $2,970
0.5 Fib – $2,781
0.618 Fib – $2,605 (Strong demand zone)
IMO, we can expect ETH to revisit the $2,700–$3,000 zone before the next leg up.
This area will be the golden re-entry for long-term targets of $6,000–$8,000.
Stop-loss: Recent high and candle close above $3,675
Structure remains bullish:
✅ Previous dips into Fibs triggered strong buybacks
✅ Clean higher highs and higher lows
✅ Demand zone + retracement = opportunity
My View: Let price pull back. Then load up again. Bigger wave incoming.
DYOR | NFA
Ethereum (Cryptocurrency)
$XRP just broke its all-time high: $3.66CRYPTOCAP:XRP just broke its all-time high: $3.66 — and this is just the beginning?
After years of waiting, XRP finally explodes past $2 and hits $3.66 this bull run. It’s not just a win for XRP holders — it’s a lesson in patience, conviction, and catching early setups before the hype.
Why it matters now:
🔹 While everyone’s chasing the latest meme coin, XRP silently did a clean 7x from $0.50.
🔹 Regulatory clarity is improving — XRP’s bullish narrative is finally unfolding.
🔹 Market rotation is real: old giants like XRP are moving again, and this signals strength in Layer 1 comeback plays.
Quick breakdown:
📌 First signal at $0.50 → 7x
📌 Second entry below $2 → already 2x
📌 Current price: $3.66 (ATH)
📌 Many ignored it, some mocked it — but price tells the truth.
Patience beats hype. Quality setups > chasing pumps.
Save-worthy takeaway:
If you ever feel FOMO, remember this:
The best trades aren’t loud. They’re early, quiet… and require conviction.
What’s your biggest “I told you so” moment in this bull run?👇
Let’s hear your favorite early calls — drop them in the replies!

is Ethereum ready to $10,000Ethereum just broke out of a massive inverse head & shoulders and it’s flying past $3,400 again after 5 months. 🚀
Chart looks Bullish for a run toward $6K… but don’t be surprised by a dip to ~$2,800 first.
ETH is super bullish.
Next stops: $6K → $8K → $10K.
NFA & DYOR

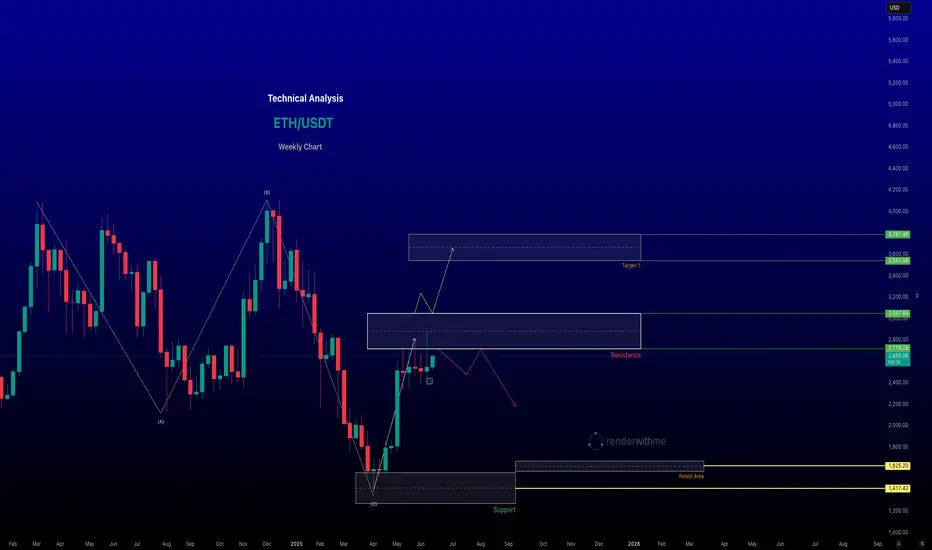
renderwithme | ETH Price Prediction for next six Months 2025
Price Prediction for next six Months 2025
Price Range: Based on various forecasts, Ethereum (ETH) is expected to trade between approximately $2,500 and $3,360 in August 2025. The minimum price could be around $2,519.80, with a potential peak of $3,360.36. The average trading price is projected to be around $2,800–$3,100.
Bullish Scenario: If bullish momentum continues, driven by factors like institutional inflows or positive network developments, ETH could test the $3,150–$3,300 range or even approach $3,500 by late August. A breakout and close above $3,100 could trigger a rally toward $3,550–$3,800.
Bearish Scenario: If market sentiment turns negative, due to macroeconomic uncertainties or regulatory pressures, ETH could dip to $2,470–$2,500, with a potential further decline to $2,400 if support levels fail.
~~ Disclaimer ~~
This analysis is based on recent technical data and market sentiment from web sources. It is for informational \ educational purposes only and not financial advice. Trading involves high risks, and past performance does not guarantee future results. Always conduct your own research or consult a SEBI-registered advisor before trading.
# Boost and comment will be highly appreciated.
$PENGU is up 180% from our entry. Insane move.CSECY:PENGU is up 180% from our entry. Insane move.
Entry was around $0.010 — today it touched $0.0308. Almost 3x.
I booked 50% profits here. Still bullish, but I always play safe.
Profit booking is part of the game — don’t wait till it’s too late.
If you’re holding big — at least secure your free capital.
Then ride the rest with peace of mind.
What’s your move? Booked profits or still holding? 👇
Drop a comment + Retweet if you caught this run.
NFA & DYOR

Best Possible Elliott Wave Counts: ETHUSDHello friends,
Welcome RK_Chaarts.
Today we're attempting to analyze Ethereum's chart from an Elliott Wave perspective. Looking at the monthly timeframe chart, we can see that from the beginning, around 2015-2016, when data is available, to the top in 2021 we have a Super Cycle degree Wave (I) marked in blue, which has completed.
Next, June 2022 we have a bottom around $874, marking the end of Super Cycle Wave (II) in blue.
We are now unfolding Wave (III), which should have five sub-divisions. Within this, the red Cycle degree Wave I and Wave II have completed, and we have possibly started the third of third wave.
Monthly:
Moving to a lower timeframe (Weekly) where we observed the completion of blue Wave (II) and the start of Wave (III), we notice that within this, the red Cycle degree Wave I and Wave II have completed, and we've possibly started Wave III of cycle degree marked in Red.
Furthermore, friends, within this third wave, we've marked the black Primary degree Waves ((1)) and ((2)), which we've labeled as Rounded ((1)) and Rounded ((2)). We're assuming these are complete, and Wave ((3)) has started, which is our current working hypothesis.
Weekly:
Now, if we move to a lower timeframe, such as the daily chart, we can see that the Cycle degree Wave II, which ended at 1385.70, has been followed by a Primary degree black Wave ((1)) in Black & Wave ((2)) has pulled back, completing Waves ((1)) and ((2)), and now Primary degree Wave ((3)) has started.
Possible wave counts on Daily
Within Wave ((3)), we expect five Intermediate degree waves. We've marked the first Intermediate degree Wave (1) in blue, which is currently unfolding. If we move to an even lower timeframe, such as the 4-hour chart, we can see that within the Intermediate degree blue Wave (1), there are five Minor degree sub-divisions marked in red. Waves 1 and 2 are complete, and Wave 3 is nearing completion.
Possible wave counts on 4 Hours:
Once Wave 3 is complete, we expect Waves 4 and 5 to follow, completing the Intermediate degree blue Wave (1). After that, we may see a dip in the form of Wave (2), followed by a continuation of the bullish trend as blue Wave (3).
Possible wave counts on 60 Min:
Friends, based on our multi-timeframe analysis, the overall wave structure appears bullish. We've provided snapshots of each timeframe, and you can see the nearest invalidation level marked with a red line.
In this study, we're using Elliott Wave theory and structure, which involves multiple possibilities. The scenario we're presenting seems plausible because it's aligned across multiple timeframes and adheres to Elliott Wave principles. However, please remember that this analysis can be wrong, and you should consult with a financial advisor before making any investment decisions.
This post is shared purely for educational purposes, to illustrate possible Elliott Waves.
I am not Sebi registered analyst.
My studies are for educational purpose only.
Please Consult your financial advisor before trading or investing.
I am not responsible for any kinds of your profits and your losses.
Most investors treat trading as a hobby because they have a full-time job doing something else.
However, If you treat trading like a business, it will pay you like a business.
If you treat like a hobby, hobbies don't pay, they cost you...!
Hope this post is helpful to community
Thanks
RK💕
Disclaimer and Risk Warning.
The analysis and discussion provided on in.tradingview.com/u/RK_Chaarts/ is intended for educational purposes only and should not be relied upon for trading decisions. RK_Chaarts is not an investment adviser and the information provided here should not be taken as professional investment advice. Before buying or selling any investments, securities, or precious metals, it is recommended that you conduct your own due diligence. RK_Chaarts does not share in your profits and will not take responsibility for any losses you may incur. So Please Consult your financial advisor before trading or investing.

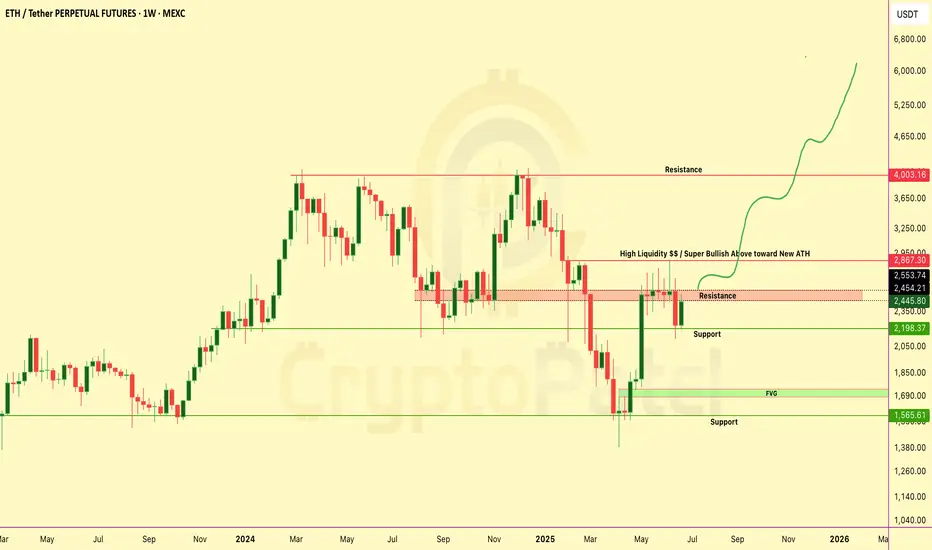
ETHUSD📈 BITSTAMP:ETHUSD Weekly Chart | CMP: $2975
✅ Flag breakout above $2750
✅ Triangle breakout confirmed
📉 Previous range: High $4105 (Dec 2024) – Low $1385 (Apr 2025)
With current breakout holding, if $2290 (weekly close) holds as stop loss,
🎯 Target: $4430 in 12–18 months
Structure looks strong for long-term upside.
#ETH #Ethereum #Crypto #Altcoins #ChartAnalysis

$ETH IS FLIRTING WITH A MASSIVE BREAKOUTCRYPTOCAP:ETH IS FLIRTING WITH A MASSIVE BREAKOUT
Price is hovering just below the HIGH LIQUIDITY ZONE at $2,867 — a major inflection point!
✅ Break above… We could see a parabolic push toward ATHs.
❌ Rejection = A sharp correction might hit hard.
It’s make or break time for Ethereum.
What’s your plan if this breaks?
NFA & DYOR

ETH Long Setup: Key Support Zone at $2,453.72The $2,453.72 zone on CRYPTOCAP:ETH looks promising for our next potential long setup.
It’s a key support level and holds significant liquidity—definitely a zone worth watching.
This is not financial advice. Always trade at your own risk.

ETHEREUM Weekly Chart Breakdown – Massive Move Loading?ETHEREUM Weekly Chart Breakdown – Massive Move Loading?
ETH just pumped +9.9% this week... but it’s what comes next that really matters 👇
Key Resistance Wall → $2,867
🔹 This zone is packed with liquidity traps and past rejections.
🔹 Break this level = Unlocks ATH push toward $4K–$6K-$10k
Why This Chart Matters:
✅ Bullish structure reclaim
✅ Targeting “High Liquidity” zone above
✅ Possible parabolic rally if breakout confirms
Dips = Opportunities
If ETH dips from here... don’t panic.
→ Every dip = fresh accumulation zone
→ Below $2,000 = golden buy zone for long-term bulls
Liquidity Zone Break it = ATH rally incoming
Reject it = Buy the dip and ride the next wave
Comment & tag a friend who needs this alpha!
NFA & Dyor
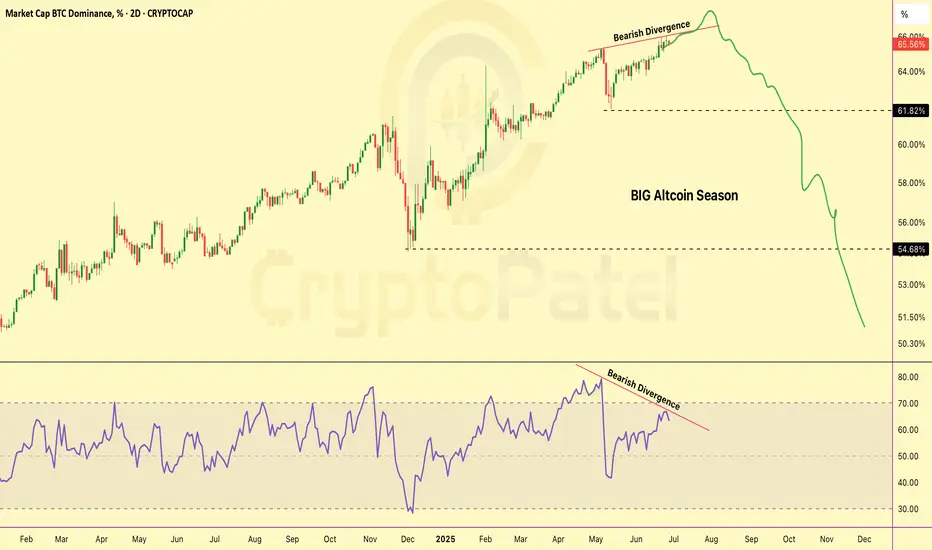
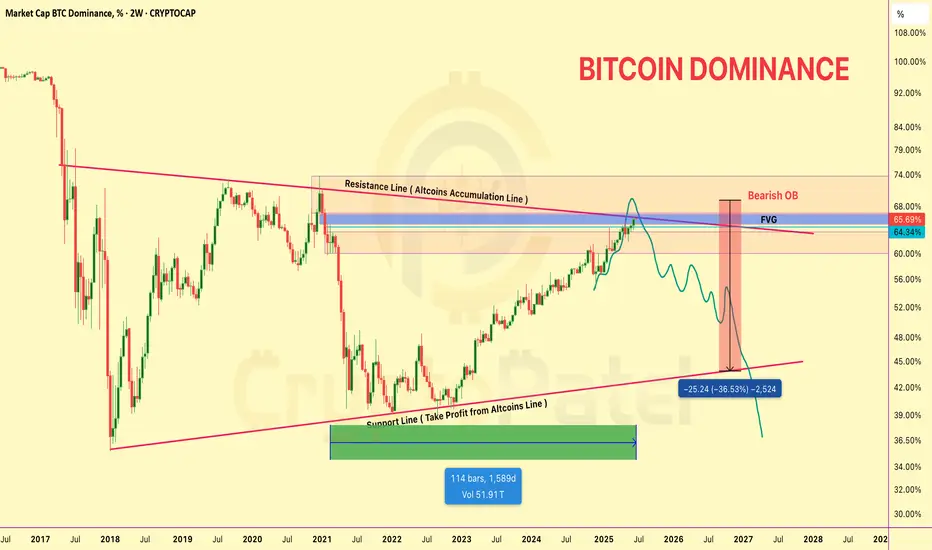
Big Altseason Is Loading... Ready for Big Altseason... but Why?BTC Dominance Showing Bearish Divergence!
Get ready... a massive Altcoin Season could be coming soon!
📉 Chart and RSI both showing weakness
📉 If dominance drops from here, money will likely flow into altcoins
📉 Next target: 50% dominance — same level where ALTs pumped 5x–10x last time!
This could be the biggest altseason of the cycle.
Don’t miss the opportunity!
Comment your top 3 altcoin picks 👇
Stay tuned for updates — we’ll post the best setups!
NFA & DYOR
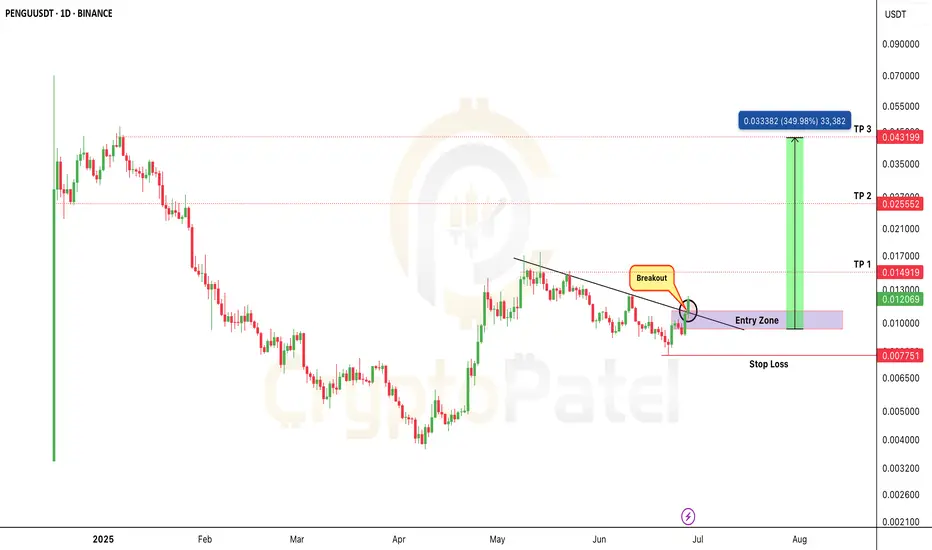
PENGU Breakout Live — Could This Be the Next 5x Runner?PENGU Breakout Live — Could This Be the Next 5x Runner?
PENGU/USDT just broke a major trendline after weeks of consolidation…
If this breakout holds — we’re staring at a potential 3x–5x move in the coming days.
But here’s the twist…
❌ Don't FOMO!
The smart entry is likely $0.010–$0.0090 — a clean retest zone where risk–reward is best.
Chart invalid if price breaks below: $0.0077
Targets if breakout holds: $0.0150 / $0.025 / $0.043 / $0.10
This is a breakout + retest setup with explosive potential — but only if you play it right.
Always use risk management.
This is NOT financial advice — DYOR before you enter any trade.
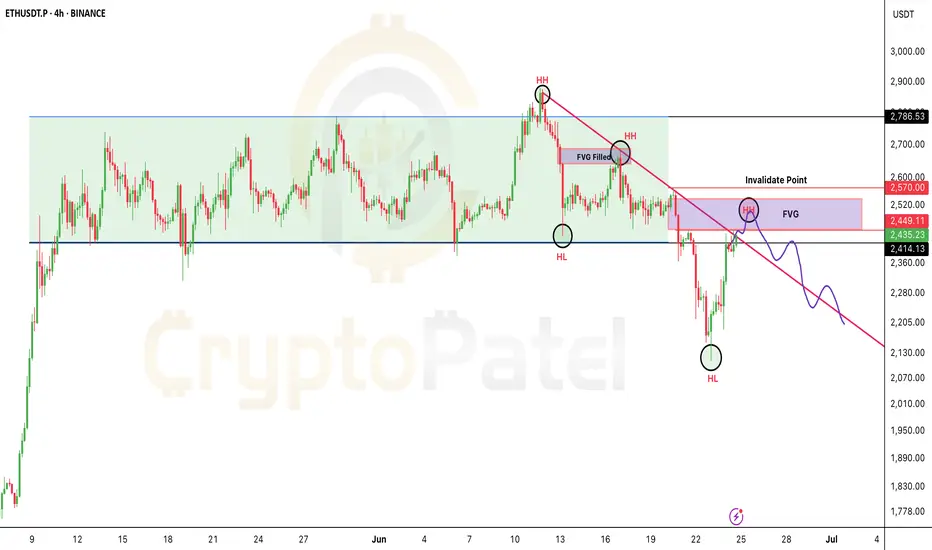
If you're shorting Ethereum, watch $2570 closely.If you're shorting Ethereum, watch $2570 closely.
If a candle closes above $2570, that invalidates the short — time to exit.
Why?
Because above this level, the risk/reward flips against you.
Better to wait for a cleaner entry with less risk, more reward.
Target: $2000
Retweet if this helps your trade plan.
NFA & DYOR
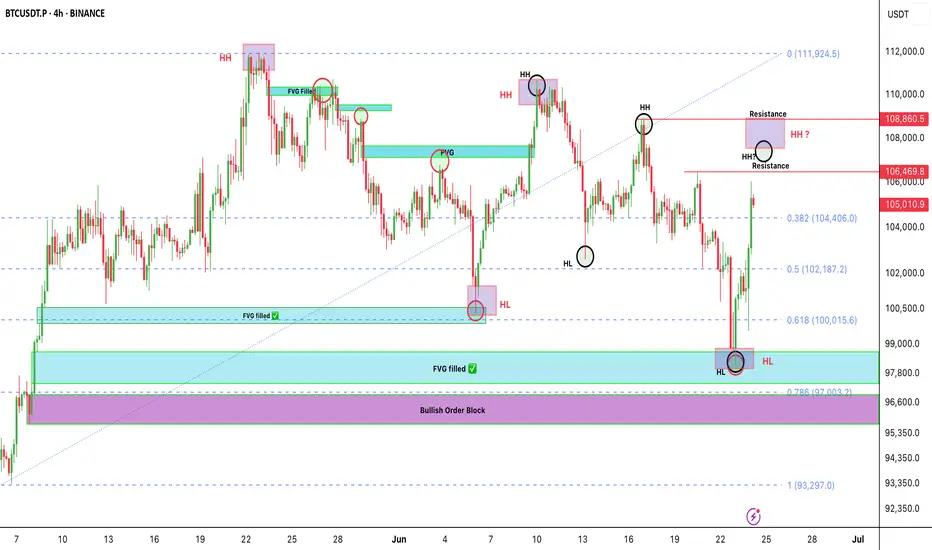
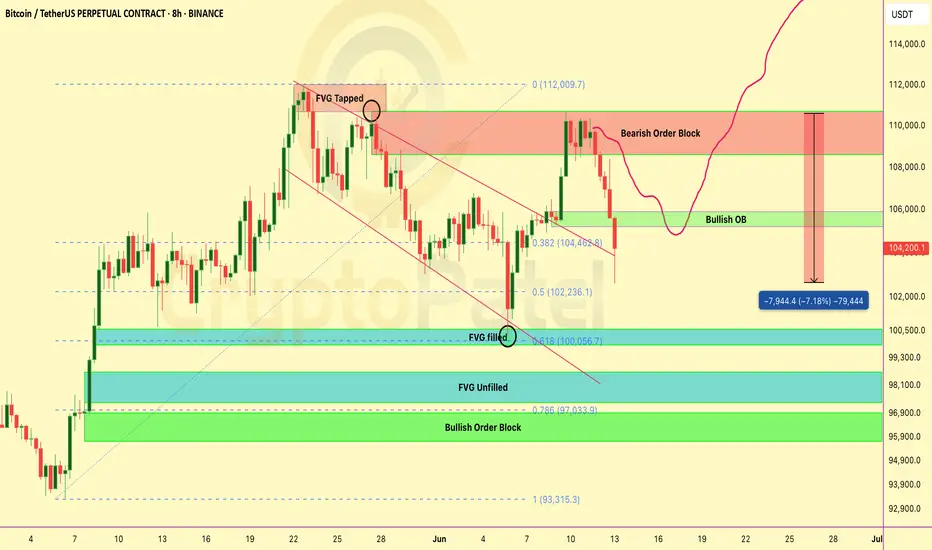
Bitcoin isn’t fully bullish yet — most people are falling for thBitcoin isn’t fully bullish yet — most people are falling for the trap
BTC just bounced beautifully from the $97.8K–$98K demand zone.
It tapped into key confluences:
✅ FVG filled
✅ 0.618-0.786 Fib level
🟪 Bullish Order Block just above 0.786
But let’s be real — we’re not in full bullish mode yet.
This looks more like a short-term pullback, not a trend reversal.
What I'm Watching Closely:
🔹 BTC is forming two HH & HL patterns.
🔹 Super important for us to track both — they’ll guide the next big move.
🟥 LTF last HH = $108,900
🟥 HTF last HH = $110,654
As long as BTC stays below these, the structure is still bearish.
We only flip bullish when candles break and close above them.
If Bullish Breakout happens? We’re eyeing new ATH targets toward $150K 🚀
My Plan Right Now:
🔹 Watching $107K & $109K levels for clean short setups.
Why?
👉 Low-risk entries
👉 Tight SL
👉 Big reward — Targeting around $100K
Stay alert, don’t chase. Let the levels come to us.
Let me know in the comments 👇 Are you flipping bullish, or still cautious?
NFA & DYOR
BITCOIN DOMINANCE ANALYSIS – Altseason Loading?BITCOIN DOMINANCE ANALYSIS – Altseason Loading?
This is the Bitcoin Dominance (BTC.D) chart.
Remember: BTC Dominance moves inversely with altcoins —
✅ When dominance goes down, altcoins usually go up.
✅ When dominance goes up, altcoins often struggle.
Current Situation
🔹 BTC Dominance is now testing a major resistance level, also known as the Altcoins Accumulation Line.
🔹 This level has historically marked the end of altcoin sell-offs and the beginning of altseason.
🟥 A clear Bearish Order Block and a Fair Value Gap (FVG) zone have formed at this resistance.
These are signs of potential reversal and weakness ahead for BTC Dominance.
If Rejected...
If BTC.D fails to break above this resistance, we could see a sharp drop of ~36%, targeting the long-term support line — an area that often signals profit-taking from alts.
Historical data shows a repeating pattern every ~4 years. This structure lines up perfectly with that cycle — a strong signal.
🔹 We’re likely at the final stage of the altcoin correction.
🔹 The market structure hints that a strong altcoin season could follow if dominance starts falling from this zone.
➡️ It’s a good time to start accumulating strong altcoins before momentum shifts.
ETH/USDT Dumped hard as I predicted and next Target?ETH SHORT HIT — As Predicted!
Hey fam
Hope you enjoyed the ETH short setup I shared earlier when price was around $2700–$2800
ETH is now down 22% from that level.
Broke support just like we discussed…
And remember I said — if $2500 breaks, we could see $2200.
Well… we’re already there now ✅
What Now?
This is where we start accumulating on spot.
Why?
Because ETH is currently at the 0.5 Fib level — could hold.
If not, we target 0.618 Fib for next entry.
Best Accumulation Zone: $2200–$1800
Strong bullish OB around $1782–$1840
If price drops there, expect a solid bounce!
I’m personally watching this zone for spot entries targeting $8000–$10,000 next run 🚀
Let me know below if you're buying this dip!
And as always… stay tuned for the next sniper setup.
NFA & DYOR
Will Bitcoin Hit $80k Before $171,000 ?Bitcoin is Forming a Inverse Head & Shoulders on the 2D chart...
And if this plays out — we could be looking at a move to $171,000
Here’s what you need to know:
Structure Breakdown:
▪️ Left Shoulder: Completed
▪️ Head: Completed
▪️ Right Shoulder: (in progress)
Neckline: ~$112.5K-$115k
Breakout above neckline = $171K target
That’s a +49% upside move from here.
But here’s the catch...
When too many spot the same pattern — whales love to trap.
Fakeouts, stop hunts, liquidations — you’ve seen it before.
❌ If BTC drops below $100K (Right Shoulder base), this setup flips bearish fast.
Key Support Zones:
▪️ $93,940 (Fib 0.382)
▪️ $80,780 (Fib 0.786)
Trade with confirmation, not emotion.
Respect your invalidation levels and protect capital.
What’s your play if we tap $112K? 👇
NFA & DYOR

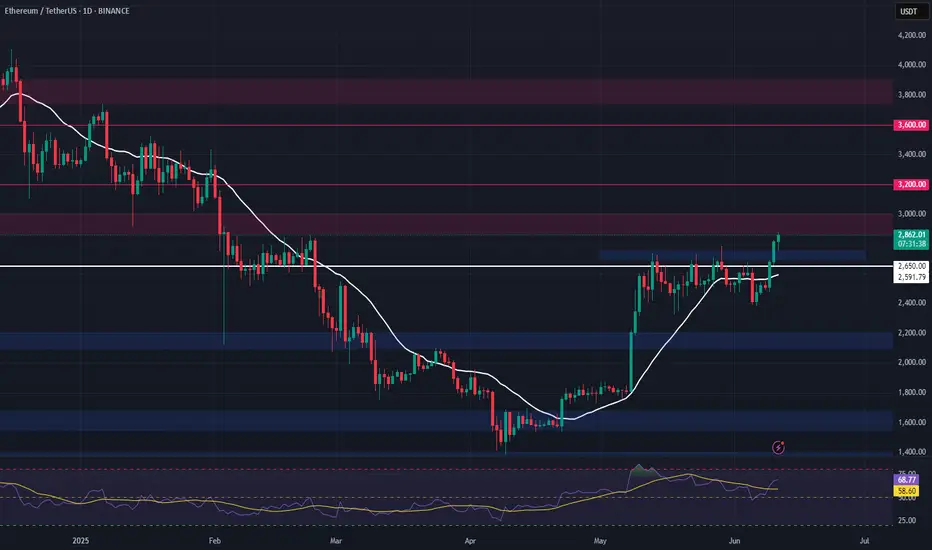
Ethereum Technical Analysis for the Week of June 16-June 231. Price Overview
Current Price: As of June 16, 2025, Ethereum's price is approximately $2,610.36 USD, with a 24-hour trading volume of $16.83 billion USD. It is up 2.59% in the last 24 hours.
Market Cap: Ethereum holds the #2 rank with a live market cap of $315.13 billion USD. Circulating supply is 120.72 million ETH.
Recent Performance:
Over the last 7 days, ETH has risen by 20%, showing strong upward momentum.
In the past month, ETH increased by 16.61%, adding an average of $624.97 to its value.
ETH has underperformed compared to Bitcoin in 2025 but shows signs of recovery with institutional interest growing.
# Support and Resistance Levels:
Support: Key support is around $2,160–$2,020
Resistance: Immediate resistance lies between $2,739–$2,850. A breakout above $2,800–$3,000 could target $3,400–$4,100.
-- Disclaimer --
This analysis is based on recent technical data and market sentiment from web sources. It is for informational purposes only and not financial advice. Trading involves high risks, and past performance does not guarantee future results. Always conduct your own research or consult a SEBI-registered advisor before trading.
#Boost and comment will be highly appreciated
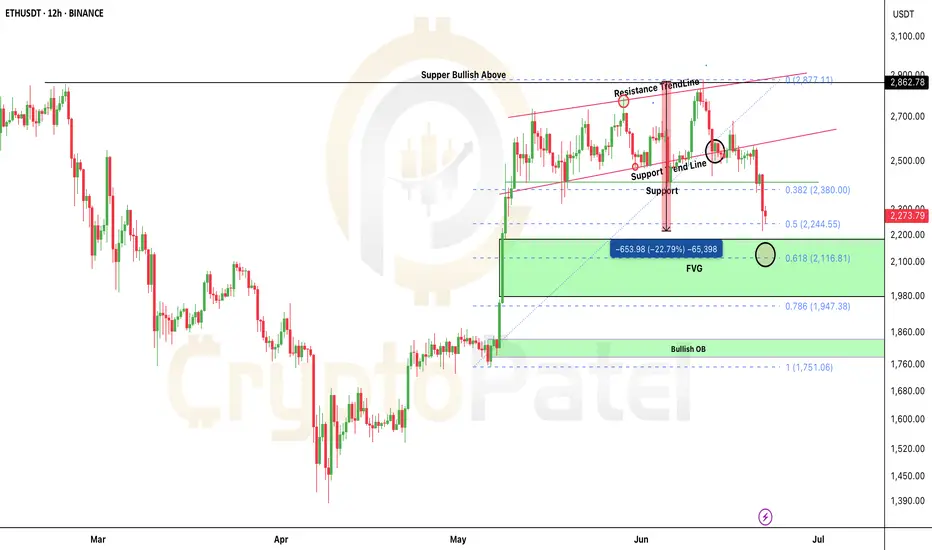
$ETH BLOODBATH: -15% Dump! Next Stop $2100? CRYPTOCAP:ETH BLOODBATH: -15% Dump! Next Stop $2100?
I shorted right from $2862 — nailed the move.
Now trading below critical $2550 support.
👉 Hold $2550? Reversal towards $3000-$4000 possible.
👉 Lose it? We likely fill $2100-$2200 FVG — 0.618 fib at $2116.
$2860 remains THE level to watch for a New ATH.
💬 Comment your ETH target!
🔁 Retweet if this helps your gameplan.

BITCOIN ANALYSIS UPDATE — READ THIS CAREFULLY!🚨 BITCOIN ANALYSIS UPDATE — READ THIS CAREFULLY! 🚨
Hope you followed our last BTC analysis — and DID NOT open any longs at the top.
If you followed: Congrats — you either made big profits on the short, or at least saved your money by not longing.
✅ We clearly warned when BTC was around $110K — more correction was coming.
Result? Bitcoin is now 7% DOWN since that call.
❗ Now the situation is DANGEROUS:
👉 BTC broke my Bullish Order Flow at $105K.
👉 If this $105K support doesn’t hold soon → we may see a deep correction towards $90K.
$105K is the level to watch like a hawk.
👉 Iran-Israel news just accelerated the fall — but we already predicted this move before the news.
🚫 NEVER gamble with your hard-earned money.
✅ Always wait for solid confirmation before entering trades.
👉 Stay smart. Stay safe. Stay patient.
💬 Comment your thoughts below.
🔁 Forward this to your crypto friends — they NEED to see this!
ETH Long Swing Setup – Breakout Retest of Key ResistanceETH has broken above the critical $2,750 resistance, signaling bullish momentum. We’re now watching for a retrace into the $2,700–$2,750 zone, which is expected to act as support for a continuation higher.
📌 Trade Setup:
• Entry Zone: $2,700 – $2,750
• Take Profit Targets:
o 🥇 $3,000
o 🥈 $3,200
o 🥉 $3,700
• Stop Loss: Daily close below $2,650
This BTC Pullback Could Be The Last Dip Before $120K+ — Are You #Bitcoin has just delivered a textbook breakout — but what comes next might surprise you. Let’s break it down: 👇
🔸 Bearish Order Block @ $109K–$110K
Price tapped into this zone and is currently reacting. Expect short-term volatility here.
🔸 FVG (Fair Value Gap) Filled + Tapped
A clean move back up filled the previous FVG — this typically signals strength but also invites sellers at OB zones.
🔸 Key Bullish Order Block @ $106K
If BTC pulls back, this zone will be crucial. A strong defense here could ignite the next leg up.
🔸 Fib Levels Aligned:
0.382 Fib @ ~$104.5K
0.5 Fib @ ~$102.2K
0.618 Fib & Bullish OB cluster @ ~$100K ( Filled )
Possible Play Ahead:
A dip toward $106K–$104K is healthy → watch for buyer reaction.
If CRYPTOCAP:BTC holds the $106K OB and bounces, a move back toward $112K+ ATH retest is very likely.
Big Picture:
The breakout from the descending channel + OB retest gives BTC strong bullish structure — as long as the $106K zone holds.
Are you ready for the next BTC move?
📈 Comment below: BULLISH or BEARISH?
🔄 Retweet to keep others in the loop!
NFA & DYOR

#Ethereum Breakout Attempt #Ethereum Breakout Attempt 📢
After weeks of consolidation inside this range → CRYPTOCAP:ETH is now testing a breakout above major resistance $2750
👉 If this breakout holds → we could see a BIG upward rally toward $3500–$4000 in the coming weeks. 🚀
Keep an eye on this level — the next move could be massive.
