Ethereum Technical Analysis for the Week of June 08-June 14~~ Technical Analysis~~
Current Price and Market Overview
Price: As of June 8, 2025, Ethereum (ETH) is trading at approximately $2,515.45 USD, with a 24-hour trading volume of ~$11.45 billion and a market cap of ~$303.67 billion. It has risen by 1.64% in the last 24 hours.
Recent Performance:
Weekly: Down -2.77%, indicating short-term consolidation or profit-taking.
Monthly: Up 43.31%, reflecting strong bullish momentum over the past month.
Yearly: Down -32.01%, suggesting longer-term challenges compared to its all-time highs.
Market Rank: Ethereum remains the #2 cryptocurrency by market capitalisation, behind Bitcoin.
-- Disclaimer --
This analysis is based on recent technical data and market sentiment from web sources. It is for informational and educational purposes only and not financial advice. Trading involves high risks, and past performance does not guarantee future results. Always conduct your own research or consult a SEBI-registered advisor before trading.
#Boost and comment will be highly appreciated
Ethereum (Cryptocurrency)

Ethereum Bull Run Analysis Here's the latest on Ethereum:
- Current price is $2,506
- There's been a surge in institutional interest, driving huge demand for ETH ETFs
- Asset managers like BlackRock and Fidelity have been buying Ethereum continuously while selling off BTC ETFs, resulting in record-high inflows
- This type of inflow is typically seen before Ethereum takes off and enters a parabolic phase
- Technically, it all depends on how USDT D and BTC D perform; they both need to drop significantly for money to rotate within the markets
- I still think Ethereum can easily revisit $2,100 before breaking out, which should signal the top for USDT D, ultimately leading to Ethereum outperforming and a 50% move from there.
- Accumulation Zones for ETH: 1700-1890$, 2000-2120$
BTC Breakdown or Bounce? Key Levels You Need to Watch!BTC Breakdown or Bounce? Key Levels You Need to Watch!
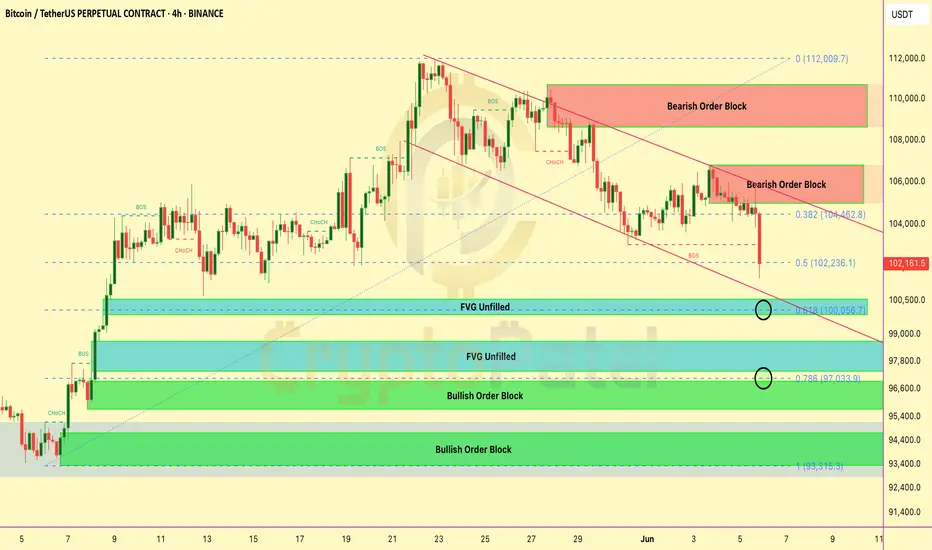
#Bitcoin 4H Chart Analysis – SMC Overview:
BTC is currently in a short-term downtrend, respecting a descending channel and showing clear bearish structure.
🔴 Bearish Signs:
Price rejected from 2 major Bearish Order Blocks:
▶️ $106K–$104K
▶️ $111K–$109K
Breaks of Structure (BOS) and Change of Character (CHoCH) confirm trend shift to bearish Couldn’t hold the 0.382 Fibonacci level at $104.4K — now testing the 0.5 Fib at $102.2K
🟢 Key Support Zones (Potential Reversal Areas):
1️⃣ $100K Zone
✔️ 0.618 Fib level
✔️ Unfilled Fair Value Gap (FVG)
🔍 Possible bullish reaction from here
2️⃣ $97K Zone
✔️ 0.786 Fib
✔️ Bullish Order Block (OB)
✔️ Another FVG
💥 Strong confluence — good probability of reversal
3️⃣ $93K Zone
✔️ Deep Bullish OB
🛡️ Last strong support if $97K fails
🔼 If bulls reclaim control: We need a clear CHoCH above $104.5K to confirm bullish shift
⚠️ Tip: Mark these zones. Use alerts. Let the price come to you — don’t force trades.
📢 Share if useful & stay updated
Ethereum (ETH/USD) Technical Analysis — Bearish Rejection Below 🔍 Ethereum (ETH/USD) Technical Analysis — Bearish Rejection Below Resistance ⚠️
📅 Date: June 4, 2025
📊 Chart Type: 2-Hour Timeframe
💱 Exchange: Binance
---
🧠 Overview:
The chart displays a clear range-bound market between well-defined resistance and support zones. The most recent price action suggests a rejection from the resistance region, hinting at a possible downward move toward support.
---
🟧 Key Levels:
Resistance Zone: $2,720 – $2,760
Price has tested this zone multiple times and failed to break above decisively.
Marked as a strong supply area where sellers dominate.
Support Zone: $2,460 – $2,490
This area has historically attracted buying interest, causing price reversals.
---
📉 Market Structure & Price Action:
The recent swing high formed a lower high relative to the peak on May 29, suggesting bearish momentum.
A projected bearish move is marked on the chart with a blue arrow 📉, forecasting a drop from around $2,640 down to the support zone near $2,480.
Multiple failed attempts to break resistance signal a potential trend continuation to the downside within this trading range.
---
⚠️ Trading Implications:
Short-term bias: Bearish 🔻
Confirmation needed: A breakdown below $2,600 with volume would strengthen bearish conviction.
Target for bears: $2,480 support area
Invalidation zone for this outlook: A breakout and close above $2,760 would shift the bias to bullish.
---
📌 Conclusion:
Ethereum is currently trading within a well-defined horizontal channel. With the latest rejection near resistance, the probability favors a move down to the support area. Traders should monitor key levels closely for confirmation before entering positions.
📈 Tip: Use proper risk management and watch for candlestick confirmation at critical levels.

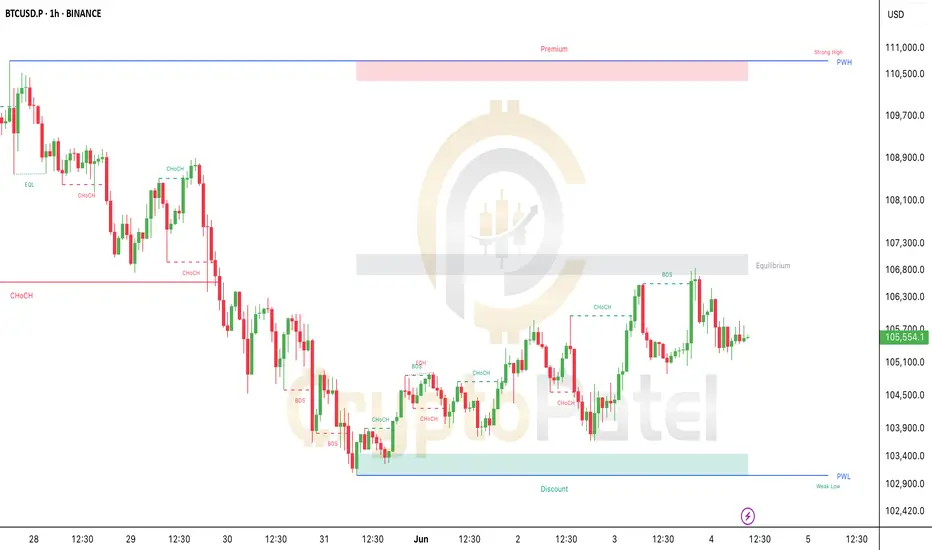
Breakout or Breakdown? BTC at Critical Level!Breakout or Breakdown? BTC at Critical Level!
#Bitcoin is showing early bullish signs after a clean reversal from the discount zone (~$103K).
We saw a CHoCH → BOS → Retest sequence play out perfectly!
Price is now consolidating just below a key supply zone (~$106.8K). This is the Equilibrium Zone – where smart money decides the next move.
🔹 As long as BTC holds above $104.2K, we stay bullish.
🔻 BUT – if we break below $103.4K, expect a deeper pullback, and we could even see Bitcoin drop under $100K for a proper liquidity sweep.
What’s Next?
If we reclaim $106.8K with strength, the next target is the Premium Zone around $110K–$111K, where major liquidity sits!
Watch for breakout or rejection – don’t FOMO. Patience = Profits.
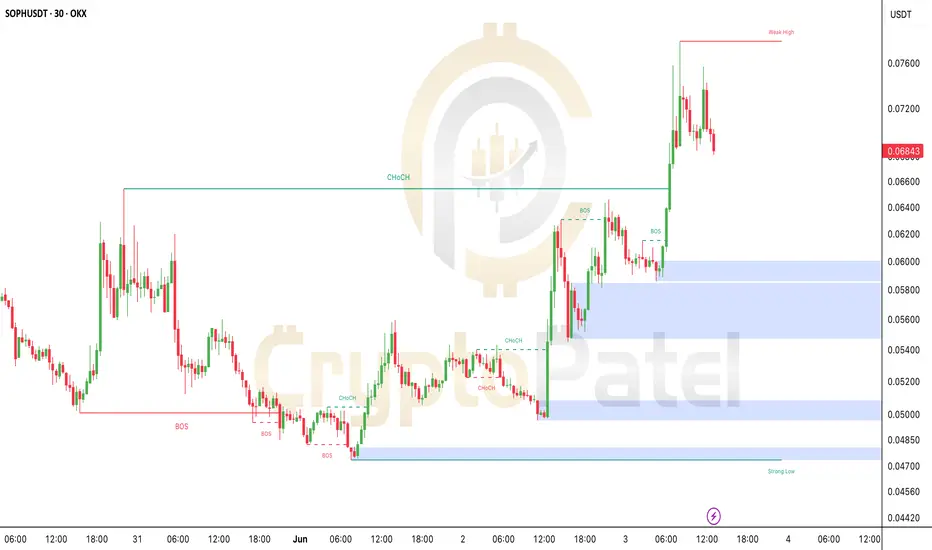
SOPH Price Reversal Confirmed – Here’s What Comes Next!#SOPHUSDT Market Update – Bullish Structure in Play!
SOPH just flipped bullish on the 30-min chart! Here's the breakdown in simple terms:
🔸 Trend Reversal Confirmed
After a long downtrend, SOPH broke structure and shifted to bullish with strong price action from the $0.058–$0.060 demand zone.
🔸 Smart Money Accumulation
Price grabbed liquidity below $0.052, then pumped hard — a classic move by smart money to trap sellers and fuel the rally.
🔸 Weak High at $0.076
The recent high looks weak and might get taken out soon. Price is consolidating just below it — a sign of strength.
🔸 Next Moves to Watch:
Holding above $0.060 = bullish bias stays strong
Retest and bounce from $0.060–$0.058 zone = ideal entry
Targeting above $0.076, maybe even $0.080+ in the coming hours
If SOPH drops below $0.058, we’ll watch the $0.050–$0.047 zone for the next strong support.
Smart Money Playbook: Accumulation → Manipulation → Expansion
Stay sharp & watch the zones closely!
Note: this is Not Financial Advice so DYOR
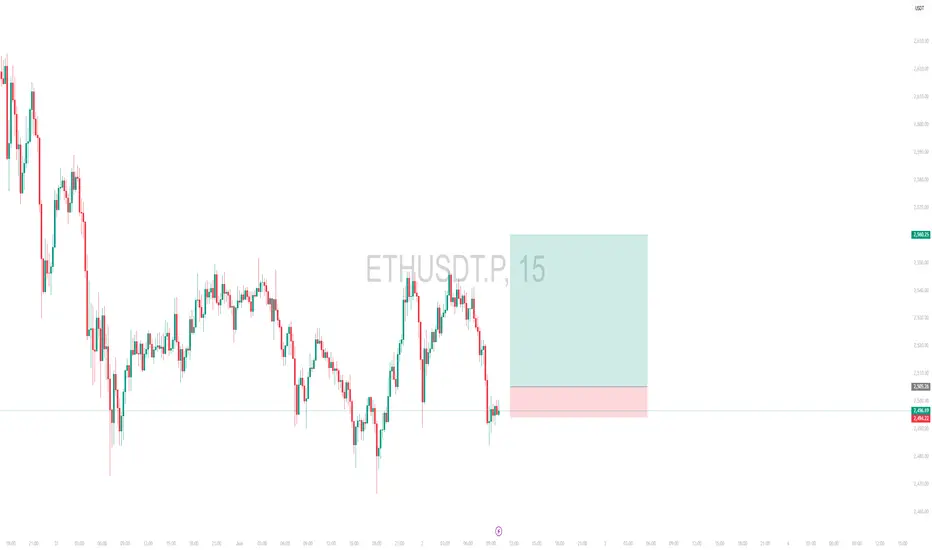
Intraday Long Setup | June 2nd 2025 | Valid Until Daily ClosePrice is retracing to a strong pivot zone (marked by the red box).
Structure remains bullish with potential for continuation after pullback.
The green box represents a high-probability long opportunity with tight risk control.
Watch for price reaction within the red zone. Entry only if confirmation (e.g., bullish engulfing, strong wick rejections) appears.
The setup expires at end of the daily candle close.
Ethereum (ETH/USD) Price Action Analysis (1-Hour Timeframe)📊 Ethereum (ETH/USD) Price Action Analysis (1-Hour Timeframe) 📈
🔍 Chart Context:
Timeframe: 1-hour (intraday outlook)
Asset: ETH/USD (Binance)
🟠 Key Levels & Observations:
✅ Support Zone:
Around $2,470 - $2,500 (highlighted with orange boxes).
Price consistently tests and respects this area multiple times, indicating strong demand.
✅ Resistance Levels:
First significant resistance: $2,710 - $2,720 (highlighted with blue lines).
Extended target: around $2,760.
✅ Recent Price Action:
Clear higher low formation at the support zone, suggesting potential reversal.
Previous swing highs are well marked (orange circles), hinting at potential resistance retests.
✅ Chart Patterns:
Double bottom / accumulation pattern forming at the highlighted support zone.
Strong bullish reaction expected on successful retest.
🎯 Trade Setup Idea:
Entry: Near $2,500 support zone.
Target: Initial take-profit zone around $2,720.
Extended Target: If momentum continues, $2,760 level.
Stop-Loss: Below $2,470, ideally near $2,450 for risk management.
📈 Technical Bias:
Bullish bias in the short term, driven by repeated support tests and signs of reversal.
Chart hints at breakout potential if price overcomes $2,720.
⚠️ Risk Management & Cautions:
Key risk: False breakouts below $2,470 could trigger bearish continuation.
Maintain a favorable risk-reward ratio (e.g., 1:2 or better).
Market volatility can increase rapidly; keep trade sizes appropriate.
🚀 Summary & Conclusion:
🔵 Bias: Bullish
🔵 Entry Zone: $2,470 - $2,500
🔵 Target Zones:
TP1: $2,720
TP2: $2,760
🔵 Stop-Loss: Below $2,450
🔵 Key Indicators: Structure break, price respecting support, bullish engulfing candle potential.

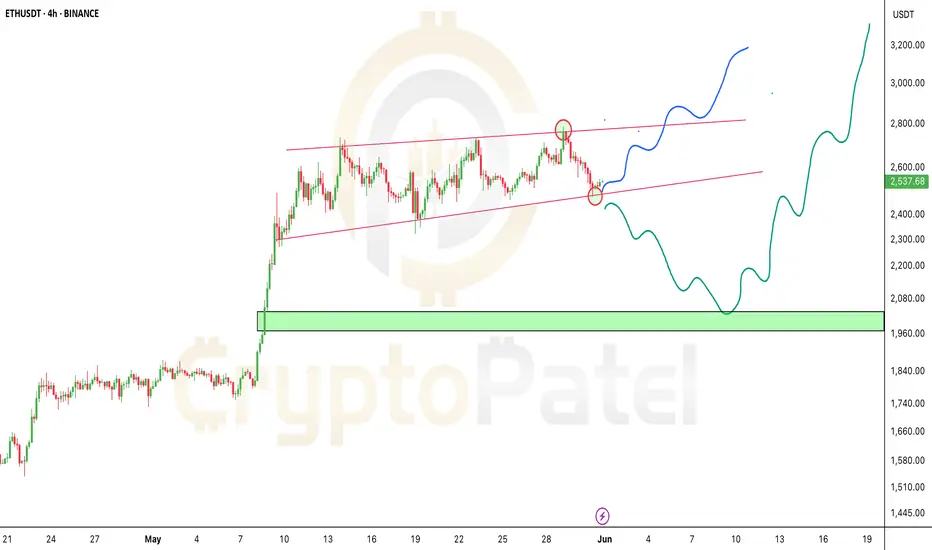
Ethereum Breakout UpdateETHEREUM AT A BREAKOUT POINT
CRYPTOCAP:ETH is sitting right on its key trendline support. What happens next could be BIG!
🔵 If support holds → $3,000+ is coming!
🔻 If it breaks → ETH could dip to $2,000 before the next pump!
This is the moment where patience meets opportunity.
Don’t chase — wait for the move and ride the wave!
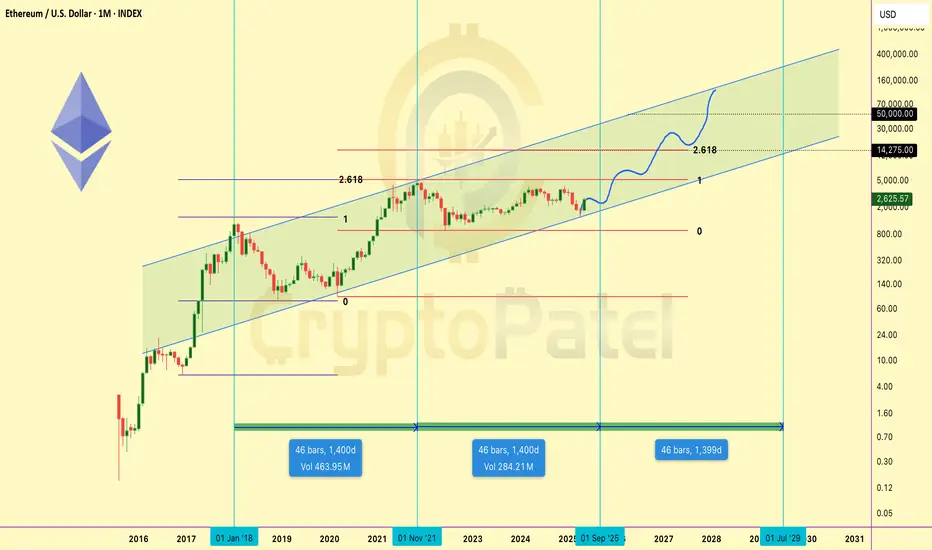
Ethereum Macro Chart Breakdown – Eyeing $10K+ Targets! Ethereum Macro Chart Breakdown – Eyeing $10K+ Targets!
Let’s zoom out and look at the bigger picture for CRYPTOCAP:ETH – this isn't just a pump; it’s a potential parabolic supercycle forming.
Technical Outlook:
Fractal Pattern Analysis
Ethereum is following a similar macro-structure to its 2017–2021 cycle, where after a long consolidation and accumulation phase, it exploded nearly 30x from bottom to top.
Current price action mirrors the post-2019 structure, and we’re at the same breakout stage right now.
Fibonacci Projections
Using the Fibonacci extension from the previous bear market low to the bull market top, and applying the same ratio from the 2022 bottom:
🔹 1.618 Fib = ~$10,000
🔹 2.618 Fib = ~$14,000
These targets align with Q4 2025–Q1 2026, based on previous cycle timings.
Structural Support
ETH is now trading above its 100-week EMA and holding bullish structure on higher timeframes. Previous resistance at $2,500 has flipped into strong support.
Momentum & Fundamentals
🔹 Layer 2 scaling is booming (Arbitrum, Base, zkSync)
🔹 Institutional ETH ETFs are launching
🔹 ETH powers Web3, DeFi, AI infra, RWAs, and more
🔹 Ultra-sound money supply dynamics + staking yield
🔹 Ecosystem growth is organic and robust
Projected Targets:
🎯 Short/Mid-Term (Q4 2025): $10,000 – $14,000
🚀 Ultra Long-Term (2029–2030): $40,000 – $50,000
If you still believe ETH is “just another altcoin,” you’re missing the bigger picture. Ethereum isn’t a meme — it’s the backbone of digital value, smart contracts, and future finance.
I’m long and accumulating ETH on dips. This isn’t just a trade — it’s a conviction play.
🗨️ Drop your ETH target in the comments 👇
🔁 Share this with someone sleeping on ETH!
Note: This is NFA So DYOR
Big Triangle Forming on $NEAR — Massive Breakout Ahead!Big Triangle Forming on CBOE:NEAR — Massive Breakout Ahead!
CBOE:NEAR is showing strong bullish structure on the HTF – it's forming a large symmetrical triangle pattern, which often signals an explosive breakout move.
Technical Analysis Overview:
▶️ Best Accumulation Zone: $2.90 – $2.10
▶️ Targets: $5 / $10 / $20 / $30 / $50
▶️ Invalidation Below: $1.80
Once we break out of this triangle, the upside move could be massive.
Why I’m Bullish on NEAR:
✅ AI + Blockchain = Future – NEAR is already delivering real AI tools & apps
✅ User & Dev Growth – Ecosystem expanding fast
✅ Modular Infrastructure – Becoming the base layer for multichain apps like Celestia
✅ FastAuth + BOS – Easy Web2-like onboarding + AI-native UX
✅ Backed by Big Players – a16z, Circle, Tiger Global all invested
In the last cycle, CBOE:NEAR did 38x with just hype.
This cycle? It has the tech, adoption, and perfect timing.
Don’t sleep on $NEAR. It’s not hype — it’s building the future.
Note: NFA & DYOR

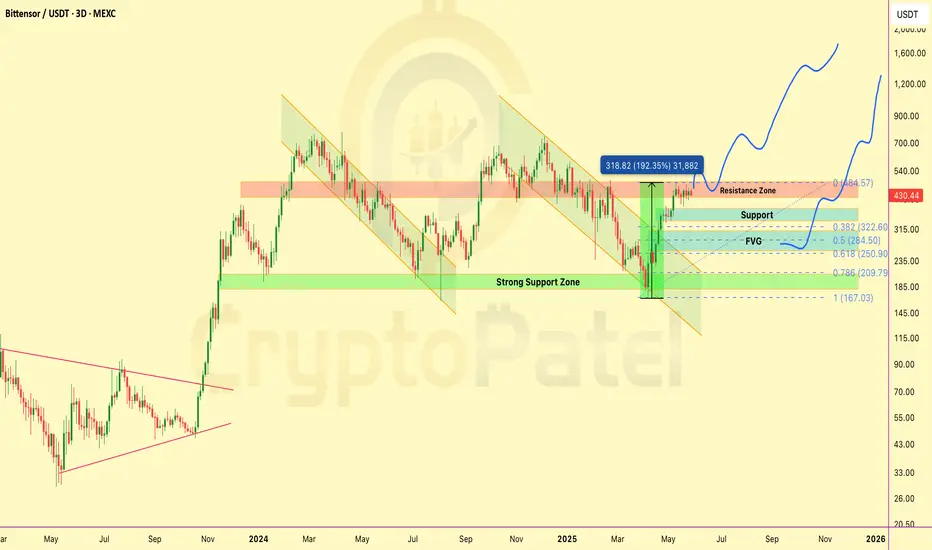
This AI Coin Could Go to $3,000 — But First, It Might Fall 50%!LSE:TAO Technical Analysis – Altseason AI Gem Update
LSE:TAO has been one of the most bullish AI coins this cycle — pumping over 200% in just 2 months without any major pullback. But now, things are getting interesting.
Current Price Action:
▶️ Trading near strong resistance at $480
▶️ Holding steady above $400 support zone
▶️ A breakout above $500 could open the gates to $1,000 → $2,000+ in this bull run!
Retracement Watch:
▶️ After such a strong rally, a correction is likely
▶️ Expecting 0.5 Fib retracement → $284 (–35% drop)
▶️ In worst-case scenario: 0.618–0.786 Fib → $250–$230 (–50% drop)
Accumulation Zone:
$200–$250 is the golden pocket for high-reward entries. Best zone to accumulate before the next leg up.
Target Levels for This Bull Run: $500 → $1,000 → $1,500 → $2,000 → $3,000
Chart Invalidation: If price breaks below $200, this bullish outlook gets invalidated.
Stay patient. Big dips bring big opportunities.
ALTCOIN SEASON LOADING🚨 ALTCOIN SEASON LOADING...
The ETH/BTC pair just gave a major bullish signal
✅ Up 45% in 1 month
✅ Reclaiming strength after long consolidation
✅ Leading the way for ALTCOINS to fly
This is not just bullish for Ethereum — it's even more bullish for other altcoins 👇
Short-term Retracement Expected:
I'm watching 0.022–0.020 BTC as a key accumulation zone on ETH/BTC
That’s the area where smart money will reload before the next leg up.
My Bull Run Target: 0.08 BTC per ETH
If we hit that, it’s time to start rotating profits from ETH into other alts.
Altseason isn’t coming...
It’s already warming up.

ETH Consolidation ETH in a massive consolidation zone rigjt now.
We never broke wick high we got close and rejected. If btc pushes past ath and eth moves again this would be the third test and a massive squeeze.
Not trading this range right now until confirmations but keep an eye on that wick for now

When Altcoins Bounce From 99% Down... They Don’t Just Recover, When Altcoins Bounce From 99% Down... They Don’t Just Recover, They Moon
Structure Analysis:
SEED_DONKEYDAN_MARKET_CAP:ILV has been in a multi-year downtrend but is now showing signs of a potential macro reversal.
Accumulation Zone:
Price has been consolidating between $9.63 – $13.75, forming a strong base. Multiple rejections from this zone suggest heavy demand and smart money accumulation.
Downtrend Break Incoming:
A breakout above the descending resistance trendline would confirm a trend reversal and open the gates for a major rally.
Key Resistance Levels Ahead: $71.32/$185.56/$322.15/$672.19 (Previous ATH)
Major Resistance Zone: $31.74 – $37 (expect some sell pressure here on the way up)
Trade Setup Idea (Mid to Long Term):
Entry Range: $11 – $14
Stop Loss: $9.63
Target: $31.74/$71.32/$185.56/$322.15/$672.19
Potential Gains:
▶️ 10x looks highly possible if momentum builds.
▶️ If ILV reclaims its previous ATH, returns could reach up to 180x
▶️ Already down ~99.5% from ATH — this makes it a high-risk, high-reward setup.
Yes, 180x sounds insane, and it nearly is—but this is crypto. Anything can happen. That said, high reward comes with high risk. Always DYOR (Do Your Own Research), manage your risk, and remember: This is not financial advice.

ETHEREUM MEGA CYCLE ALERT🚨 ETHEREUM MEGA CYCLE ALERT 🚨
CRYPTOCAP:ETH just bounced from the same support zone that sparked its last bull run 🔥
This could be the start of Wave 5 — and if history repeats…
🎯 Target: $10,000 ETH
Last time this pattern showed up? ETH went 10x.
Don’t fade the chart.
👉 Like & Retweet if you’re riding this wave
👇 Tag a friend who’s still sleeping on ETH!

BTCUSD IN SKY !!!!!!!!!!!!When the BTC was at 65k this needs to take a rebound and that is till 18500
Now just bought it and hold your socks
Put Target 100000
Date : 23rd June 2024 !!
BUY ALL CRYPTO NOW !!!!!!!!!

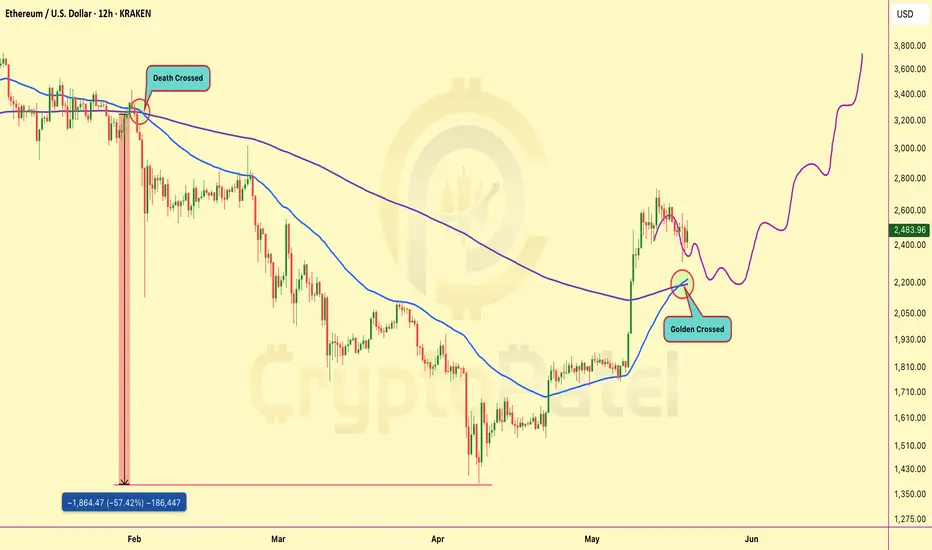
Ethereum Golden Crossed so What Next? $5000?🚨 CHART ALERT: CRYPTOCAP:ETH just flashed a GOLDEN CROSS on the 12H after months of bleeding!
Last time we saw a DEATH CROSS, #Ethereum crashed -57%.
Now it's doing the opposite — this could be the start of a massive pump! 🚀
TARGET? Maybe $3,800-$5000+ soon! 📈
ETHEREUM | Technical Analysis 20th May 2025Hi,
I am sharing my daily view on ethereum for 20th May, 2025.
If you like my analysis then please share and like this post.
Disclaimer: This is only for educational purpose.
Thanks.
Ethereum - Technical Analysis Overview week of May 19–25, 2025Predicting Ethereum's (ETH) price movement for the week of May 19–25, 2025, involves analysing recent technical indicators, market sentiment, and external factors. Below is a concise technical analysis based on available data, focusing on key indicators and potential price trends. Note that cryptocurrency markets are highly volatile, and this analysis is not financial advice—always conduct your own research.
#Technical Analysis Overview
Current Price (as of May 17, 2025): Approximately $2,550, at the time of posting
Market Sentiment: Neutral to bullish, with mixed signals from technical indicators and a Fear & Greed Index.
Recent Performance: ETH has risen 29.61% over the past week and 16.61% over the past month, showing strong short-term momentum but facing potential resistance at 2,750 - 3,050
#Volume and Volatility:
Recent trading volume has surged (from $22.02B to $42.95B daily), indicating strong market interest.
Volatility remains high (17.61% over the past 30 days), suggesting potential for sharp price swings.
For support and resistance please refer the chart

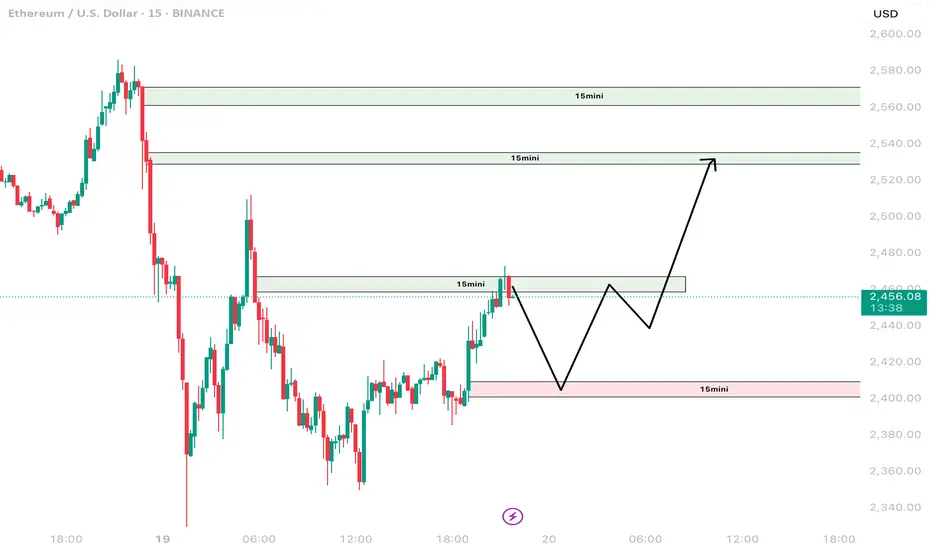
ETHUSD LONG WITH MORE THAN 1:2 RRHello traders, I'm bit late posting this Idea trade is already active, after consolidating in tight range in 1h time frame ETHUSD give break out on the upside we will try to capture reversal trade here.
LONG ETHUSD @2510 WITH
SL:-2450-2460 ZONE
TP:- 2600-2620 ZONE
HAVE A GREAT WEEKEND.

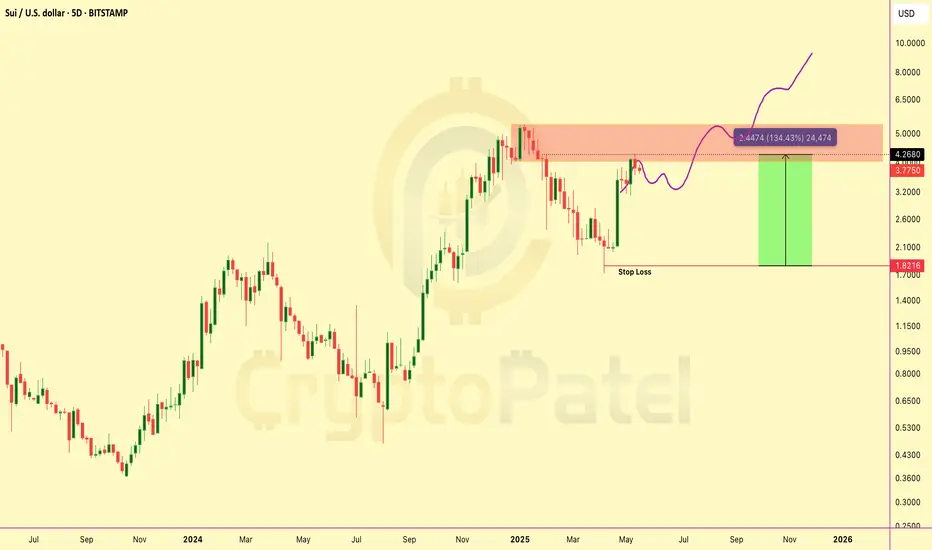
$SUI 130% up from our Entry and What Next?CRYPTOCAP:SUI pumped 130% from our entry around $2 — now hitting $4.29! Bottom perfectly caught.
Expecting a healthy pullback to ~$3 before next leg higher — that zone is ideal for fresh entries.
Long-term targets: $5/$10/$15/$20
#SUI #Altcoins
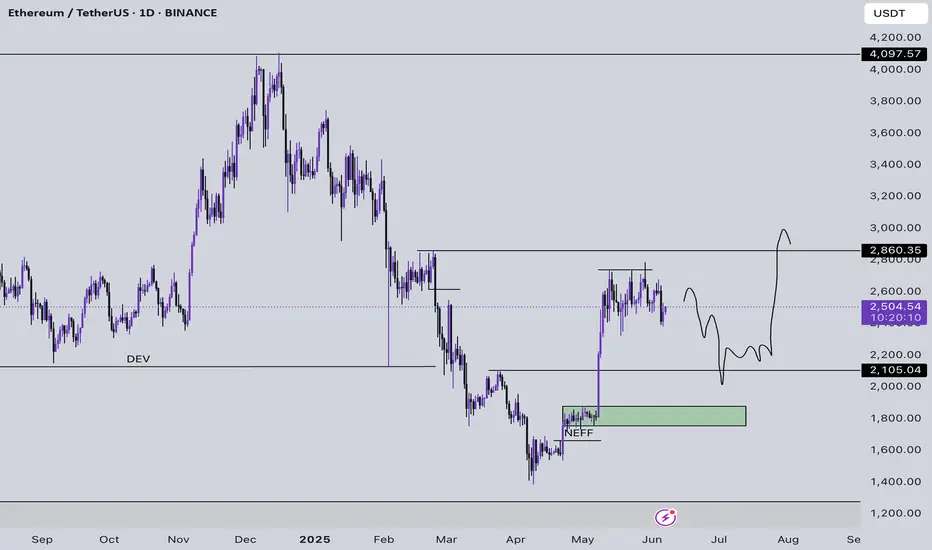
$ETH Pullback Loading: Is $1,800 the Next Big Buy Zone?Ethereum (ETH/USDT) Technical Outlook – Dip Analysis
After a strong bullish impulse breaking the downtrend, ETH is now entering a corrective phase.
Key Observation: Price has filled a major FVG (Fair Value Gap) near $2,500 and is showing signs of rejection.
🔻 Short-Term Bias: Bearish Retracement
We anticipate a pullback into the lower FVG zone between $1,854–$2,186, aligning with the +OB (Order Block) at ~$1,854-$1790 — a strong demand zone.
🟩 Buyers may step in here, making it a potential accumulation zone before the next leg up.
If this zone holds, ETH could resume its uptrend targeting the upper OB/FVG zone near $3,400–$3,600.
Strategy: Watch for bullish confirmation in the $1,800–$2,000 zone for potential long setups.
