Will it rhyme again?What do you think would happen?
This indicator is provided for educational and informational purposes only.
It does not constitute financial advice, investment recommendations, or trade signals.
The creator and Systematic Traders Club are not responsible for any financial losses resulting from the use of this indicator.
Trading and investing involve risk. Always do your own analysis and use proper risk management.
Ethforecast

#ETH/USD Buy Trade Setup.Here’s an up-to-date ETH/USD Buy trade outlook (technical + fundamental) to help you assess whether positioning for a Upside makes sense right now.
Thank You......

#ETH one final hope?
One last hope for a bounce back.
If the price fails to break and hold above $3050, then we may see a downside move. The direction is still not clear.
Disclaimer:
This idea is provided for educational and informational purposes only.
It does not constitute financial advice, investment recommendations, or trade signals.
The creator and Systematic Traders Club are not responsible for any financial losses resulting from the use of this indicator.
Trading and investing involve risk. Always do your own analysis and use proper risk management.

#ETH Just a pullback before the run!DELTAIN:ETHUSD.P
Just a pullback before the big run. The trend is bullish until it hold this.
Are you in the game already?
I'll update if the momentum changes.

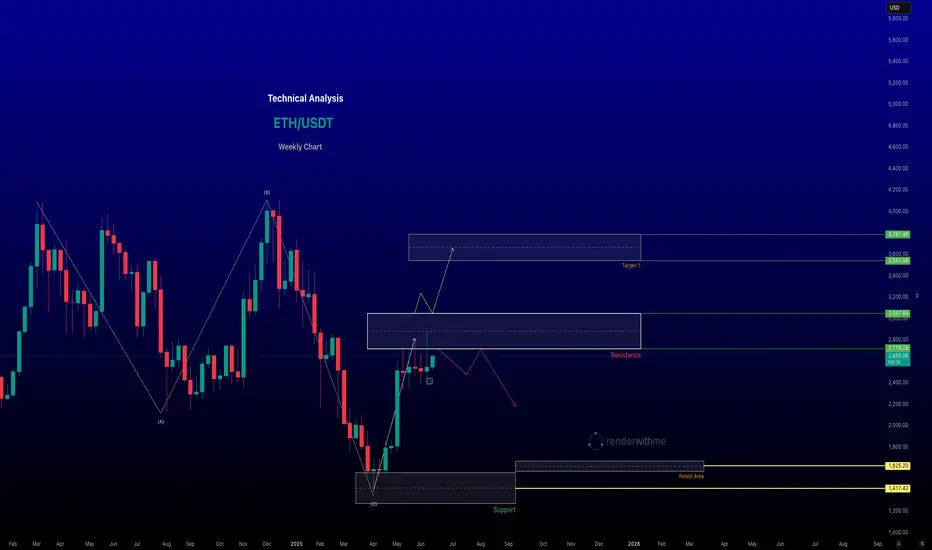
"ETH/USDT Forecast""ETH/USDT Forecast"
The market shows evidence of strong participation earlier, where price moved with speed and consistency, reflecting clear intent. That phase established direction and control without prolonged hesitation.
As price progressed, momentum began to ease. Movement slowed, reactions became more frequent, and volatility compressed. This change indicates a shift from active pressure to evaluation, where participants reduced aggression and allowed price to stabilize.
The subsequent recovery unfolded in a measured and uneven manner. Advances were short, overlapping, and lacked continuation, suggesting limited commitment behind higher prices. Opposing flow remained active, preventing expansion.
Currently, price behavior is defined by balance and compression. Activity reflects positioning rather than resolution. Until behavior shifts from overlap to decisive movement, the market remains in a waiting state, with continuation favored once imbalance returns.

ETHUSD – Pure Price Action Analysis ETHUSD – Pure Price Action Analysis (Buy | Sell | TP | SL | No-Trade Zone)
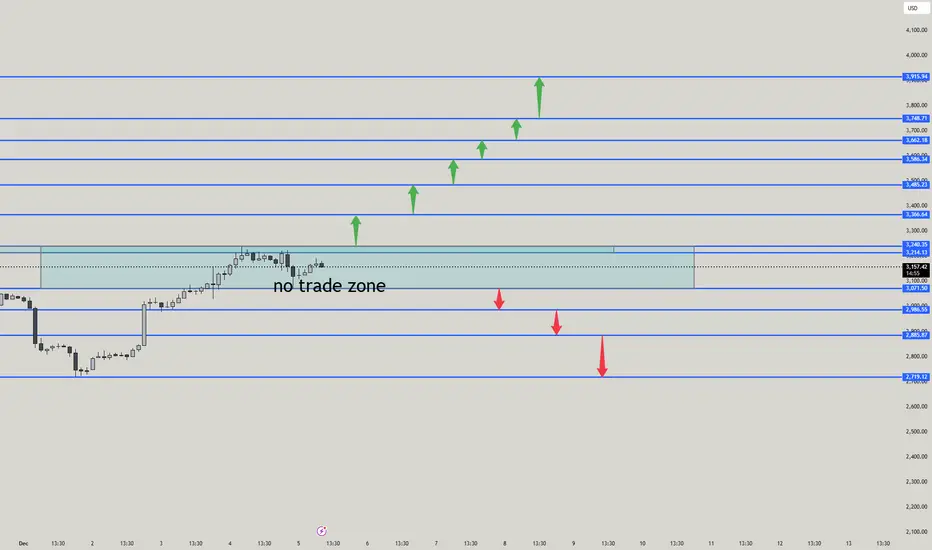
🚫 NO-TRADE ZONE (Ranging / Indecision Area)
The shaded box between $3,140 – $3,245 is your no-trade zone.
Reason:
Market is consolidating
No strong direction
Liquidity building
Smart money accumulation area
👉 Inside this box = avoid entries.
Wait for breakout + retest.
✅ BUY SETUP (Breakout → Retest → Long)
Buy Entry Levels
1️⃣ Buy above $3,245 (clean breakout & retest)
2️⃣ Safer buy above $3,290 (strong momentum zone)
Buy-Side Targets (TP)
🎯 TP1 → $3,366
🎯 TP2 → $3,428
🎯 TP3 → $3,502
🎯 TP4 → $3,602
🎯 TP5 → $3,748
🎯 TP6 → $3,915 (high probability supply zone)
STOP LOSS for Buy
🛑 SL → Below breakout candle
Safer → Below $3,200
❌ SELL SETUP (Breakdown → Retest → Short)
Sell Entry Levels
1️⃣ Sell below $3,100
2️⃣ Aggressive sells at each retest shown by red arrows.
Sell-Side Targets (TP)
🎯 TP1 → $2,986
🎯 TP2 → $2,885
🎯 TP3 → $2,719 (major demand zone)
STOP LOSS for Sell
🛑 SL → Above the retest candle
Safer → Above $3,140
🔥 BEST HEADING FOR THIS ANALYSIS
ETHUSD – Breakout Trading Plan | Buy–Sell Zones | TP–SL | No-Trade Zone
📌 SUMMARY (Very Clear)
🚫 No-Trade Zone:
$3,140 – $3,245
✅ Buy only if price breaks → retests → holds above $3,245
TP → 3,366 / 3,428 / 3,502 / 3,602 / 3,748 / 3,915
SL → Below 3,200
❌ Sell only if price breaks → retests → fails below $3,100
TP → 2,986 / 2,885 / 2,719
SL → Above 3,140
ETH Eyes Upside RunEthereum shows signs of regaining strength after a prolonged corrective phase. The asset is currently stabilizing, supported by gradual inflows from institutional participants and renewed investor accumulation. Market behavior indicates controlled volatility, suggesting a preparation phase before a potential expansion.
Network data reflects consistent transaction activity, while liquidity concentration hints at sustained participation from long-term holders. The recent stabilization in funding rates and improved open interest add weight to the recovery outlook.
If momentum continues to build under these conditions, Ethereum could enter a structured growth cycle in the coming sessions.
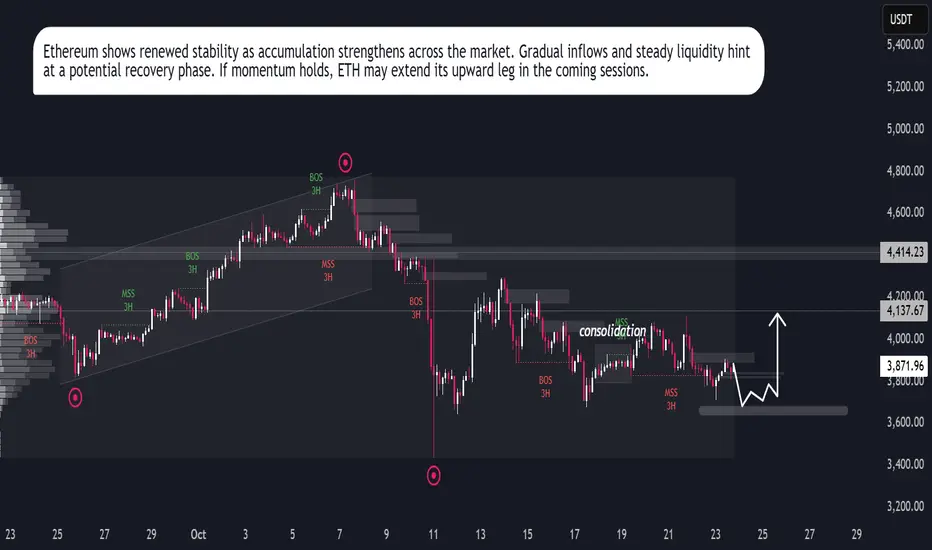
Ethereum Accumulation Before BreakoutEthereum has regained bullish momentum after a recent correction phase, supported by improving sentiment in the broader crypto market. The asset is displaying early signs of stabilization as traders begin accumulating around value zones, indicating renewed confidence among market participants.
From a macro perspective, Ethereum continues to benefit from increasing network activity, particularly within the DeFi and Layer-2 ecosystems. The sustained growth in on-chain transactions and staking participation reflects long-term investor interest, adding strength to the current recovery phase.
Market data also shows that institutional inflows into major crypto assets are on the rise, with Ethereum standing out due to its strong fundamentals and ecosystem resilience. This inflow supports the likelihood of a continued price rebound, as liquidity and trading volume remain consistent.
Overall, ETHUSDT is showing a constructive recovery setup. The combination of improving sentiment, strong fundamentals, and gradual accumulation suggests a potential medium-term bullish continuation, provided global market conditions remain favorable.

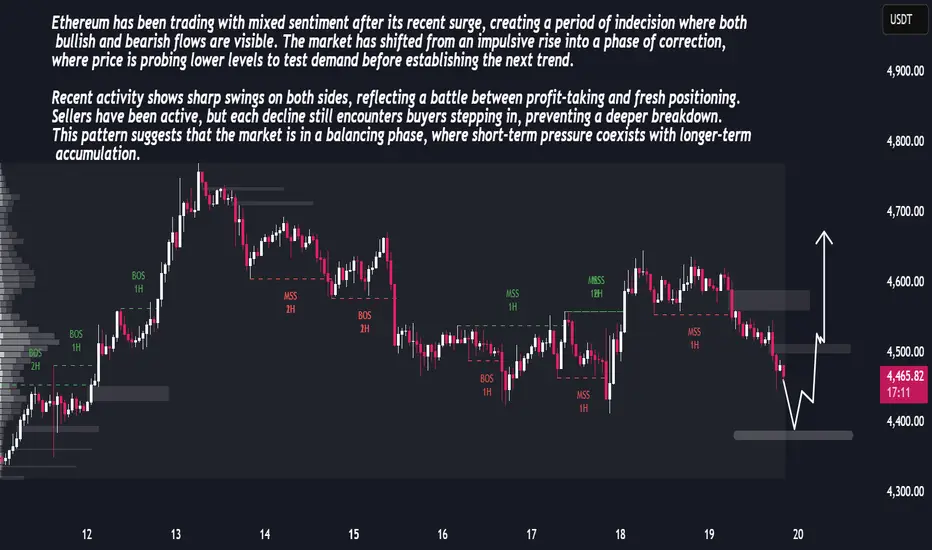
ETH Price Outlook – Consolidation Phase Before ExpansionETH Price Outlook – Consolidation Phase Before Expansion
Ethereum has been trading with mixed sentiment after its recent surge, creating a period of indecision where both bullish and bearish flows are visible. The market has shifted from an impulsive rise into a phase of correction, where price is probing lower levels to test demand before establishing the next trend.
Recent activity shows sharp swings on both sides, reflecting a battle between profit-taking and fresh positioning. Sellers have been active, but each decline still encounters buyers stepping in, preventing a deeper breakdown. This pattern suggests that the market is in a balancing phase, where short-term pressure coexists with longer-term accumulation.
The overall structure points toward a scenario where current weakness may serve as a preparation stage for another expansion move. Volatility is likely to remain elevated, and once liquidity pockets are cleared, momentum could shift more decisively, paving the way for stronger directional movement.
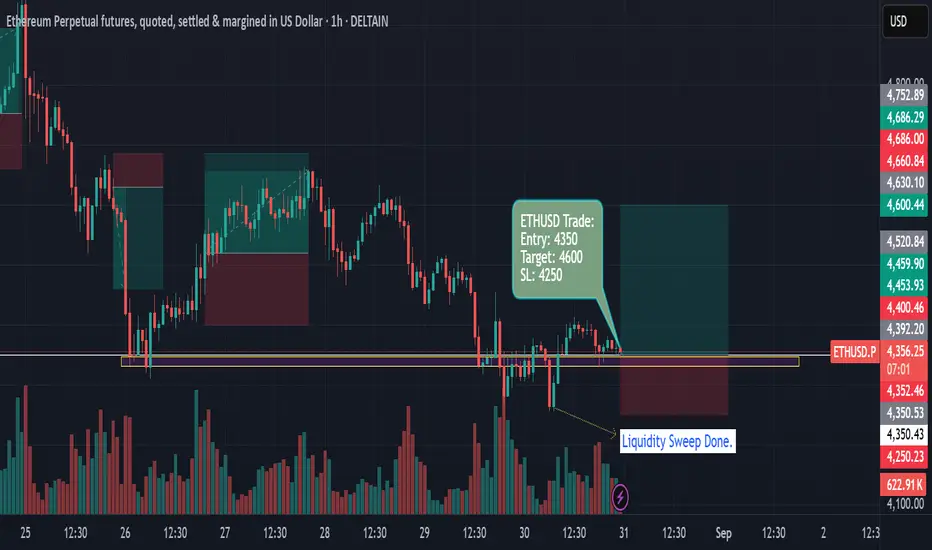
ETHUSD 1H — Liquidity Sweep Reversal with Precision EntryTrade Summary
• Entry: $4,350
• Target: $4,600
• Stop Loss: $4,250
• Risk/Reward Ratio: 2.5:1
After a significant liquidity sweep just below $4,350, Ethereum Perpetual Futures have reclaimed support and established a potential reversal base. The trade enters at $4,350, with a tight stop loss at $4,250, banking on the exhaustion of sellers and fresh momentum above reclaimed support. The target is $4,600, right before a major resistance cluster and previous swing high, offering clarity on profit-taking and risk parameters.
Recent price action signals a shift from bearish momentum to consolidation, as aggressive buyers absorbed supply during the liquidity sweep — a signature move that often precedes sustained rallies. The setup features:
• Clear horizontal support with visible volume confirmation
• Precise entry post-sweep for maximum risk efficiency
• Stop loss positioned below the sweep zone for strict invalidation
• Well-defined target near a high liquidity supply area
Why I like it: Excellent risk management, technical clusters, and early signs of trend reversal. Would love feedback from the community on additional confluence factors or alternate views!
ETHUSD | Technical Analysis 25/08/2025Hi,
ETH can form inverted head and should and go upside upto 5100+. Time period can be 4 to 5 days.
Disclaimer: This is only for educational purpose.
Thanks

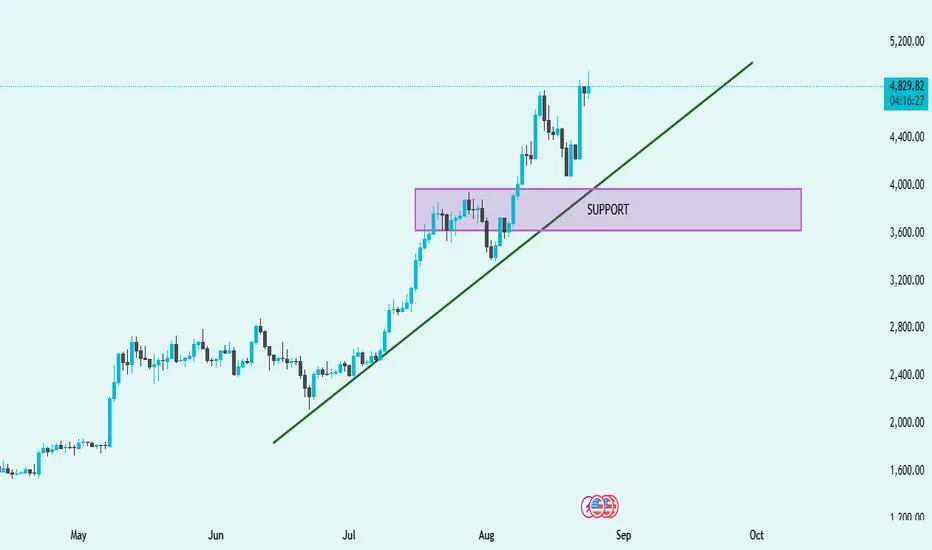
ETH/USD Technical Analysis – Strong Uptrend with Key Support📈 ETH/USD Technical Analysis – Strong Uptrend with Key Support
Trend Direction ➡️
The chart shows a clear bullish trend supported by an upward sloping trendline (green). Price action is consistently forming higher highs and higher lows, confirming strong upward momentum.
Support Zone 🟪
The highlighted support area (3,600 – 4,000) has been tested successfully. Price bounced strongly from this zone, showing buyers are actively defending this level.
Breakout & Momentum 🚀
After retesting support, ETH broke above the recent consolidation and is now trading around 4,843, pushing towards new highs. This signals bullish continuation if volume supports the move.
Trendline Confirmation 📐
The trendline has acted as a dynamic support multiple times. As long as ETH trades above it, the bullish trend remains intact.
Outlook 🔮
If ETH stays above 4,800, the next potential target could be 5,200+.
If price breaks below the trendline and the 3,600 support zone, bearish correction may begin.
✅ Summary: ETH is in a strong bullish trend 🚀, supported by both the trendline and key support zone. Short-term outlook remains bullish as long as 4,800 holds.
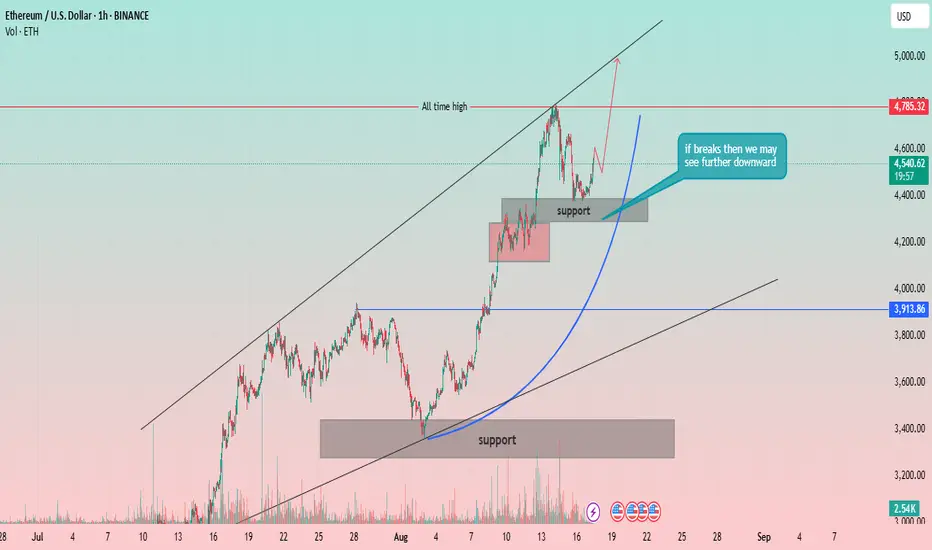
Ethereum (ETH) 1H Chart: Re-testing the All-Time High?Strong Uptrend Channel: The price of Ethereum has been moving within a well-defined ascending channel, indicated by two parallel black trendlines. This strong channel suggests a sustained bullish momentum.
All-Time High: A significant resistance level is marked as the "all-time high" at approximately 4,785.32 USD. The price has recently tested this level.
Support Levels:
Major Support Zone: A broad support zone is identified between approximately 3,300 USD and 3,450 USD. This zone has previously acted as a strong base for a price rally.
Recent Support Zone: A smaller, more recent support zone is marked around 4,200 USD. The price has consolidated within this area after its recent push towards the all-time high.
Price Action and Projections:
The price recently reached a peak near the all-time high and has since pulled back, consolidating within the recent support zone.
A key annotation states, "if breaks then we may see further downward." This highlights the importance of the 4,200 USD support zone. A break below this level could indicate a potential deeper retracement, possibly towards the lower trendline of the channel or the major support zone.
A parabolic arc is drawn (blue line), suggesting a potential trajectory for the price to continue its move higher from the current level, with a goal of re-testing or breaking the all-time high.
Volume: The chart includes a volume indicator, showing significant volume spikes during the major rallies and drops, confirming strong market interest and participation.
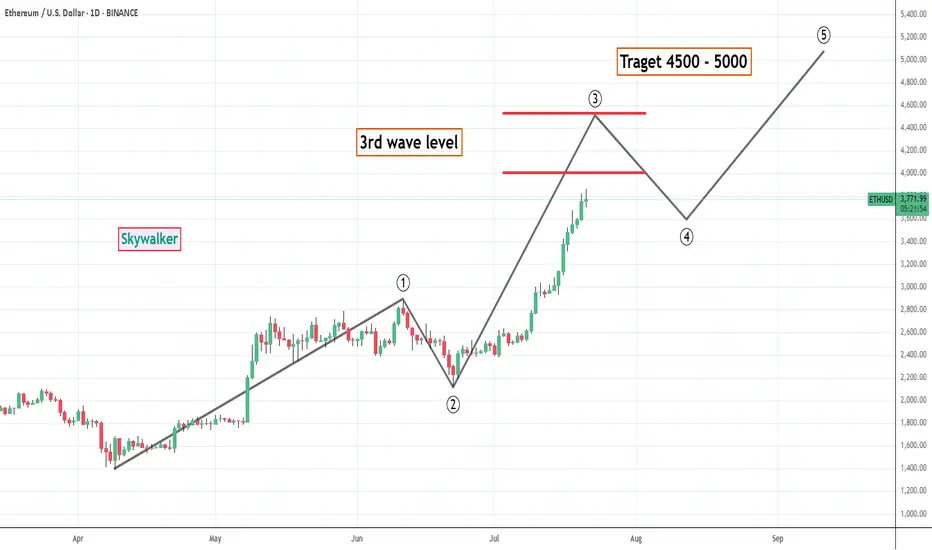
ETH - Target 4500 to 5000 as per wave theoryETH is showing movement as per wave theory so forecasting end of this bull run or possibility of correction can be arrived. clearly eth is in 3rd wave which could end anywhere at the redlines drawn in chart and based on which wave 4 and 5 can be approximately arrived at. what ever be the 3rd wave level ETH is sure to touch 4500 before showing bigger correction. And i think 5000 is also possible easily. For now holding bigger or decent qty long in ETH is suggested with proper money management.
Ethereum Technical Analysis for the Week of June 16-June 231. Price Overview
Current Price: As of June 16, 2025, Ethereum's price is approximately $2,610.36 USD, with a 24-hour trading volume of $16.83 billion USD. It is up 2.59% in the last 24 hours.
Market Cap: Ethereum holds the #2 rank with a live market cap of $315.13 billion USD. Circulating supply is 120.72 million ETH.
Recent Performance:
Over the last 7 days, ETH has risen by 20%, showing strong upward momentum.
In the past month, ETH increased by 16.61%, adding an average of $624.97 to its value.
ETH has underperformed compared to Bitcoin in 2025 but shows signs of recovery with institutional interest growing.
# Support and Resistance Levels:
Support: Key support is around $2,160–$2,020
Resistance: Immediate resistance lies between $2,739–$2,850. A breakout above $2,800–$3,000 could target $3,400–$4,100.
-- Disclaimer --
This analysis is based on recent technical data and market sentiment from web sources. It is for informational purposes only and not financial advice. Trading involves high risks, and past performance does not guarantee future results. Always conduct your own research or consult a SEBI-registered advisor before trading.
#Boost and comment will be highly appreciated
Ethereum Technical Analysis for the Week of June 08-June 14~~ Technical Analysis~~
Current Price and Market Overview
Price: As of June 8, 2025, Ethereum (ETH) is trading at approximately $2,515.45 USD, with a 24-hour trading volume of ~$11.45 billion and a market cap of ~$303.67 billion. It has risen by 1.64% in the last 24 hours.
Recent Performance:
Weekly: Down -2.77%, indicating short-term consolidation or profit-taking.
Monthly: Up 43.31%, reflecting strong bullish momentum over the past month.
Yearly: Down -32.01%, suggesting longer-term challenges compared to its all-time highs.
Market Rank: Ethereum remains the #2 cryptocurrency by market capitalisation, behind Bitcoin.
-- Disclaimer --
This analysis is based on recent technical data and market sentiment from web sources. It is for informational and educational purposes only and not financial advice. Trading involves high risks, and past performance does not guarantee future results. Always conduct your own research or consult a SEBI-registered advisor before trading.
#Boost and comment will be highly appreciated

They saw a breakdown. I saw entry precision.ETH just did what it always does before a shift — it delivered into value.
Price rejected from 2,550 cleanly, took out weak buyers, and revisited the same HVN where prior accumulation began. That wasn’t a breakdown — it was completion.
I’m looking at the 2,488.11 zone — right at the 0.786 retracement — as the launchpad. It aligns with a low-volume tail, creating the exact imbalance Smart Money uses to reprice.
Above, I’m watching for a reversion to the mean at 2,511.9 (0.5), followed by a reaction at 2,532 — the last inefficient node before the supply wall at 2,550 gets filled again.
If we break through 2,550 clean, this becomes a much larger redistribution leg. But we trade it one delivery at a time.
Execution setup:
🎯 Entry: 2,488.11–2,474.0
🔑 Target 1: 2,511.9
🎯 Target 2: 2,550
❌ Invalidation: 2,474.0 clean break and continuation — wait for new structure
Nothing about this setup was noisy.
Just price completing its job.
I don’t chase the move. I meet it where it begins.

Ethereum - Technical Analysis Overview week of May 19–25, 2025Predicting Ethereum's (ETH) price movement for the week of May 19–25, 2025, involves analysing recent technical indicators, market sentiment, and external factors. Below is a concise technical analysis based on available data, focusing on key indicators and potential price trends. Note that cryptocurrency markets are highly volatile, and this analysis is not financial advice—always conduct your own research.
#Technical Analysis Overview
Current Price (as of May 17, 2025): Approximately $2,550, at the time of posting
Market Sentiment: Neutral to bullish, with mixed signals from technical indicators and a Fear & Greed Index.
Recent Performance: ETH has risen 29.61% over the past week and 16.61% over the past month, showing strong short-term momentum but facing potential resistance at 2,750 - 3,050
#Volume and Volatility:
Recent trading volume has surged (from $22.02B to $42.95B daily), indicating strong market interest.
Volatility remains high (17.61% over the past 30 days), suggesting potential for sharp price swings.
For support and resistance please refer the chart

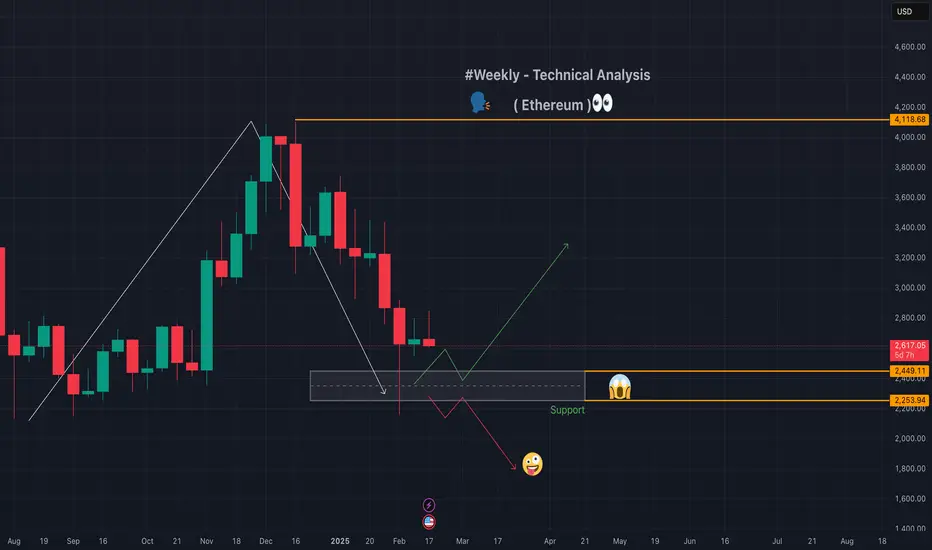
Ethereum - Technical - Weekly❣️#Ethereum has been experiencing a downward trend with lower highs and lower lows, suggesting a bearish outlook in the short term. However, there are signs of a potential sideways movement in the very short term.
sharing a 📉chart for your reference so any body can learn and make decision.💟
Ethereum TechnicalEthereum has been pivotal in the blockchain space, not just for its cryptocurrency but for its platform capabilities. Its evolution continues to be watched closely by both enthusiasts and skeptics, given its impact on blockchain technology and decentralized systems. I
chart for your reference

#ETH/USDT 4HOUR UPDATE !!Hello dear traders, we here new so we ask you to support our ideas with your LIKE and COMMENT, also be free to ask any question in the comments, and we will try to answer for all, thank you, guys.
ETH/USDT UPDATE!
$ETH is currently trading at $1560
I am expecting some bounce from here.
But Bullish is only above the $1460 Level.
As per TrendLine, This is the Retest level after Breakout.
So $1400 Support level is very important for the Bullish scenario.
First Horizontal Resistance is $1700 so This will be the first Target of Long Setup if Hold $1450
At the $1400 level also 21 Days of EMA resistance so This Point will be very important.
If we break the $1400 Level then we can see another 50% From the $1340 Level.
And Target will be $1750
I am Bearish below $1300 only.
Remember:-This is not a piece of financial advice. All investment made by me is at my own risk and I am held responsible for my own profit and losses. So, do your own research before investing in this trade.
Thanks for your time, we hope our work is good for you, and you are satisfied, we wish you a good day and big profits.
THANK YOU.

ETH, Greatest invention of our time. "Hopium Chart"Pay close attention to what the chart has been doing .
Cut the noise and do what you have to do ,incase this plays out..
Clear invalidation below 1700s .
Good luck .

