ETH/USD Daily — Support Bounce Setup in a Strong Downtrend
Chart Analysis:
Market Structure:
ETH is clearly in a bearish trend on the daily timeframe. Lower highs and lower lows are intact after a sharp rejection from the major supply zone around 3,300–3,400 (yellow zone).
Impulsive Sell-Off:
The recent move down is strong and aggressive, suggesting capitulation-style selling rather than a slow grind. This often precedes at least a technical relief bounce.
Key Support Zone (Red): ~1,900–2,000
Price has tapped into a well-defined demand/support area, where buyers previously stepped in. The long lower wicks here hint at buying interest and absorption.
Proposed Entry:
The marked entry is based on a support reaction, not a trend reversal. This is a counter-trend long, so it’s tactical, not positional.
Target Zone (Green): ~2,450–2,550
This zone aligns with:
Prior structure support → resistance flip
Likely liquidity resting above
Mean reversion after an extended drop
Bias & Expectations:
Short-term: Bullish relief bounce toward the green zone
Medium-term: Still bearish unless ETH reclaims and holds above ~2,600–2,700
Expect high volatility—clean V-shaped recoveries are rare in this context
Risk Note:
If price loses the 1,900 support decisively, the setup is invalidated and opens the door for continuation toward lower psychological levels.
📌 Summary:
This chart shows a high-risk, counter-trend bounce play off major daily support, targeting a logical resistance zone above. Good for disciplined traders, not for blind bottom-catching.
Ethlong

BTCUSDT LONG Trade Of The YEARLonging BTC here for a swing isn’t a bad idea.
TP: ~100k
SL: 78k
BTC is underperforming GOLD and Retail is FOMO’ing into gold & traditional assets.
Narrative shifting to crypto is dead this cycle
Fear & Greed shows crypto traders are scared.
that’s exactly the signal.
that’s when smart money steps in.
I’m taking the long.
— Ommeva

#ETH/USD Buy Trade Setup.Here’s an up-to-date ETH/USD Buy trade outlook (technical + fundamental) to help you assess whether positioning for a Upside makes sense right now.
Thank You......

#ETH Just a pullback before the run!DELTAIN:ETHUSD.P
Just a pullback before the big run. The trend is bullish until it hold this.
Are you in the game already?
I'll update if the momentum changes.

#ETH.P Guns loaded and ready for the big battleThe ETH is turning around after a good consolidation zone. After erasing the 2025 gain, the ETH is not set for running the next major cycle with the support from the whales. This cycle will be huge for ETH. Are you in the game already?
Disclaimer:
It does not constitute financial advice, investment recommendations, or trade signals.
The creator and Systematic Traders Club are not responsible for any financial losses resulting from the use of this indicator.
Trading and investing involve risk. Always do your own analysis and use proper risk management.


ETH Looks Bullish .Why No one is talking about this? What is see : strong 💪 breakout . Better to enter on retest.

ETHUSD - Are Bears Ready for the Fall?ETHUSD on the 4H timeframe is clearly in a corrective downtrend, not a healthy bullish structure. The price action fits an Elliott Wave decline where wave 3 already completed near 2620 , followed by a weak and overlapping recovery that looks like wave 4. That recovery stayed inside a falling channel and never showed impulsive strength, which already tells you buyers are weak. More importantly, wave 4 is flirting with wave 1 territory, which puts the entire bullish hope on thin ice.
Right now, ETH is at a make or break zone. If this move is just a fake breakdown, price must quickly reclaim the channel and hold above recent highs. If not, then this is likely wave 5 of C, and downside continuation becomes the dominant scenario. The structure favors a final flush toward the 2380 to 2350 area, where wave 5 projection and channel support align. Anyone blindly bullish here is ignoring structure. This is not a buy the dip market, it is a wait for confirmation or respect the downtrend market.

ETH Possible scalping opportunity On this trend line, M15 if we see any Bullish Signal, we can cover quick upside Scalp. Keep an eye 👁

ethereum longs activated im in long manage your riskim in eth longs from this level of entry and long targets risk your capital that ytou can lose and make profits as your levels its just a trade idea thats it

Ethereum longs activated into targets buying position Ethereum buying becuase of mid week support to the new high of eth so stay tunes and risk little portion on this trade only 1-2% risk of capital okay done

ETH 1H Outlook: Key Support Retest With Potential Downside RiskKey observations:
1. Support Level Under Pressure
ETH is retesting this support multiple times.
The annotation suggests: “SUPPORT IF BREAKS THEN WE CAN SEE MORE DOWNWORD” — meaning a breakdown could trigger further selling.
2. Downside Targets
If the current support fails, the next liquidity zones highlighted are:
FVG (Fair Value Gap) around $2,950–$2,900
Extreme POI zone around $2,880–$2,850
Major support at $2,787 (marked as “next support”).
3. Upside Scenario
If support holds, ETH could bounce toward:
$3,078
$3,134
High resistance around $3,225
4. Market Structure
Several CHoCH and BOS labels indicate mixed structure, showing recent weakness but with potential for rebound if buyers defend support strongly.

long ETH now buys deep buy activatedim in buys for real account deep buys for good profits yes do it now

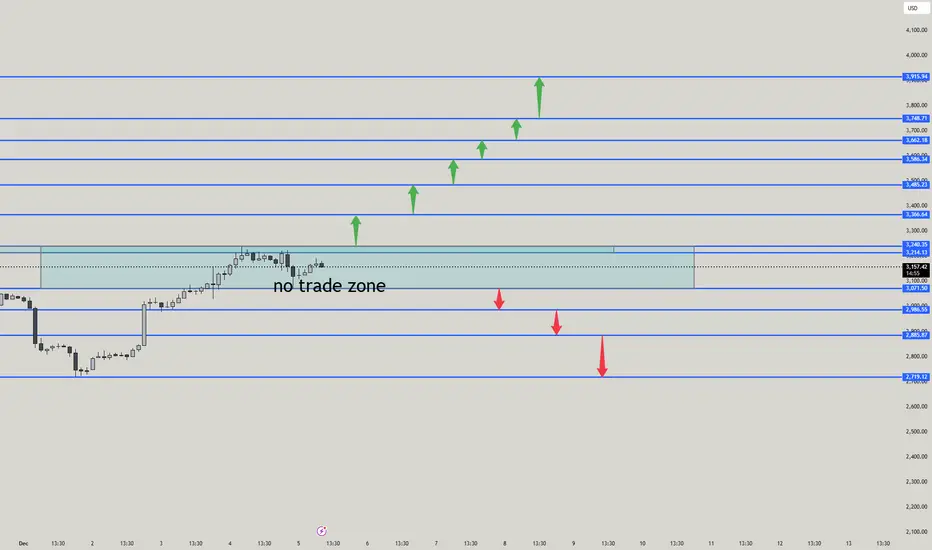
ETHUSD – Pure Price Action Analysis ETHUSD – Pure Price Action Analysis (Buy | Sell | TP | SL | No-Trade Zone)
🚫 NO-TRADE ZONE (Ranging / Indecision Area)
The shaded box between $3,140 – $3,245 is your no-trade zone.
Reason:
Market is consolidating
No strong direction
Liquidity building
Smart money accumulation area
👉 Inside this box = avoid entries.
Wait for breakout + retest.
✅ BUY SETUP (Breakout → Retest → Long)
Buy Entry Levels
1️⃣ Buy above $3,245 (clean breakout & retest)
2️⃣ Safer buy above $3,290 (strong momentum zone)
Buy-Side Targets (TP)
🎯 TP1 → $3,366
🎯 TP2 → $3,428
🎯 TP3 → $3,502
🎯 TP4 → $3,602
🎯 TP5 → $3,748
🎯 TP6 → $3,915 (high probability supply zone)
STOP LOSS for Buy
🛑 SL → Below breakout candle
Safer → Below $3,200
❌ SELL SETUP (Breakdown → Retest → Short)
Sell Entry Levels
1️⃣ Sell below $3,100
2️⃣ Aggressive sells at each retest shown by red arrows.
Sell-Side Targets (TP)
🎯 TP1 → $2,986
🎯 TP2 → $2,885
🎯 TP3 → $2,719 (major demand zone)
STOP LOSS for Sell
🛑 SL → Above the retest candle
Safer → Above $3,140
🔥 BEST HEADING FOR THIS ANALYSIS
ETHUSD – Breakout Trading Plan | Buy–Sell Zones | TP–SL | No-Trade Zone
📌 SUMMARY (Very Clear)
🚫 No-Trade Zone:
$3,140 – $3,245
✅ Buy only if price breaks → retests → holds above $3,245
TP → 3,366 / 3,428 / 3,502 / 3,602 / 3,748 / 3,915
SL → Below 3,200
❌ Sell only if price breaks → retests → fails below $3,100
TP → 2,986 / 2,885 / 2,719
SL → Above 3,140
ETHUSD Complete Price Action Roadmap (Buy, Sell, Pullback Zones)ETHUSD PRICE ACTION ANALYSIS
Current Market Condition
Price has created a Higher High (HH) directly inside a major supply zone around 3240–3260.
Strong impulse rally from the LL → HL → HH structure (bullish trend).
Price is now overextended into resistance → likely for a pullback.
🔥 1. SELL SETUP (Rejection from Supply Zone)
Price is already inside a big supply zone (3,240 – 3,260).
📍 Sell Entry
3240 – 3255 (inside the blue supply zone)
🛑 SL (Safe Stop)
3275
🎯 TP Targets
1️⃣ 3196
2️⃣ 3071
3️⃣ 2966
4️⃣ 2885 (demand zone)
🟢 2. BUY SETUP (Breakout + Retest)
Only buy if price closes above 3275.
📍 Buy Entry
Above 3275 + retest of 3250–3260
🛑 SL
3220
🎯 TP
1️⃣ 3340
2️⃣ 3380
3️⃣ 3450
🟢 3. PULLBACK BUY (Best & Safe Buy Zone)
Look for price to retrace into demand areas.
📍 Pullback Buy Zones
Zone A:
3196 – 3170
Very strong FVG + demand
SL: 3140
TP: 3240 → 3275
Zone B (Bigger Pullback):
3071 – 3050
Clean structure support + liquidity level
SL: 3010
TP: 3150 → 3240 → 3300
🔻 4. PULLBACK SELL (If price breaks down)
Only if price breaks 3196 and retests.
📍 Pullback Sell Entry
3190 – 3205 retest
🛑 SL
3230
🎯 TP
1️⃣ 3071
2️⃣ 2966
3️⃣ 2885
🚫 5. NO-TRADE ZONE
3210 – 3240
Reason:
This is the mid-range of supply zone
Candles are mixed
Not safe to buy or sell until rejection or breakout
⭐ FINAL SUMMARY (Keep for Your Chart)
🔥 SELL (Current Best Setup)
Entry: 3240–3255
SL: 3275
TP: 3196 → 3071 → 2966 → 2885
🟢 BUY (Breakout)
Entry: above 3275 (retest 3250–3260)
SL: 3220
TP: 3340 → 3380 → 3450
🟢 PULLBACK BUY
Zone A: 3196–3170 (SL 3140)
Zone B: 3071–3050 (SL 3010)
TP: 3240 → 3275 → 3300
🔻 PULLBACK SELL
If price breaks 3196
Entry: 3190–3205
SL: 3230
TP: 3071 → 2966 → 2885
🚫 NO-TRADE ZONE: 3210–3240

Weekly analysis BTC with high RnR scenariosBTC is now in consolidation zone and may spend some more days. It may also develop ABC pattern or reversal at daily level, if price has to change its delivery and take turn from here. This zone is kind of make or break. If price is not able to sustain and breakdown, then it may witness ~65-70K levels as well.
We hope for reversal from this level as price is developing the pattern at higher time frame.
1. Price has taken liquidity or 82K and almost touched 80K.
2. It has inversed 1Day FVG and now price is consolidating in the range between EMAs.
3. We may expect price retracement till 1D iFVG and then reversal.
4. Before to that we may see sweep of 92900 (1D CISD) level and then a retracement short trade till 1D FVG
5. Most probably price will take liquidity of FVG/RDRB level and create MSS/CISD/TS/iFVG in LTF.
6. Price should show rejection/reversal in respective LTF (5m/15m) at FVG zone.
7. Take the trade only once clear entry model i.e. turtle soup. iFVG break, CDS or MSS happens on LTF
All these combinations are signalling a high probability and high RnR trade scenario.
Note – if you liked this analysis, please boost the idea so that other can also get benefit of it.
Also follow me for notification for incoming ideas.
Also Feel free to comment if you have any input to share.
Join me on live stream for real time update.
Disclaimer: This analysis is for educational purposes only and does not constitute investment advice. Please do your own research (DYOR) and check with your financial advisor before making any trading decisions.
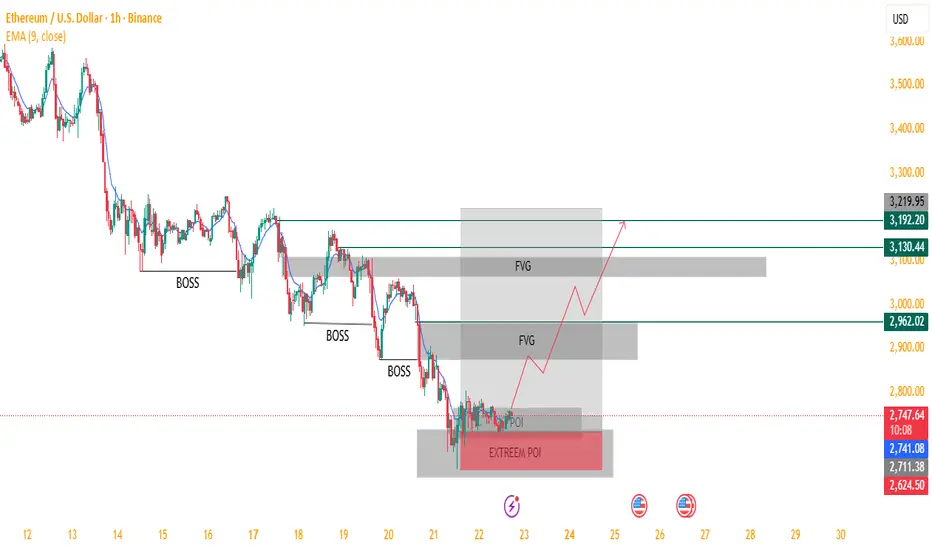
ETH/USD – Potential Bullish Reversal from Extreme POI !Analysis:
The chart suggests Ethereum is currently trading inside a strong Extreme Point of Interest (POI) after a series of Breaks of Structure (BOSS) to the downside. Price has entered a demand zone that may trigger a bullish reversal.
Key observations:
Downtrend Structure: Multiple BOSS confirmations show sustained bearish momentum leading into the Extreme POI.
Extreme POI (Demand Zone): Price is consolidating inside a deep demand area marked in red, indicating potential accumulation by buyers.
POI Reaction Expected: If price maintains support here, a bullish reversal is likely.
Fair Value Gaps (FVG):
Two major FVGs above act as logical bullish targets for price inefficiency fill.
Projected Price Path:
The drawn projection suggests:
Short-term bounce from POI
Breakout structure upward
Continuation toward higher FVG fills around $2,962, $3,130, and possibly $3,192 – $3,220.
Bias:
▶ Bullish, as long as price remains above the Extreme POI.
A breakdown below would invalidate the setup and continue the downtrend.
This is a strong smart-money style setup with a clean narrative:
Demand → Break of structure → FVG fill → Higher targets.
ETH - 2 hour chart - Trend based Fibonacci Retracement Price took strong support from the green demand zone and bounced, starting a fresh upward move. This rally reached the Fibonacci 0.618–0.786 zone, where price faced resistance and started a pullback. During this pullback, a falling trendline formed, showing short-term selling pressure. Now price is moving between the 0.236 and 0.382 Fibonacci levels and is again testing the trendline from below. If price gives a clean breakout above this falling trendline and holds, it can continue its upward move toward higher Fibonacci levels. If the breakout fails, price may retest lower Fibonacci areas or even move back toward the support zone.
Entry: Buy on trendline breakout and retest around 3530–3550
Stop Loss: Below recent swing and Fibonacci 0.236 zone around 3450–3470
Targets:
• First target near 0.382 zone around 3600
• Second target near 0.5 zone around 3680
• Final target near 0.618–0.786 zone around 3750–3850
Disclaimer: This analysis is for educational purposes only and not financial advice. Always do your own research before trading or investing.

ETH - 1 Hour chart - LongPrice touched the trendline multiple times at points 1, 2, 3 and 4 and got rejected each time, showing that sellers were active on every move up. After this, the price took strong support from the green demand zone and bounced. Once the bounce came, price broke a small resistance and returned for a clean retest. The long entry was taken on this retest around 3505–3515, with the stop loss placed below the support zone near 3460–3470. The next major resistance around 3660–3670 was kept as the target. The idea behind the trade is simple: support held well, breakout happened, and the retest gave a low-risk buying opportunity.
Disclaimer: This analysis is for educational purposes only and not financial advice. Always do your own research before trading or investing.*

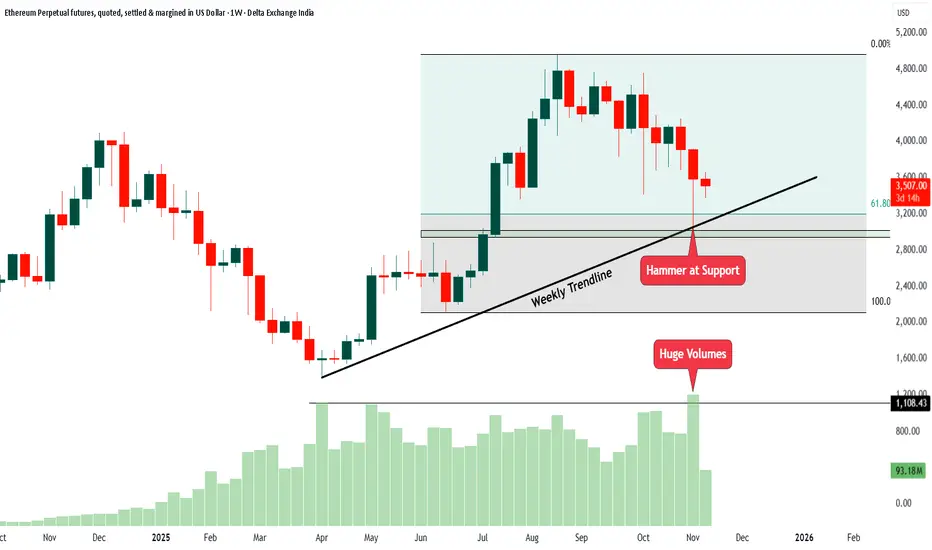
ETH Weekly Chart Analysis1. The price has been respecting a weekly trendline for many months. This trendline acts like a support line where buyers usually come in.
2. Recently, the price fell towards this same trendline and created a hammer candle. A hammer at support often shows that sellers pushed the price down, but buyers stepped in strongly and pulled it back up. This is usually a sign of buying interest.
3. The hammer candle formed exactly near the support zone and the Fibonacci 61.8 percent area. This area often works as a strong reversal point.
4. When the hammer candle formed, the volume was very high. Huge volume at support means big players were actively buying at lower levels.
5. The price is still inside a wide range between recent highs and lows. It has not broken out yet, but the support reaction is positive.
In simple words, the chart is showing a strong bounce setup from support with a hammer candle and high volume. This is a sign that buyers may try to take control again as long as the price stays above the trendline and support area.
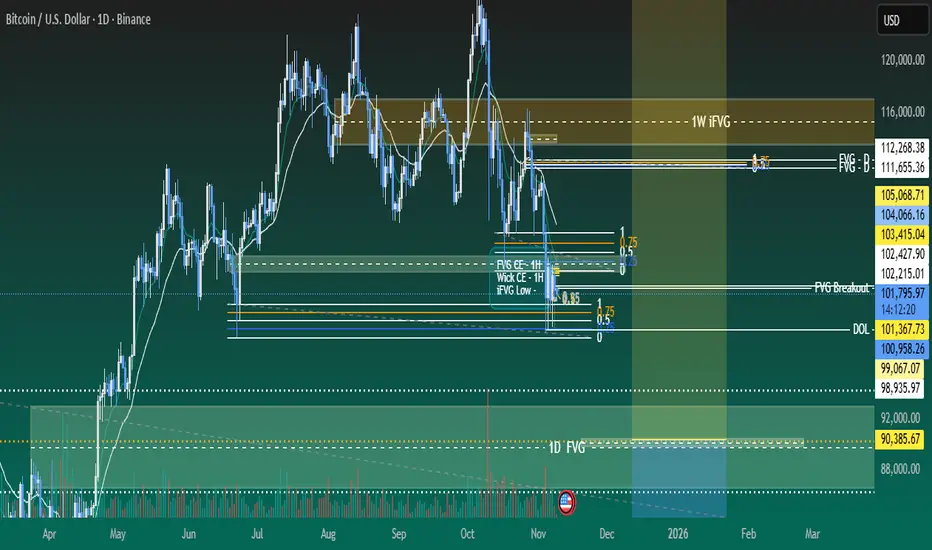
Weekly analysis BTC with 4R trade ideaLast weeks’ trade has performed well and already moved ~15K points and still going on. Further to this week analysis, we expect good reversal trade from the zone of 89700 to 90385. Still we have ~11k points movement pending to reach to this level. Price would be showing weakness in sell side and reversal pattern. We should patiently wait for entry model and confirmation as price is in sell side.
1. 1D FVG and wick is creating strong cluster of their relevant CE levels.
2. We would see exaction in sell side movement and reversal pattern.
3. RSI will also show oversold or bearish divergence on HTF.
4. Most probably price will take liquidity of FVG and create MSS/CISD/TS/iFVG in LTF.
5. Price should show rejection/reversal in respective LTF (1H/15m) at FVG zone.
6. Take the trade only once clear entry model i.e. turtle soup. iFVG break, CDS or MSS happens on LTF
All these combinations are signalling a high probability and ~4R trade scenario.
Note – if you liked this analysis, please boost the idea so that other can also get benefit of it.
Also follow me for notification for incoming ideas.
Also Feel free to comment if you have any input to share.
Disclaimer – This analysis is just for education purpose not any trading suggestion. Please take the trade at your own risk and with the discussion with your financial advisor.
,
Weekly & Daily BTC analysis of 10R Opportunity........On HTF weekly and daily BTC is forming good scenarios for bearish trade. Price is consolidating at higher levels for last couple of weeks and showing value adjustment in BTC. Price already shot up a lot and we may see a short term pull back.
1. BTC has created CISD after taking liquidity at weekly level and tested weekly iFVG.
2. It has also created 1D FVG and 4H FVG and iFVG over lapping. creating cluster of CEs. Which might be a Good POI for sell side opportunity.
3. Technically we are already into a weekly down side scenario. Further price is approaching Daily and 4 Hourly FVGs for possible re-entry opportunities.
4. RSI has also already shown a bearish divergence on weekly level.
5. Most probably price will take liquidity of FVG and create MSS/CISD/TS/iFVG in LTF.
6. Price should show rejection/reversal in respective LTF (1H/15m) at FVG zone.
7. Take the trade only once clear entry model i.e. turtle soup. iFVG break, CDS or MSS happens on LTF
All these combinations are signalling a high probability and ~10R trade scenario.
Note – if you liked this analysis, please boost the idea so that other can also get benefit of it. Also follow me for notification for incoming ideas.
Also Feel free to comment if you have any input to share.
Disclaimer – This analysis is just for education purpose not any trading suggestion. Please take the trade at your own risk and with the discussion with your financial advisor.

Intraday Long Setup | Oct 26th 2025 | Valid Until Daily ClosePrice might retrace to a strong pivot zone.
Structure remains bullish with potential for continuation after pullback.
Tight risk control.
Watch for price reaction within the red zone. Entry only if confirmation appears
The setup expires at end of the daily candle close.
