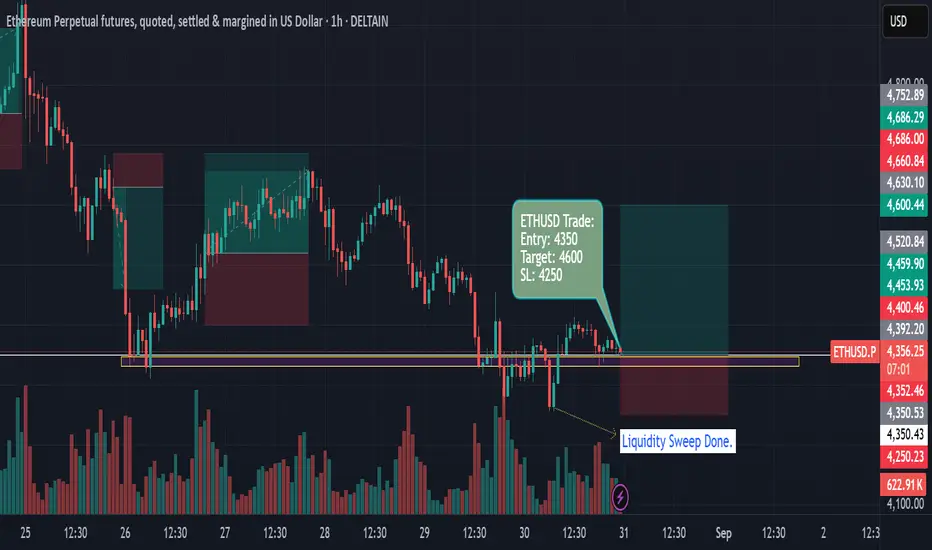
ETHUSD 1H — Liquidity Sweep Reversal with Precision EntryTrade Summary
• Entry: $4,350
• Target: $4,600
• Stop Loss: $4,250
• Risk/Reward Ratio: 2.5:1
After a significant liquidity sweep just below $4,350, Ethereum Perpetual Futures have reclaimed support and established a potential reversal base. The trade enters at $4,350, with a tight stop loss at $4,250, banking on the exhaustion of sellers and fresh momentum above reclaimed support. The target is $4,600, right before a major resistance cluster and previous swing high, offering clarity on profit-taking and risk parameters.
Recent price action signals a shift from bearish momentum to consolidation, as aggressive buyers absorbed supply during the liquidity sweep — a signature move that often precedes sustained rallies. The setup features:
• Clear horizontal support with visible volume confirmation
• Precise entry post-sweep for maximum risk efficiency
• Stop loss positioned below the sweep zone for strict invalidation
• Well-defined target near a high liquidity supply area
Why I like it: Excellent risk management, technical clusters, and early signs of trend reversal. Would love feedback from the community on additional confluence factors or alternate views!
Ethpriceanalysis
ETHUSD | Technical Analysis 25/08/2025Hi,
ETH can form inverted head and should and go upside upto 5100+. Time period can be 4 to 5 days.
Disclaimer: This is only for educational purpose.
Thanks

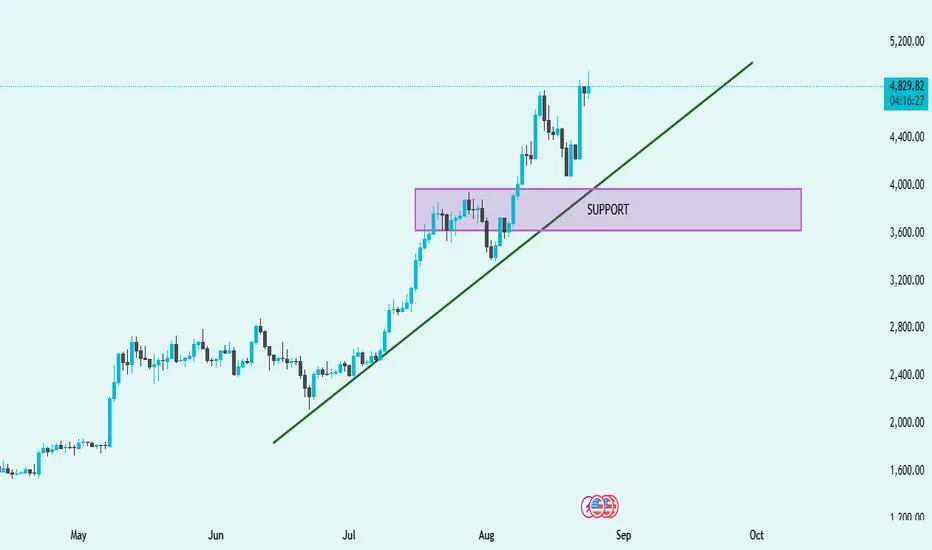
ETH/USD Technical Analysis – Strong Uptrend with Key Support📈 ETH/USD Technical Analysis – Strong Uptrend with Key Support
Trend Direction ➡️
The chart shows a clear bullish trend supported by an upward sloping trendline (green). Price action is consistently forming higher highs and higher lows, confirming strong upward momentum.
Support Zone 🟪
The highlighted support area (3,600 – 4,000) has been tested successfully. Price bounced strongly from this zone, showing buyers are actively defending this level.
Breakout & Momentum 🚀
After retesting support, ETH broke above the recent consolidation and is now trading around 4,843, pushing towards new highs. This signals bullish continuation if volume supports the move.
Trendline Confirmation 📐
The trendline has acted as a dynamic support multiple times. As long as ETH trades above it, the bullish trend remains intact.
Outlook 🔮
If ETH stays above 4,800, the next potential target could be 5,200+.
If price breaks below the trendline and the 3,600 support zone, bearish correction may begin.
✅ Summary: ETH is in a strong bullish trend 🚀, supported by both the trendline and key support zone. Short-term outlook remains bullish as long as 4,800 holds.
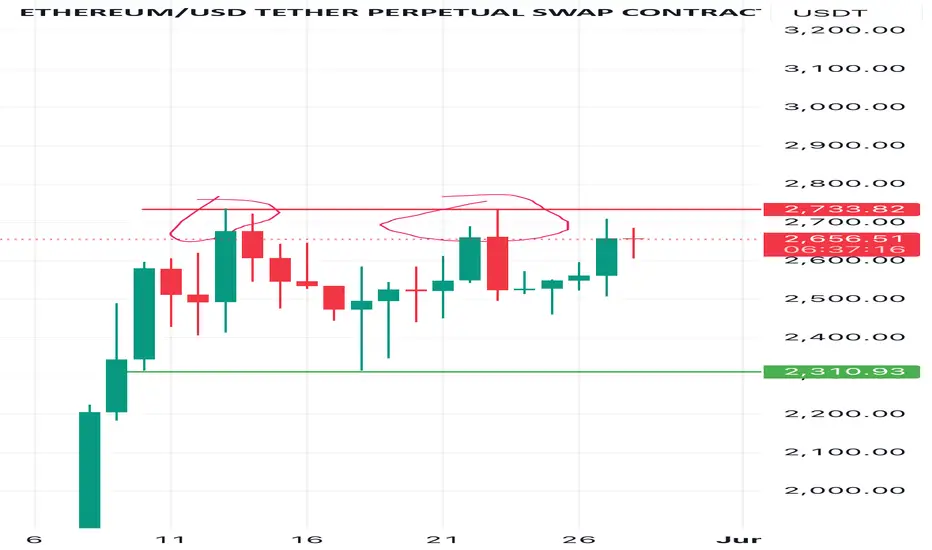
"Bearish Reversal Opportunity Following Supply Zone Rejection"1. Double Top Formation (Resistance Level Identified)
The chart displays a clear double top structure at the 2,760–2,800 USDT level.
This level has acted as a strong supply zone (highlighted in red), where price previously reversed, indicating heavy selling interest.
Current price action has retested this resistance zone and shown signs of rejection.
2. Liquidity Sweeps & False Breakouts
On the left side of the chart, an aggressive downward wick (marked with a blue arrow) suggests a liquidity sweep below a key low before strong bullish momentum returned.
This type of price action indicates smart money involvement, designed to remove weak hands before pushing price higher.
3. Accumulation Phases (Sideways Consolidation)
Multiple accumulation ranges are highlighted with blue rectangles.
These ranges show horizontal consolidation, where price builds up energy before breakout.
The most recent breakout led to a vertical rally toward the resistance zone, signaling an end of the accumulation and a start of distribution.
4. Double Bottom Support Structure
Identified near the 2,480 level, marked by red circles.
This level has historically acted as demand/support, evidenced by multiple bounces from this price zone.
Now highlighted with a grey zone, it is projected to act as the next key support area.
5. Bearish Projection
A large black arrow suggests a forecasted bearish move from the current high (~2,800) back to the support zone (~2,480).
This aligns with the idea of a mean reversion or pullback after a strong bullish impulse.
---
Conclusion & Trade Idea:
🔻 Bias: Bearish (Short-term)
The chart presents a classic reversal pattern with a double top at a well-defined supply zone.
Entry could be considered after confirmation of rejection from this level.
🧠 Trade Plan Suggestion:
Entry: Short near 2,780–2,800 after bearish confirmation (e.g., bearish engulfing candle or break of structure).
Target: 2,480 (support zone).
Stop Loss: Above 2,820 (recent high).
Risk-Reward: Approximately 1:2.5 or better depending on execution.

Ethereum Bull Run Analysis Here's the latest on Ethereum:
- Current price is $2,506
- There's been a surge in institutional interest, driving huge demand for ETH ETFs
- Asset managers like BlackRock and Fidelity have been buying Ethereum continuously while selling off BTC ETFs, resulting in record-high inflows
- This type of inflow is typically seen before Ethereum takes off and enters a parabolic phase
- Technically, it all depends on how USDT D and BTC D perform; they both need to drop significantly for money to rotate within the markets
- I still think Ethereum can easily revisit $2,100 before breaking out, which should signal the top for USDT D, ultimately leading to Ethereum outperforming and a 50% move from there.
- Accumulation Zones for ETH: 1700-1890$, 2000-2120$
ETH massive breakout coming. Only trade i am watching for this week is this one. Huge consolidation and now looking to breakout for third test. Not entering early as too many fakeouts but yeah looks good for now.
ETH with M2 Money Supply Adjusted 76 DaysETH with M2 Money Supply Adjusted 76 Days. Looks like a possible breakout April 7th in this example. Let's see if this help predict ETH future price moves.

ETH - Potential Bullish Signs (Weekly) ETH forming some potential bullish signs on the weekly chart. These can take a few months to play out. We would like to see a bullish cross on the 21SMA and 50SMA. We would like to see the continuation on the stochastic RSI cross. We would like to see a break over the white trendline in the 3100 range. Lets see if the bullish hammer candle is in play with that long wick that was bought up in this past weekends sell off, closing Sunday. I would keep a tight stop loss around the 200SMA (Yellow).

#ETH Above 4000$#ETH Above 4000$..
ETH can go above 4000 because BTC is showing a correction in the daily chart, and ETH is showing bullish signals on the 4-hour charts.

Ethereum 1D Technical Analysis & Commentary- Ethereum is currently trading at 2448$
- Ethereum has been moving in a range since August 2024
- Ethereum has also underperformed Bitcoin after its ETF approval that's another thing to notice
- Ethereum/BTC has been slaughtered like anything and that's another way to track when ETH will outperform BTC
- ETH/BTC is currently in a free fall and I see 2 Major areas where I expect a reversal from
: 1st - 0.029
: 2nd - 0.021
- Ethereum's ecosystem and Altcoins will only pump hard the ones related to the ETH ecosystem when we see Ethereum flipping 2800$ and making a weekly close above it post that we might see a strong recovery in Alts like OP, ARB, Matic, and so on.
- Meme coins based on the ETH ecosystem are already performing nicely, but if ETH takes over then they will also turn parabolic so watch out PEPE it's a narrative play
- Ethereum has started building a base now, the bigger the consolidation the larger the expansion is going to be, mind that
- Spot Ethereum accumulation at this price is best from a conservative approach you can easily expect 100% in a quarter if your average price is 2500$

Ethereum Swing Long Update - Ethereum is currently trading at 2563$
- Ethereum can soon outperform BTC once it flips 2800$ on a weekly time frame
- As a trader, you should wait for Ethereum to fill the FVG that's sitting on 2490$
- Deeper retracement will lead to an impulsive move towards the upside
- Make sure to add more size in ETH once you see it below 2500$
- I am anticipating Ethereum to easily print 3600-4000$ by the end of October
- For leverage traders watch out 2450 and try to make your entries conservative if you are using 2-3x leverage anything above that can be very risky
- Look for longs more because the market has a lot to recover in the last quarter instead of falling from here
- I don't think we should be falling from here anymore like we did earlier, small retracements and sudden retracements are fine in a bull market but as long as ETH isn't above 5000$ we cant consider this an altcoin bull market
- Trade safe and use logic - VK

Ethereum Updated#ETH Setup, +Educational Content
Accumulation ~ Range between two specific price.
Manipulation ~ Liquidity Grab.
Distribution ~ Price delivery.
PO'3 happen on every timeframe and single candle as well.

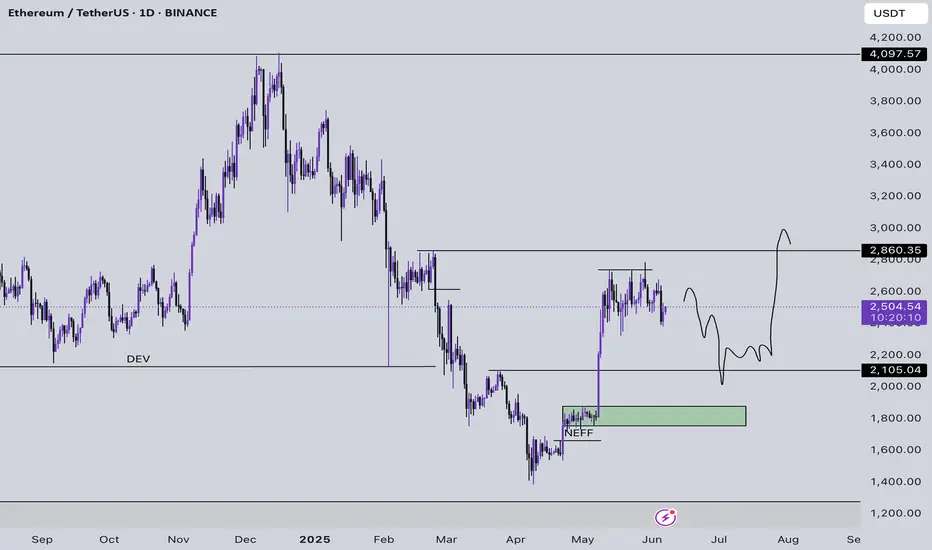
Ethereum Accumulation Setup Ethereum is currently trading at 2522$
- Ethereum can easily mitigate its weekly order block to grab more liquidity
- Ethereum post its ETF launch has only crashed and not at all moved higher
- From 3600-2500$ ETH has got badly slaughtered
- ETH over twitter has also become the most hated coin in the crypto industry
- ETH/BTC and ETH works hand in hand so keep tracking that as well before you plan to take any entries in SPOT
- 2000-2200$ can be a solid purchase and Spot Accumulation Zone for ETH so watch out
- I have drawn 2 paths and both them shows ETH will grab more liquidity from beneath

Ethereum moving towards $1k#Ethereum Daily Chart Analysis
CRYPTOCAP:ETH #BearishWedge pattern starts from june 2022, after previous BullRun's downfall towards #BearishZone market, and now it will be very nearby to finish its final cycle of last Bearish mode within next 35-50 days.
As per present scenario. CRYPTOCAP:ETH will be goes towards $1k, while its Last Lower-Low target will be around $950-$850 maximum and $750 - $650 will be the minimum cut-off mark last time into this Bear Market.
After this #BullRun completion, it will be major chances, that CRYPTOCAP:BTC & CRYPTOCAP:ETH also start trading under #ETFs fund then Ethereum will be also at new Highest point of #ATH approx. FWB:12K -$15k, it means if CRYPTOCAP:ETH will be reach-out min. $1k then upto FWB:12K -$15k , its easily gives you benefits of 12x-15x.
Anyway, those are just predictions as per Technical & Fundamental Analysis as per market Acceptances of two most popular and top-2 #crypto Currencies in #CoinMarketCap.
but,
always #DYOR before investing into any #Crypto as well Trade wisely by using of #StoppLoss and It's just #NFA.
Also, always LIKE, SHARE, FOLLOW & COmment on it...!!

#Ethereum/USD downtrend movement potential with risk:reward 1.9#Ethereum/USD downtrend movement potential with risk:reward 1.9
Symbol :Ethereum / US dollar
Time frame :30 minutes
Analysis : Breakout from the support line and rallying on a down side.
Moving average 20 is below Moving average 40 and Macd is below zero.So, we can expect a down trend movement with risk:reward =1.9
Its a SELL call . SELL at 1825 with Stop-loss 1880 and the Target 1718 .
HOPE our analysis is adding value to your trading Journey.
NOTE: Published Ideas are for ‘’EDUCATIONAL PURPOSE ONLY’’ trade at your own risk.
NOTE: RESPECT The risk. SL should not be more than 2% of the capital.
Happy Trading
