The Bearish take on EthereumETH’s price action isn’t resilience — it’s structural weakness.
• ETH failed to lead while BTC stabilized
• No rotation narrative — capital isn’t choosing ETH
• Underperformance is a signal, not noise
Ethereum doesn’t benefit from “digital scarcity.”
• Supply is policy-driven, not fixed
• Monetary credibility depends on human decisions
• In tightening cycles, that’s a liability
The “ETH = tech beta” story is now working against it.
• Risk-off hits growth assets first
• Fees down → activity down → narrative breaks
• Layer-2s dilute value capture, not enhance it
$2,000 isn’t just a round number — it’s structural.
• Prior demand zone
• Psychological anchor
• Forced positioning reset area
A move to $2K wouldn’t be capitulation — it would be repair.
If liquidity tightens, ETH likely overshoots downside first…
then finds real buyers near $2,000.
Weak hands exit above.
Strong hands step in below.
Ethshort

#ETH ON THE EDGE DELTAIN:ETHUSD.P
ETH is on the edge of the cliff. If it breaks below this level, we can see a significant downward move to $2200 easily and worst case of $1500 & $1400.
Long term investors can accumulate on the supports. Follow me for more.
This indicator is provided for educational and informational purposes only.
It does not constitute financial advice, investment recommendations, or trade signals.
The creator and Systematic Traders Club are not responsible for any financial losses resulting from the use of this indicator.
Trading and investing involve risk. Always do your own analysis and use proper risk management.

ETH 1H Outlook: Key Support Retest With Potential Downside RiskKey observations:
1. Support Level Under Pressure
ETH is retesting this support multiple times.
The annotation suggests: “SUPPORT IF BREAKS THEN WE CAN SEE MORE DOWNWORD” — meaning a breakdown could trigger further selling.
2. Downside Targets
If the current support fails, the next liquidity zones highlighted are:
FVG (Fair Value Gap) around $2,950–$2,900
Extreme POI zone around $2,880–$2,850
Major support at $2,787 (marked as “next support”).
3. Upside Scenario
If support holds, ETH could bounce toward:
$3,078
$3,134
High resistance around $3,225
4. Market Structure
Several CHoCH and BOS labels indicate mixed structure, showing recent weakness but with potential for rebound if buyers defend support strongly.

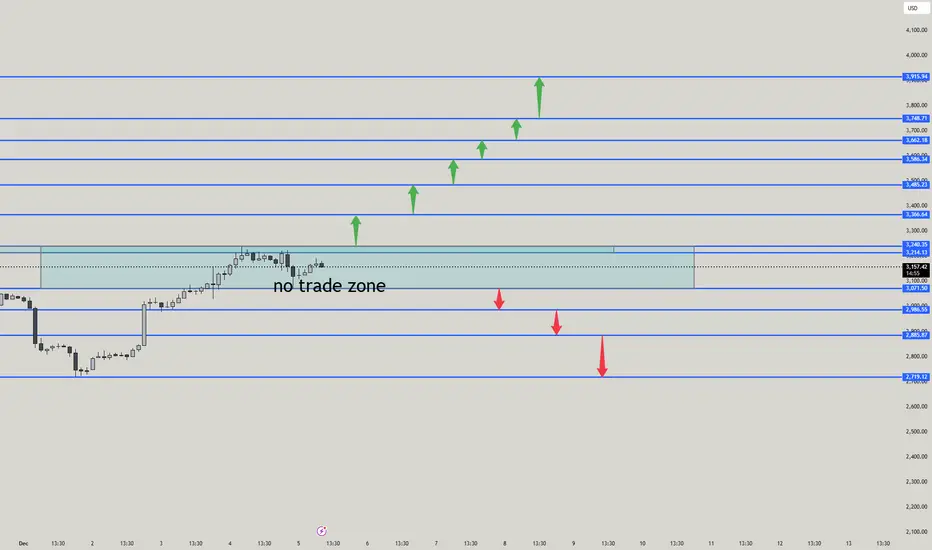
ETHUSD – Pure Price Action Analysis ETHUSD – Pure Price Action Analysis (Buy | Sell | TP | SL | No-Trade Zone)
🚫 NO-TRADE ZONE (Ranging / Indecision Area)
The shaded box between $3,140 – $3,245 is your no-trade zone.
Reason:
Market is consolidating
No strong direction
Liquidity building
Smart money accumulation area
👉 Inside this box = avoid entries.
Wait for breakout + retest.
✅ BUY SETUP (Breakout → Retest → Long)
Buy Entry Levels
1️⃣ Buy above $3,245 (clean breakout & retest)
2️⃣ Safer buy above $3,290 (strong momentum zone)
Buy-Side Targets (TP)
🎯 TP1 → $3,366
🎯 TP2 → $3,428
🎯 TP3 → $3,502
🎯 TP4 → $3,602
🎯 TP5 → $3,748
🎯 TP6 → $3,915 (high probability supply zone)
STOP LOSS for Buy
🛑 SL → Below breakout candle
Safer → Below $3,200
❌ SELL SETUP (Breakdown → Retest → Short)
Sell Entry Levels
1️⃣ Sell below $3,100
2️⃣ Aggressive sells at each retest shown by red arrows.
Sell-Side Targets (TP)
🎯 TP1 → $2,986
🎯 TP2 → $2,885
🎯 TP3 → $2,719 (major demand zone)
STOP LOSS for Sell
🛑 SL → Above the retest candle
Safer → Above $3,140
🔥 BEST HEADING FOR THIS ANALYSIS
ETHUSD – Breakout Trading Plan | Buy–Sell Zones | TP–SL | No-Trade Zone
📌 SUMMARY (Very Clear)
🚫 No-Trade Zone:
$3,140 – $3,245
✅ Buy only if price breaks → retests → holds above $3,245
TP → 3,366 / 3,428 / 3,502 / 3,602 / 3,748 / 3,915
SL → Below 3,200
❌ Sell only if price breaks → retests → fails below $3,100
TP → 2,986 / 2,885 / 2,719
SL → Above 3,140
Short ETH nowETH short from here a good wich rejection seen a good short trade 1HR timeframe rejection

BTC is forming a 3R sell scenario.....BTC is in downtrend in daily timeframe and shown sniper delivery, now it is in pullback mode. We may anticipate a good short term trade around 102000 RDRB level
1. Price is continuously crating BOSs..
2. Sniper deliver is already done and price is pulling back slowly.
3. RSI has already shown bearish divergence on hourly TF.
4. Most probably price will take liquidity of FVG/RDRB level and create MSS/CISD/TS/iFVG in LTF.
5. Price should show rejection/reversal in respective LTF (5m/15m) at FVG zone.
6. Take the trade only once clear entry model i.e. turtle soup. iFVG break, CDS or MSS happens on LTF
All these combinations are signalling a high probability and ~8R trade scenario.
Note – if you liked this analysis, please boost the idea so that other can also get benefit of it.
Also follow me for notification for incoming ideas.
Also Feel free to comment if you have any input to share.
Disclaimer: This analysis is for educational purposes only and does not constitute investment advice. Please do your own research (DYOR) and check with your financial advisor before making any trading decisions.

BTC 8R Sell scenario.........BTC is in downtrend in daily timeframe and shown sniper delivery, now it is in pullback mode. We may anticipate a good short term trade on hourly time frame around hourly FVG
1. HTF MSS is already done and price is reverting to FVG after BOS.
2. Daily quadrant cluster is also falling around FVG. Which is giving us some more critical levels of price reversal.
3. RSI has already shown bearish divergence on hourly TF.
4. Most probably price will take liquidity of FVG and create MSS/CISD/TS/iFVG in LTF.
5. Price should show rejection/reversal in respective LTF (5m/15m) at FVG zone.
6. Take the trade only once clear entry model i.e. turtle soup. iFVG break, CDS or MSS happens on LTF
All these combinations are signalling a high probability and ~8R trade scenario.
Note – if you liked this analysis, please boost the idea so that other can also get benefit of it.
Also follow me for notification for incoming ideas.
Also Feel free to comment if you have any input to share.
Disclaimer – This analysis is just for education purpose not any trading suggestion. Please take the trade at your own risk and with the discussion with your financial advisor.

BTC is developing ~4R down side tradeBTC has done MSS on 4h time frame and showing rejection at 4H FVG after displacement. We can see a good downside trade once below FVG is mitigated and changed to iFVG. We need to wait for price getting into right zones.
1. Currently price is moving inside 4H FVG after displacement and showing rejection as well.
2. Price should break below FVG and retest.
3. There are several SIBIs which may be target for it and further buy side reversal trade.
4. RSI has already shown bearish divergence. Which support coming down move.
5. Most probably price will take liquidity of FVG and create MSS/CISD/TS/iFVG in LTF.
6. Price should show rejection/reversal in LTF (5m,1m) at FVG zone.
7. Take the trade only once clear any of the entry model i.e. turtle soup. iFVG break, CDS or MSS happens on LTF
All these combinations are signalling a high probability and ~4R trade scenario.
Note – if you liked this analysis, please boost the idea so that other can also get benefit of it. Also follow me for notification for incoming ideas.
Also Feel free to comment if you have any input to share.
Disclaimer – This analysis is just for education purpose not any trading suggestion. Please take the trade at your own risk and with the discussion with your financial advisor.
ETHUSD 2.5R sell side trade scenarioETHUSD is forming sell side trades as current bias and draw on liquidity both are at down side. Price has also left SIBIs to attract price upside for a while and then return back to target. In weekend price may have low volatility and trade possibly generate on Monday or later.
1. There is a daily time frame bearish FVG.
2. There is bearish FVG in 4H TF. Now price is approaching it slowly.
3. These FVGs are forming inside OTE zone.
4. Order flow is bearish. And draw on liquidity is also at downside.
5. Most probably price will take liquidity of FVGs and create MSS/CISD/TS/iFVG in LTF.
6. Price should show rejection/reversal in LTF (5m,1m) at FVG zone.
7. BTC is also forming similar scenario.
All these combinations are signalling a high probability and 2.5R trade scenario.
Note – if you liked this analysis, please boost the idea so that other can also get benefit of it. Also follow me for notification for incoming ideas.
Also Feel free to comment if you have any input to share.
Disclaimer – This analysis is just for education purpose not any trading suggestion. Please take the trade at your own risk and with the discussion with your financial advisor.

BTCUSD 3R Sell side trade BTCUSD is forming sell side trade as current bias and draw on liquidity both are at down side. Price has also left SIBIs to attract price upside for a while and then return back to target. In weekend price may have low volatility and trade possibly generate on Monday or later.
1. There is a 4H time frame bearish FVG.
2. There is bearish FVG in 1H and 30m overlapping with 4H FVG. Now price is approaching it slowly.
3. These FVGs are forming inside Fib golden zone.
4. Order flow is bearish. And draw on liquidity is also at downside.
5. Most probably price will take liquidity of FVGs and create MSS/CISD/TS/iFVG in LTF.
6. Price should show rejection/reversal in LTF (5m,1m) at FVG zone.
All these combinations are signalling a high probability and 3R trade scenario.
Note – if you liked this analysis, please boost the idea so that other can also get benefit of it. Also follow me for notification for incoming ideas.
Also Feel free to comment if you have any input to share.
Disclaimer – This analysis is just for education purpose not any trading suggestion. Please take the trade at your own risk and with the discussion with your financial advisor.

ETH HnSA Head N Shoulder is being made in ETH in 4hr tf. It is also break a rising trendline support.
Entry- 4395-4400
SL- 4550
Target- One can look to book after one is to one or can also target the recent low it made that is 4200.
Disclaimer- This is just for educational purpose. Please take advice before making any decision.
Jai Shree Ram.

ETH short trade plan on 15 minEth is down, Fell good during NY session, a small bounce inviting Cheap buyers to get in and get a higher fill for shorts.
when 50 ema is trending all bounces towards the 50 ema + failure should be considered shorts
For long: let it cross + dip + continuation then buy

Bearish Trade Setup for ETH/USDOverview:
The setup for this trade is based on a bearish outlook for Ethereum (ETH) against the US Dollar (USD) on the 1-hour chart. The entry, stop loss, and take profit levels are carefully defined to provide a balanced risk-to-reward ratio. Here's why this setup is a solid trade idea:
1. Trade Entry:
Entry Price: 4574.87
The entry point is set based on a recent price retracement within the prevailing downtrend. The price has shown signs of rejection from key resistance levels, and the trade is positioned to capitalize on further downside momentum.
2. Target Price:
Target Price: 4241.87
The target level is derived from technical analysis, where price is expected to move toward previous support levels, presenting a logical exit point for profits.
3. Stop Loss:
Stop Loss Price: 4741.37
The stop loss is placed above recent swing highs, ensuring the trade has enough room to breathe while minimizing the risk of false breakouts. This level is a protective measure to ensure that a reversal or unexpected price movement does not lead to unnecessary losses.
4. Risk-to-Reward Ratio:
RRR: The trade has an acceptable risk-to-reward ratio, where the potential reward outweighs the risk by more than 1:1. This is crucial for maintaining profitability over the long term.
5. Trend Analysis:
The market is currently in a bearish phase, as seen in the price action and the overall downtrend. The setup capitalizes on this momentum with a proper risk management strategy.
The use of indicators like moving averages can further confirm the downtrend, though they are not displayed here, they should align with the bearish trend.
6. Volume Confirmation:
The volume should ideally be decreasing during the retracement phase and increase during the move towards the target price, confirming the bearish continuation.
7. Conclusion:
This trade is well-positioned to take advantage of a continuation of the bearish trend. The entry, stop loss, and target are all logically placed based on key price levels and risk management principles. As always, ensure to monitor the trade, and be ready to adjust if market conditions change unexpectedly.

Eth tp hit and now going for short with low slLast chart tp hitted perfectly
NOW looking for shorts again and this is nothing those are catch the full runnnn
Must share this more coming
#APT Bearish Setup And IdeaAPT Is Also In Bearish Structure, Also Its Failing To Hold The Support, We Have A Small Reversal Area Downside, We Can See A Good Momentum In APT From Our Reversal Area, But Until Then There's No Pump (If Market Pumped, This Idea Will Be Invalidate).
Disclaimer -: This Is Not An Financial Advise, This Is An Idea, We Are Not Responsible For Any Profit And Loss You Will Made.

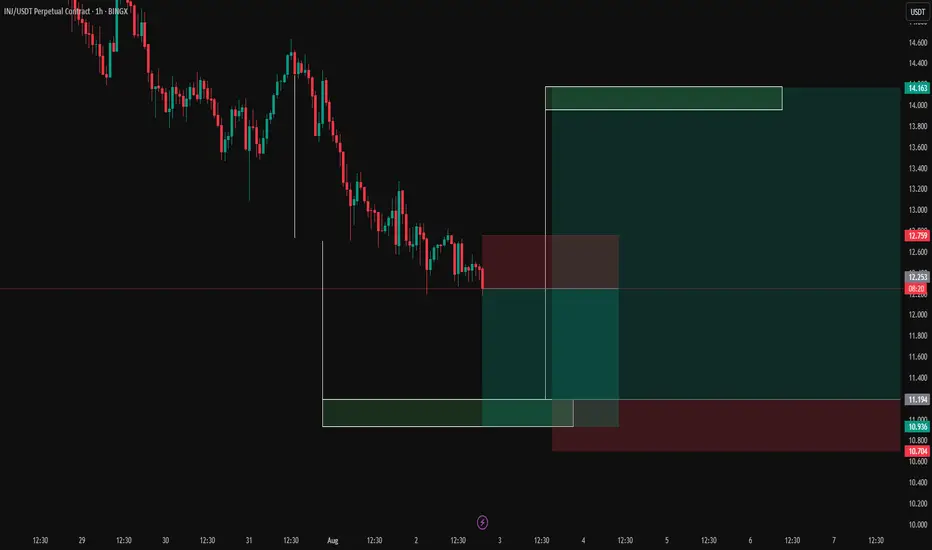
#INJ Possible Short Setup With Potential Reversal Area#INJ Is Also Bearish And Can Crash Till Our Reversal Area, We Can See A Massive Red Candle Towards Our Marked Reversal Area And Then A Big Green Candle On From Our Reversal Area.
Disclaimer -: This Is Not A Trade And Not A Financial Advise, We Are Not Responsible For Any Loss And Profit You Made, This Is Just An Idea
ETHUSD Rejection Near Supply-Breakdown path to 3481ETH/USD shows signs of weakness after rallying into a short-term supply zone. The structure suggests a possible trend reversal as price begins to reject near key resistance.
🔍 Setup Highlights:
🟥 Red zone represents a clear supply area, where buyers were absorbed.
🟧 Yellow bar cluster from SignalPro shows early consolidation before the pump.
🔵 Breakdown trigger initiated as price lost the momentum and structure failed near 3,700.
🎯 Target zone at 3481, aligning with a previous demand imbalance zone.
📘 Educational Takeaway:
This chart helps illustrate how:
Supply rejection zones act as trend reversal points.
Visual tools like Leola Lens SignalPro guide traders on structure + sentiment.
Mapping invalidation clearly improves discipline and planning.

Intraday Short Setup | June 29th 2025 | Valid Until Daily ClosePrice has pushed into a potential intraday Pivot supply zone (red box) where sellers may step in. This trade is based on the expectation of a rejection from this area.
Entry: Red box — a short entry zone aligned with overhead supply
Stop Loss: Above the red zone (invalidates the setup)
Target: Green box — area to consider partial/full exit based on momentum
Risk-reward is favorable with a tight invalidation and clean downside target
Price may stall or reverse near the red box, creating short opportunity
Note:
This is an intraday trade idea that expires at 00:00 UTC (Daily Candle Close). Re-evaluate the setup if price remains indecisive near the entry zone close to that time.
"Bearish Reversal Opportunity Following Supply Zone Rejection"1. Double Top Formation (Resistance Level Identified)
The chart displays a clear double top structure at the 2,760–2,800 USDT level.
This level has acted as a strong supply zone (highlighted in red), where price previously reversed, indicating heavy selling interest.
Current price action has retested this resistance zone and shown signs of rejection.
2. Liquidity Sweeps & False Breakouts
On the left side of the chart, an aggressive downward wick (marked with a blue arrow) suggests a liquidity sweep below a key low before strong bullish momentum returned.
This type of price action indicates smart money involvement, designed to remove weak hands before pushing price higher.
3. Accumulation Phases (Sideways Consolidation)
Multiple accumulation ranges are highlighted with blue rectangles.
These ranges show horizontal consolidation, where price builds up energy before breakout.
The most recent breakout led to a vertical rally toward the resistance zone, signaling an end of the accumulation and a start of distribution.
4. Double Bottom Support Structure
Identified near the 2,480 level, marked by red circles.
This level has historically acted as demand/support, evidenced by multiple bounces from this price zone.
Now highlighted with a grey zone, it is projected to act as the next key support area.
5. Bearish Projection
A large black arrow suggests a forecasted bearish move from the current high (~2,800) back to the support zone (~2,480).
This aligns with the idea of a mean reversion or pullback after a strong bullish impulse.
---
Conclusion & Trade Idea:
🔻 Bias: Bearish (Short-term)
The chart presents a classic reversal pattern with a double top at a well-defined supply zone.
Entry could be considered after confirmation of rejection from this level.
🧠 Trade Plan Suggestion:
Entry: Short near 2,780–2,800 after bearish confirmation (e.g., bearish engulfing candle or break of structure).
Target: 2,480 (support zone).
Stop Loss: Above 2,820 (recent high).
Risk-Reward: Approximately 1:2.5 or better depending on execution.

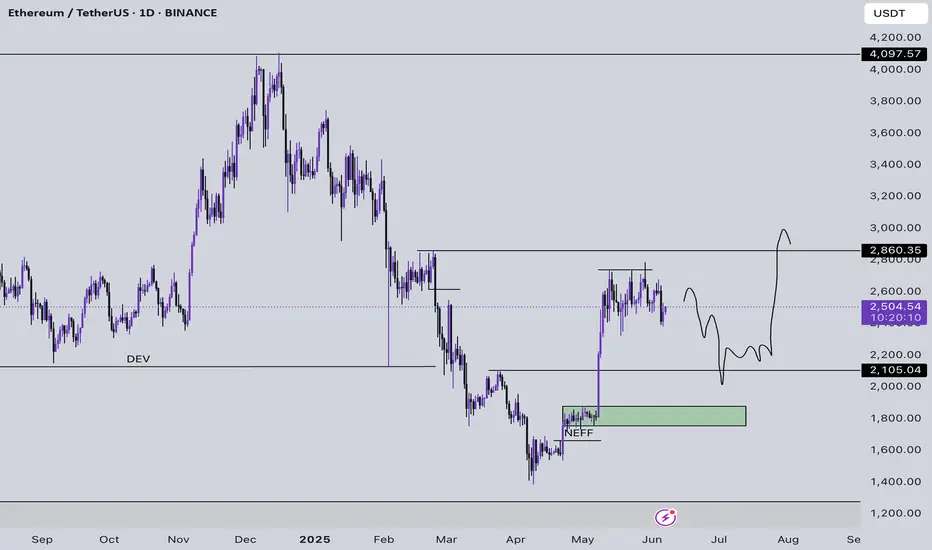
Ethereum Bull Run Analysis Here's the latest on Ethereum:
- Current price is $2,506
- There's been a surge in institutional interest, driving huge demand for ETH ETFs
- Asset managers like BlackRock and Fidelity have been buying Ethereum continuously while selling off BTC ETFs, resulting in record-high inflows
- This type of inflow is typically seen before Ethereum takes off and enters a parabolic phase
- Technically, it all depends on how USDT D and BTC D perform; they both need to drop significantly for money to rotate within the markets
- I still think Ethereum can easily revisit $2,100 before breaking out, which should signal the top for USDT D, ultimately leading to Ethereum outperforming and a 50% move from there.
- Accumulation Zones for ETH: 1700-1890$, 2000-2120$
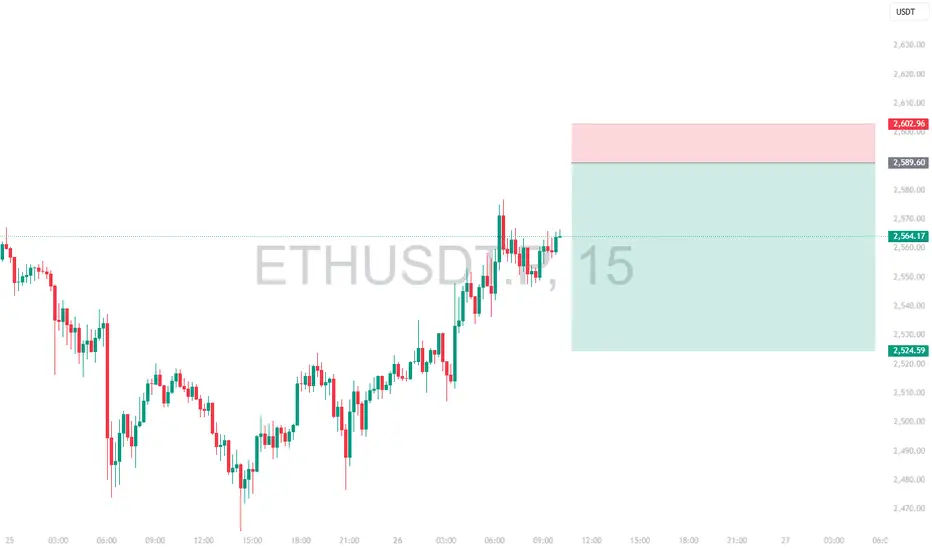
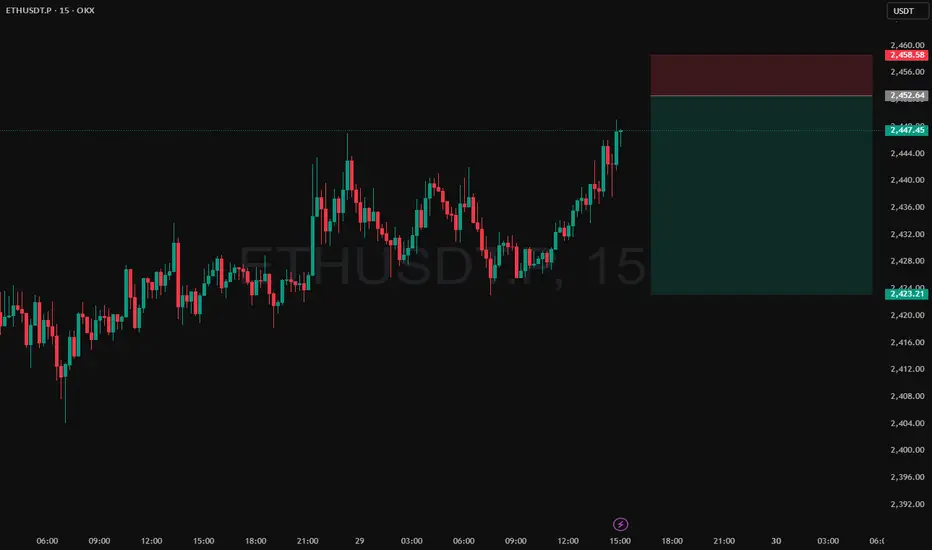
Intraday Short Setup | June 4th 2025 | Valid Until Daily ClosePrice has pushed into a potential intraday Pivot supply zone (red box) where sellers may step in. This trade is based on the expectation of a rejection from this area.
Entry: Red box — a short entry zone aligned with overhead supply
Stop Loss: Above the red zone (invalidates the setup)
Target: Green box — area to consider partial/full exit based on momentum
ETHUSDT has shown a strong bounce but is now approaching a key pivotal resistance zone
Risk-reward is favorable with a tight invalidation and clean downside target
Price may stall or reverse near the red box, creating short opportunity
Note:
This is an intraday trade idea that expires at 00:00 UTC (Daily Candle Close). Re-evaluate the setup if price remains indecisive near the entry zone close to that time.
They saw a breakdown. I saw entry precision.ETH just did what it always does before a shift — it delivered into value.
Price rejected from 2,550 cleanly, took out weak buyers, and revisited the same HVN where prior accumulation began. That wasn’t a breakdown — it was completion.
I’m looking at the 2,488.11 zone — right at the 0.786 retracement — as the launchpad. It aligns with a low-volume tail, creating the exact imbalance Smart Money uses to reprice.
Above, I’m watching for a reversion to the mean at 2,511.9 (0.5), followed by a reaction at 2,532 — the last inefficient node before the supply wall at 2,550 gets filled again.
If we break through 2,550 clean, this becomes a much larger redistribution leg. But we trade it one delivery at a time.
Execution setup:
🎯 Entry: 2,488.11–2,474.0
🔑 Target 1: 2,511.9
🎯 Target 2: 2,550
❌ Invalidation: 2,474.0 clean break and continuation — wait for new structure
Nothing about this setup was noisy.
Just price completing its job.
I don’t chase the move. I meet it where it begins.

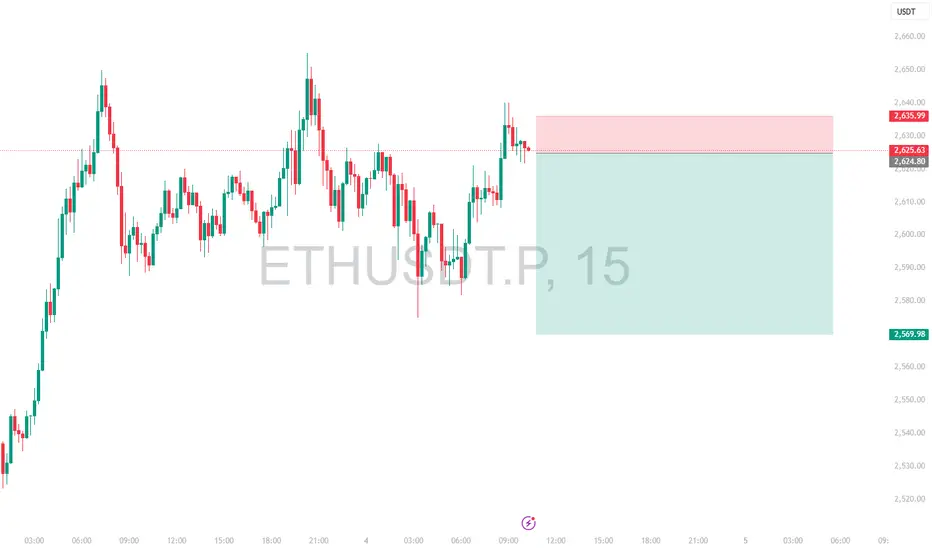
Intraday Short Setup | May 26th 2025 | Valid Until Daily ClosePrice has pushed into a potential intraday Pivot supply zone (red box) where sellers may step in. This trade is based on the expectation of a rejection from this area.
Entry: Red box — a short entry zone aligned with overhead supply
Stop Loss: Above the red zone (invalidates the setup)
Target: Green box — area to consider partial/full exit based on momentum
ETHUSDT has shown a strong bounce but is now approaching a key pivotal resistance zone
Risk-reward is favorable with a tight invalidation and clean downside target
Price may stall or reverse near the red box, creating short opportunity
Note:
This is an intraday trade idea that expires at 00:00 UTC (Daily Candle Close). Re-evaluate the setup if price remains indecisive near the entry zone close to that time.